


1 INTRODUCTION
One of the major outstanding issues in modern astrophysics is how the first ‘seeds’ of supermassive black holes (BHs) formed at high redshift. BHs with masses exceeding $M_{\rm BH} \gtrsim 10^9 \text{M}_\odot$
power the most luminous quasars that have been discovered near the edge of the observable Universe, the record holder being ULAS1120+0641 at z = 7.085 (Mortlock et al. Reference Mortlock2011). The very presence of such massive objects less than a Gyr after the Big Bang poses serious challenges for models of their formation and subsequent evolution (i.e., Volonteri Reference Volonteri2010; Johnson & Haardt Reference Johnson and Haardt2016; Latif & Ferrara Reference Latif and Ferrara2016).
$M_{\rm BH} \gtrsim 10^9 \text{M}_\odot$
power the most luminous quasars that have been discovered near the edge of the observable Universe, the record holder being ULAS1120+0641 at z = 7.085 (Mortlock et al. Reference Mortlock2011). The very presence of such massive objects less than a Gyr after the Big Bang poses serious challenges for models of their formation and subsequent evolution (i.e., Volonteri Reference Volonteri2010; Johnson & Haardt Reference Johnson and Haardt2016; Latif & Ferrara Reference Latif and Ferrara2016).
Proposed theories for the formation of BH seeds include remnants from the first generation of massive stars (e.g., Population III stars, Madau & Rees Reference Madau and Rees2001; Haiman & Loeb Reference Haiman and Loeb2001), where intermittent episodes of super-Eddington accretion could grow these seeds of ${\sim}100\;\text{M}_\odot$
into
${\sim}100\;\text{M}_\odot$
into ${\sim}10^9\;\text{M}_\odot$
BHs within several hundred Myr (Madau, Haardt, & Dotti Reference Madau, Haardt and Dotti2014, also see, for example, Wyithe & Loeb Reference Wyithe and Loeb2012; Alexander & Natarajan Reference Alexander and Natarajan2014; Volonteri, Silk, & Dubus Reference Volonteri, Silk and Dubus2015 for possible conditions leading to super-Eddington accretion onto BHs at high redshift). Alternatively, BH seeds may have been significantly more massive, formed from the rapid inflow and subsequent collapse of gas (e.g., Loeb & Rasio Reference Loeb and Rasio1994; Begelman, Volonteri, & Rees Reference Begelman, Volonteri and Rees2006; Lodato & Natarajan Reference Lodato and Natarajan2006; Choi, Shlosman, & Begelman Reference Choi, Shlosman and Begelman2015) or from collisions in dense star clusters (e.g., Portegies Zwart et al. Reference Portegies Zwart, Baumgardt, Hut, Makino and McMillan2004; Devecchi & Volonteri Reference Devecchi and Volonteri2009; Davies, Miller, & Bellovary Reference Davies, Miller and Bellovary2011; Lupi et al. Reference Lupi, Colpi, Devecchi, Galanti and Volonteri2014; Stone, Kuepper, & Ostriker Reference Stone, Kuepper and Ostriker2016). Starting with a more massive seed (e.g.,
${\sim}10^9\;\text{M}_\odot$
BHs within several hundred Myr (Madau, Haardt, & Dotti Reference Madau, Haardt and Dotti2014, also see, for example, Wyithe & Loeb Reference Wyithe and Loeb2012; Alexander & Natarajan Reference Alexander and Natarajan2014; Volonteri, Silk, & Dubus Reference Volonteri, Silk and Dubus2015 for possible conditions leading to super-Eddington accretion onto BHs at high redshift). Alternatively, BH seeds may have been significantly more massive, formed from the rapid inflow and subsequent collapse of gas (e.g., Loeb & Rasio Reference Loeb and Rasio1994; Begelman, Volonteri, & Rees Reference Begelman, Volonteri and Rees2006; Lodato & Natarajan Reference Lodato and Natarajan2006; Choi, Shlosman, & Begelman Reference Choi, Shlosman and Begelman2015) or from collisions in dense star clusters (e.g., Portegies Zwart et al. Reference Portegies Zwart, Baumgardt, Hut, Makino and McMillan2004; Devecchi & Volonteri Reference Devecchi and Volonteri2009; Davies, Miller, & Bellovary Reference Davies, Miller and Bellovary2011; Lupi et al. Reference Lupi, Colpi, Devecchi, Galanti and Volonteri2014; Stone, Kuepper, & Ostriker Reference Stone, Kuepper and Ostriker2016). Starting with a more massive seed (e.g., $M_{\rm BH} \sim 10^5 \text{M}_\odot$
) in models of BH growth eases the problem of assembling enough luminous
$M_{\rm BH} \sim 10^5 \text{M}_\odot$
) in models of BH growth eases the problem of assembling enough luminous ${\sim}10^9\;\text{M}_\odot$
BHs by redshifts z ~ 6 − 7 under the assumption of Eddington-limited accretion (e.g., Natarajan & Volonteri Reference Natarajan and Volonteri2012; Hirschmann et al. Reference Hirschmann, Somerville, Naab and Burkert2012).
${\sim}10^9\;\text{M}_\odot$
BHs by redshifts z ~ 6 − 7 under the assumption of Eddington-limited accretion (e.g., Natarajan & Volonteri Reference Natarajan and Volonteri2012; Hirschmann et al. Reference Hirschmann, Somerville, Naab and Burkert2012).
At present, directly observing the first high-redshift BH seeds is not feasible. Various studies have looked for AGN signatures in early galaxies at redshifts z ≳ 5, but they are not detected even in the deepest X-ray observations (e.g., Willott Reference Willott2011; Cowie, Barger, & Hasinger Reference Cowie, Barger and Hasinger2012; Treister et al. Reference Treister, Schawinski, Volonteri and Natarajan2013; Weigel et al. Reference Weigel2015; Vito et al. Reference Vito2016). Recently, however, a few ‘direct collapse’ BH candidates with $M_{\rm BH} \sim 10^5-10^6 \text{M}_\odot$
at z ≳ 6 have been proposed (Pacucci et al. Reference Pacucci2016) including the extremely luminous Lyα emitter CR7 (Sobral et al. Reference Sobral2015; Pallottini et al. Reference Pallottini2015; Hartwig et al. Reference Hartwig2016; Agarwal et al. Reference Agarwal2016; Smith et al. Reference Smith, Bromm and Loeb2016; Smidt, Wiggins, & Johnson Reference Smidt, Wiggins and Johnson2016), although see Bowler et al. (Reference Bowler2016) for more standard interpretations of the data. In any case, our knowledge of high-redshift BHs is primarily limited to luminous quasars with hefty BHs (
$M_{\rm BH} \sim 10^5-10^6 \text{M}_\odot$
at z ≳ 6 have been proposed (Pacucci et al. Reference Pacucci2016) including the extremely luminous Lyα emitter CR7 (Sobral et al. Reference Sobral2015; Pallottini et al. Reference Pallottini2015; Hartwig et al. Reference Hartwig2016; Agarwal et al. Reference Agarwal2016; Smith et al. Reference Smith, Bromm and Loeb2016; Smidt, Wiggins, & Johnson Reference Smidt, Wiggins and Johnson2016), although see Bowler et al. (Reference Bowler2016) for more standard interpretations of the data. In any case, our knowledge of high-redshift BHs is primarily limited to luminous quasars with hefty BHs ( $M_{\rm BH} \gtrsim 10^8-10^9 \text{M}_\odot$
).
$M_{\rm BH} \gtrsim 10^8-10^9 \text{M}_\odot$
).
A complementary approach to learn about BH seeds is to search for the smallest nuclear BHs ( $M_{\rm BH} \lesssim 10^5 \text{M}_\odot$
) in present-day dwarf galaxies, which provides the most direct observational constraints on seed masses (for earlier reviews, see Volonteri Reference Volonteri2010 and Greene Reference Greene2012). Unlike massive galaxies with BHs that have grown substantially through accretion and mergers, dwarf galaxies that have experienced significantly calmer merger histories may host BHs that are relatively pristine.
$M_{\rm BH} \lesssim 10^5 \text{M}_\odot$
) in present-day dwarf galaxies, which provides the most direct observational constraints on seed masses (for earlier reviews, see Volonteri Reference Volonteri2010 and Greene Reference Greene2012). Unlike massive galaxies with BHs that have grown substantially through accretion and mergers, dwarf galaxies that have experienced significantly calmer merger histories may host BHs that are relatively pristine.
Indeed, models of BH growth in a cosmological context indicate that the observational signatures indicative of seed formation are strongest in dwarf galaxies (Volonteri et al. Reference Volonteri, Lodato and Natarajan2008b; Volonteri & Natarajan Reference Volonteri and Natarajan2009; van Wassenhove et al. Reference van Wassenhove, Volonteri, Walker and Gair2010; Bellovary et al. Reference Bellovary2011; Habouzit, Volonteri, & Dubois Reference Habouzit, Volonteri and Dubois2016). The primary diagnostics at z ~ 0 include the BH occupation fraction, the distribution of BH masses, and BH-host galaxy scaling relations at low mass (for a review, see Volonteri Reference Volonteri2010). Figure 1 shows predictions from Volonteri et al. (Reference Volonteri, Lodato and Natarajan2008b) and van Wassenhove et al. (Reference van Wassenhove, Volonteri, Walker and Gair2010). At high velocity dispersions (and high masses), the BH occupation fraction is equal to 1 regardless of the initial seeds. Likewise, the M BH − σ relation is indistinguishable for the different seeding scenarios at the high-mass end. These results can be understood as the result of numerous mergers and accretion episodes resulting in the build-up of massive galaxies and their BHs. From Figure 1, we can see that the picture is entirely different in the low-mass regime. Some early galaxies will have quietly coasted through cosmic time without getting assembled into a massive galaxy, thereby retaining some ‘memory’ of the initial seeding conditions. The fraction of these galaxies that host a massive BH today will reflect the fraction of galaxies that hosted a massive BH at early times, where the expectation is a high occupation fraction in the case of light seeds (Pop III remnants) and a low occupation fraction in the case of heavy seeds (direct collapse). Predictions for the M BH − σ relation at z ~ 0 are also distinct at the low-mass end due to the different mass distributions of relatively ungrown BHs.

Figure 1. Predictions at z = 0 from the models of Volonteri, Lodato, & Natarajan (Reference Volonteri, Lodato and Natarajan2008b) and van Wassenhove et al. (Reference van Wassenhove, Volonteri, Walker and Gair2010) provide diagnostics for distinguishing between BH seed formation mechanisms. The observational signatures of BH seeds are strongest in dwarf galaxies. Left: BH occupation fraction as a function of velocity dispersion for light seeds (remnants from Pop III stars; red) and heavy seeds (direct collapse; purple). Courtesy of M. Volonteri. Right: M BH − σ relation at z = 0 starting with heavy (purple, left panel) and light (red, right panel) seeds. Observational data (black points) are from Tremaine et al. (Reference Tremaine2002). Adapted from Volonteri et al. (Reference Volonteri, Callegari, Colpi, Dotti and Mayer2008a).
Until recently, very few dwarf galaxies had observational evidence for hosting massive BHs ( $M_{\rm BH} \sim 10^4 -10^6 \text{M}_\odot$
) and these objects were thought to be extremely rare. In the past decade, the field has undergone rapid growth and we have gone from a handful of prototypical examples (e.g., NGC 4395; Filippenko & Sargent Reference Filippenko and Sargent1989, and Pox 52; Kunth, Sargent, & Bothun Reference Kunth, Sargent and Bothun1987) to large systematically assembled samples demonstrating that massive BHs in low-mass galaxies are much more common than previously thought (e.g., Greene & Ho Reference Greene and Ho2004; Reines, Greene, & Geha Reference Reines, Greene and Geha2013).
$M_{\rm BH} \sim 10^4 -10^6 \text{M}_\odot$
) and these objects were thought to be extremely rare. In the past decade, the field has undergone rapid growth and we have gone from a handful of prototypical examples (e.g., NGC 4395; Filippenko & Sargent Reference Filippenko and Sargent1989, and Pox 52; Kunth, Sargent, & Bothun Reference Kunth, Sargent and Bothun1987) to large systematically assembled samples demonstrating that massive BHs in low-mass galaxies are much more common than previously thought (e.g., Greene & Ho Reference Greene and Ho2004; Reines, Greene, & Geha Reference Reines, Greene and Geha2013).
Here, we review current observational studies that inform our understanding of the birth and early growth of massive BHs. This review has two main parts. In Section 2, we review observations of high-redshift BHs, with an emphasis on optical/near-infrared and X–ray surveys of the quasar population. In Section 3, we review searches for local relics of BH seeds in dwarf galaxies. We conclude in Section 4 with a discussion of how these observations are constraining models for the formation of the first seed BHs.
2 OBSERVATIONAL SIGNATURES OF HIGH-REDSHIFT QUASARS
The quasar spectral energy distribution (SED) covers a broad range of wavelengths. Quasars emit almost constant power per unit decade from the far-infrared to the hard X-ray band. The bolometric energy of a quasar peaks in the optical/UV which, at high redshift, is shifted to the near-infrared. A significant fraction of the total nuclear emission is in the X-ray band. Optical to near-infrared and X-ray surveys thus represent the most efficient way to select large, relatively unbiased samples of quasars over a large redshift range and especially at the greatest distances.
2.1. Optical and near-IR surveys
A quantum leap forward in the search for and the study of the primeval quasars has been obtained primarily by the Sloan Digital Sky Survey (SDSS, Fan et al. Reference Fan2001), complemented by the Canada–France High-Redshift Survey (CFHQS), the Pan STARRS survey (PSO, Kaiser et al. Reference Kaiser, Tyson and Wolff2002), the UKIDSS (Lawrence et al. Reference Lawrence2007) Large Area Survey (ULAS), the VISTA VIKING (Edge et al. Reference Edge2013), and VST ATLAS (Shanks et al. Reference Shanks2015) surveys. More recently, the first results from the Dark Energy Survey (DES, Reed et al. Reference Reed2015), the Subaru Suprime Cam surveys (Kashikawa et al. Reference Kashikawa2015), and the Hyper Suprime Cam (HSC) survey (Matsuoka et al. Reference Matsuoka2016) were published, and there are newly identified quasars from the Pan-STARRS1 survey (Bañados et al. Reference Bañados2016). At the time of writing, the most up to date compilation of optically selected quasars at z > 6 includes ~ 80 objects and these are listed in Table 1. Their rest-frame UV luminosity versus redshift is shown in Figure 2. Roughly 10% of these are also detected in the X-ray band in follow-up or snapshot pointings.

Figure 2. Rest frame UV luminosity (M 1450) versus redshift for the sample of the z > 6 quasars currently known in the literature mainly from the Calura et al. (Reference Calura2014) compilation, complemented by the results published in Venemans et al. (Reference Venemans2013), Venemans et al. (Reference Venemans2015), Bañados et al. (Reference Bañados2014), Carnall et al. (Reference Carnall2015), Kashikawa et al. (Reference Kashikawa2015), Wu et al. (Reference Wu2015), Reed et al. (Reference Reed2015), Matsuoka et al. (Reference Matsuoka2016), and Bañados et al. (Reference Bañados2016). The blues stars represent objects detected in the X-ray band either in pointed observations or as serendipitous sources in the field of view of different targets.
Table 1. The z > 6 quasar sample

Columns 1–5: Names, coordinates, UV luminosities and redshifts for the sample of quasars plotted in Figure 2. Column 6: References. Wil07/09/10/10b=Willott et al. (Reference Willott2007, Reference Willott2009, Reference Willott2010a, Reference Willott2010b), Fan01/03/04/06= Fan et al. (Reference Fan2001, Reference Fan, Strauss and Schneider2003, Reference Fan, Hennawi and Richards2004, Reference Fan, Strauss and Richards2006), Ven13/15= Venemans et al. (Reference Venemans2013, Reference Venemans2015), Car15=Carnall et al. (Reference Carnall2015), Jia08/09=Jiang et al. (Reference Jiang2008, Reference Jiang2009), Reed15=Reed et al. (Reference Reed2015), DeR11=De Rosa et al. (Reference Aird2011), Mat16=Matsuoka et al. (Reference Matsuoka2016), Mort09/11=Mortlock et al. (Reference Mortlock2009, Reference Mortlock2011), Kas15=Kashikawa et al. (Reference Kashikawa2015), Ban14/16=Banados et al. (Reference Bañados2014, Reference Bañados2016), Wan13=Wang et al. (Reference Baldwin, Phillips and Terlevich2013), Wu15=Wu et al. (Reference Wu2015), War=Warren et al. (in preparation). Column 7: The discovery surveys and/or instruments, as discussed in the main text.
From a visual inspection of Figure 2, it is evident that, with the exception of a few objects, only the bright-end tail of the luminosity distribution is currently sampled. A major step forward is expected by the current and foreseen HSC surveys that have already started to dig into the low-luminosity tail of the distribution (Matsuoka et al. Reference Matsuoka2016), and by the upcoming LSST survey that is designed to have the required depth and wavelength coverage to detect a large number of quasars at z ~ 7. The number density of QSOs brighter than M 1450 = −26.7 is of the order of one object per Gpc3 at z ~ 6 (see Fan Reference Fan2012 for a review) and thus large areas must be surveyed to a depth which is sufficient to find a sizable number of objects. Such a trade off is currently feasible only in the optical/near-infrared.
The space density peaks at z ~ 2–3, which is known as the quasar era or ‘cosmic noon’. Before and after the peak, the number density decreases sharply. The exponential decline at z > 3 was noted since the first optical surveys (Schmidt, Schneider, & Gunn Reference Schmidt, Schneider and Gunn1995) and now is put on solid grounds. The comoving density of z ~ 6 quasars is almost two orders of magnitude lower than that at the z ~ 2–3 peak.
The bright end of the QSO luminosity function from the 6 000 deg2 SDSS survey was extended to lower luminosities (M 1450 ~ −24 at z ~ 5) by McGreer et al. (Reference McGreer2013). The data reach below the break in the luminosity function at those redshifts (M*1450 ~ −27). The decrease in the density of luminous (M*1450 ~ −26) QSOs is more pronounced, by about a factor 2, going from z = 5 to z = 6 than from z = 4 to z = 5. Whilst the precise shape of the decline in the space density of luminous QSOs towards high redshift is debated, there is no doubt that they experienced a rapid evolution from the primeval Universe to cosmic noon.
The evolution rate and the shape of the luminosity function at lower luminosities are much more uncertain due to the lack of sensitive enough observations. An attempt to push the high-z QSO census towards low luminosities is presented in Ikeda et al. (Reference Ikeda2011) and Glikman et al. (Reference Glikman2011). They measured the luminosity function down to M 1450 ~ −22, but cannot push beyond z ~ 4. A summary of the shape of the QSO space density as a function of luminosity over the entire redshift range is shown in Figure 3 from Ikeda et al. (Reference Ikeda2011). The decline towards high redshifts can be reliably measured only for high luminosity QSOs. At low luminosities, the results are dominated by large uncertainties. Recently, however, Giallongo et al. (Reference Giallongo2015) has pushed to even lower luminosities. They find 22 AGN candidates at z > 4 in the CANDELS GOODS-South field, and estimate the UV luminosity function in the absolute magnitude interval − 22.5 ≲ M 1450 ≲ −18.5 and the redshift interval 4 < z < 6.5.

Figure 3. Redshift evolution of the quasar space density. Coloured lines indicate different values of M 1450. Dotted lines show the combined 2dF-SDSS Luminous Red Galaxies and Quasar Survey (2SLAQ), SDSS, the Spitzer wide area infrared extragalactic legacy survey (SWIRE), the NOAO Deep and Wide Field Survey (NDWFS), and the Deep Lens Survey (DLS). Dashed line shows the combined COSMOS and 2SLAQ QLF. From Ikeda et al. (Reference Ikeda2011). © AAS. Reproduced with permission.
The first supermassive BHs are expected to grow via gas accretion and mergers of smaller mass seed BHs (see Johnson & Haardt Reference Johnson and Haardt2016 this volume). The mergers of galaxies hosting BHs are also likely to trigger gas accretion and make them luminous optical and X-ray sources. If this were the case, high-z QSOs are expected to reside in galaxy overdense regions enhancing the probability of finding lower luminosity active supermassive BHs in their vicinity. A search for galaxy overdensities at high redshift over a relatively large area, using the Subaru Suprime Cam is reported by Utsumi et al. (Reference Utsumi2010) and recently extended by Morselli et al. (Reference Morselli2014) around the fields of four high-z ( ~ 6) QSOs with the Large Binocular Camera camera on the Large Binocular Telescope (LBT). Deep photometric images were obtained in the r-, i-, and z-bands down to a 50% completeness limit of zAB ~ 25 (see Figure 4). Candidate high-z dropouts were selected using a conservative i − z > 1.4 threshold. The results indicate that the spatial density of dropouts is higher than expected in a ‘blank’ field at the ~ 3.7σ level. An intensive programme of follow-up spectroscopic observations is currently underway with the LUCI spectrograph on the LBT. A recently approved Chandra Large Program (P.I. R. Gilli) will enable the association of high-z candidates with faint AGN emitting in the X-ray band.

Figure 4. i–z versus r–z diagram for the LBC sources in J1030 field (small gray dots; ≈ 30 000 objects). LBC primary and secondary i-dropouts are shown as red- and green-filled circles, respectively. Magenta dots are even fainter i-dropouts (25.2 < zAB < 25.5) All the i-dropout highlighted in the upper right part of the plot are undetected in the deep r-band (r ~ 27.5) LBT image. The LBC z ~ 5 galaxy candidates are shown as blue dots.
Despite strong cosmological evolution, active BHs show a self-similar behaviour for other properties such as the optical/near-infrared continuum and the emission line intensities. Also, the X-ray spectra are almost indistinguishable over the entire z ~ 0–7 redshift range. The detection of metal emission lines redward of Lyα suggests that rapid chemical enrichment has occurred. The mid- to far-infrared emission indicates the presence of hot dust heated from the nuclear radiation. The lack of significant changes along cosmic history, in the above described observables, challenges the physical interpretation and the models for the evolution of accreting supermassive BHs. A few departures from the self-similar behaviour were reported by Jiang et al. (Reference Jiang2010) in terms of a lack of mid-infrared emission, associated to hot dust, in two z ~ 6 quasars. The two objects lie in the low tail of the BH mass distribution of QSOs at z ~ 6, and could represent an early phase of evolution when the BH is growing and the dust is not yet produced.
2.2. X-ray surveys
The above described population of optically luminous QSOs hosting supermassive BHs ( $M_{\rm BH} > 10^9 \text{M}_\odot$
) at z > 6, likely represents the tip of the iceberg of the luminosity and mass functions. According to theoretical models for structure formation, massive BHs (M
BH ~ 104–107
$M_{\rm BH} > 10^9 \text{M}_\odot$
) at z > 6, likely represents the tip of the iceberg of the luminosity and mass functions. According to theoretical models for structure formation, massive BHs (M
BH ~ 104–107 $\text{M}_\odot$
) are predicted to be abundant in the early Universe. Moreover, it is well known that the majority of the accretion power, recorded in the spectrum of the X-ray background, is obscured by large amounts of gas and dust. The space density and the cosmological evolution of X-ray selected AGN is now relatively well understood, thanks to the large number of surveys performed with XMM-Newton, Chandra, and NuSTAR, built upon previous observations with ROSAT, ASCA, BeppoSAX, Swift-BAT, and INTEGRAL. The evolution of the luminosity function is computed on samples of a few thousand objects over a broad range of X-ray luminosities ( ~ 1042–1046 erg s−1) and up to redshifts 3–4 (e.g., Ueda et al. Reference Ueda, Akiyama, Hasinger, Miyaji and Watson2014; Miyaji et al. Reference Miyaji2015; Buchner et al. Reference Buchner2015; Aird et al. Reference Aird2015). The evolution of X-ray selected AGN including obscured objects, except the deeply buried Compton thick AGN, is described by a luminosity-dependent model and shown in Figures 5 and 6. The peak in the space density is at higher redshifts for higher luminosity objects, an effect known as downsizing that also describes the evolution of star-forming galaxies. The X-ray luminosity function and the evolution of obscured AGNs is accurately described by phenomenological models such as the Luminosity Dependent Density Evolution (LDDE) or the Flexible Double Power Law (FDPL) up to z ~ 3–4. Both LDDE and FDPL suggest a complex luminosity dependence in the redshift evolution, possibly associated to the accretion rate. Irrespective of the adopted parameterisation, the space density exponentially decreases up to z ~ 5. At higher redshifts, the amplitude and the shape of the decline in the QSO space density is not well constrained.
$\text{M}_\odot$
) are predicted to be abundant in the early Universe. Moreover, it is well known that the majority of the accretion power, recorded in the spectrum of the X-ray background, is obscured by large amounts of gas and dust. The space density and the cosmological evolution of X-ray selected AGN is now relatively well understood, thanks to the large number of surveys performed with XMM-Newton, Chandra, and NuSTAR, built upon previous observations with ROSAT, ASCA, BeppoSAX, Swift-BAT, and INTEGRAL. The evolution of the luminosity function is computed on samples of a few thousand objects over a broad range of X-ray luminosities ( ~ 1042–1046 erg s−1) and up to redshifts 3–4 (e.g., Ueda et al. Reference Ueda, Akiyama, Hasinger, Miyaji and Watson2014; Miyaji et al. Reference Miyaji2015; Buchner et al. Reference Buchner2015; Aird et al. Reference Aird2015). The evolution of X-ray selected AGN including obscured objects, except the deeply buried Compton thick AGN, is described by a luminosity-dependent model and shown in Figures 5 and 6. The peak in the space density is at higher redshifts for higher luminosity objects, an effect known as downsizing that also describes the evolution of star-forming galaxies. The X-ray luminosity function and the evolution of obscured AGNs is accurately described by phenomenological models such as the Luminosity Dependent Density Evolution (LDDE) or the Flexible Double Power Law (FDPL) up to z ~ 3–4. Both LDDE and FDPL suggest a complex luminosity dependence in the redshift evolution, possibly associated to the accretion rate. Irrespective of the adopted parameterisation, the space density exponentially decreases up to z ~ 5. At higher redshifts, the amplitude and the shape of the decline in the QSO space density is not well constrained.

Figure 5. The space density of X-ray selected AGN for different luminosity bins as labelled. The peak progressively moves to lower redshifts as the luminosity decreases. From Ueda et al. (Reference Ueda, Akiyama, Hasinger, Miyaji and Watson2014). © AAS. Reproduced with permission.

Figure 6. The same as for Figure 5 but from Figure 18 in Aird et al. (Reference Aird2015).
In order to improve our understanding of BH growth and of AGN triggering mechanisms in the early Universe, it is necessary to increase the statistics of the AGN population at z > 3. In the last decade, observations obtained with XMM-Newton and Chandra were sensitive enough to investigate the high-redshift Universe in the X-ray band. Two pioneering works were performed in the 2 deg2 COSMOS field, using XMM-Newton (Brusa et al. Reference Brusa2009 N z > 3 = 40), and Chandra, on the central 0.9 deg2 (Civano et al. Reference Civano2011, N z > 3 = 81), reaching a luminosity limit of L 2-10keV = 1044.2 erg s−1 and L 2-10keV = 1043.55 erg s−1, respectively. Vito et al. (Reference Vito2013) were able to extend their analysis down to L 2-10keV ≃ 1043 erg s−1, using the 4 Ms Chandra Deep Field South (CDF-S, Xue et al. Reference Xue2011) catalogue (N z > 3 = 34); the same group (Vito et al. Reference Vito2014) studied the 2–10 keV luminosity function in the redshift range z = [3–5], combining deep and shallow surveys (N z > 3 = 141). Kalfountzou et al. (Reference Kalfountzou, Civano, Elvis, Trichas and Green2014) combined the C-COSMOS sample with the one from the wide and shallow ChaMP survey (Kim et al. Reference Kim2007; Green et al. Reference Green2009; Trichas et al. Reference Trichas2012) to have a sample of 211 objects at z > 3 and 27 at z > 4, down to a luminosity L 2-10keV = 1043.55 erg s−1. All these works show a decline of the AGN space density at z > 3, but they are not able to put significantly better constraints at z > 4, due to still poor statistics. Moreover, when combining different surveys, one has to assume completeness corrections, therefore introducing uncertainties in the final results.
Recently, Georgakakis et al. (Reference Georgakakis2015) combined data from different surveys to obtain a sample of 340 sources at z > 3 over about three orders of magnitude, L 2-10keV ≃ [1043–1046] erg s−1, whilst Marchesi et al. (Reference Marchesi2016b) collect 174 objects at z ⩾ 3 in the 2 deg2 Chandra Legacy survey (Marchesi et al. Reference Marchesi2016a; Civano et al. Reference Civano2016). The former is the largest sample of X-ray selected z > 3 AGN so far published, whilst the latter is that with the highest spectroscopic redshift completeness (50%). Both of them agree on the fact that the number density of high-z QSOs exponentially decrease in the redshift range z ~ 3–5; moreover, it is suggested that the evolution of the luminous ( > 1045 erg s−1) QSOs is milder than that of lower luminosity objects. Marchesi et al. (Reference Marchesi2016b) also point out that at luminosities larger than 1044 erg s−1, the ratio between obscured and unobscured AGN at z ~ 5 is larger by a factor 2 than that observed at z ~ 3–4.
An improved determination of the shape of the bright end of the X-ray luminosity function is expected from the currently ongoing large area X-ray surveys in SDSS Stripe82 (LaMassa et al. Reference LaMassa2016) and XXL (Pierre et al. Reference Pierre2016). They are approaching a sky coverage of the order of 100 deg2 in the soft X-ray band and will act as pathfinders of the forthcoming all sky eROSITA X-ray survey (Merloni et al. Reference Merloni2012).
A different approach with respect to the blind X-ray detection adopted in the above described works is pursued in Fiore et al. (Reference Fiore2012a). The search for X-ray emission from high-redshift AGNs in the CDF-S is performed using a specifically developed X-ray detection technique, optimised for faint sources, and further assisted by the analysis of deep optical and near-infrared images. They evaluated the comoving space density of faint X-ray sources at z > 3 with a sample of 40 sources. In the highest redshift bin z > 5.8 (and corresponding X-ray luminosities > 1043.5 erg s−1), there are only two sources. The estimated space density of ~ 6.6 × 10⁻⁶ Mpc−3 is likely to be an upper limit. It is concluded that the slope of the faint end of the luminosity function is much flatter than the bright end. The characteristic luminosity L* evolves rapidly and the density of X-ray selected AGN decreases by more than a factor 3 from z ~ 3 to z ~ 6. The above described technique is further elaborated by Giallongo et al. (Reference Giallongo2015) with the aim to estimate the AGN UV emissivity and their contribution to the reionisation of the Universe. The main conclusion of their analysis is that AGN may play a relevant role in the reionisation of the Universe at z > 6. The large uncertainty in the data and the paucity of z > 6 sources in the sample call for the need of larger samples and deeper data.
More recently, Cappelluti et al. (Reference Cappelluti2016) employed a similar procedure based on the prior knowledge of the position of the optical counterpart of ~ 35 000 CANDELS sources selected in the H-band in the deepest area of the Chandra 4 Ms observations. This technique led to a significant increase in the number of X-ray detections down to a limiting flux of ~ 10−17 erg cm−2 s−1. Also, in this case, there are no clear examples of X-ray sources at very high redshifts. Moreover, the number of candidate high-z AGN in Cappelluti et al. (Reference Cappelluti2016) is lower, by about a factor 2, than that reported in Giallongo et al. (Reference Giallongo2015).
Another systematic search for X-ray selected AGN at z > 5–6 is presented by Weigel et al. (Reference Weigel2015). They started from a sample of X-ray confirmed sources in the 4 Ms CDF-S and employed a variety of tools to assess the robustness of the high-z sample (visual classification, colour criteria, X-ray hardness ratios, and a redetermination of the best fit photo-z). They conclude that only a few, possibly none, of the high-z candidates survived after the analysis suggesting that the space density of z > 5 X-ray selected AGN drops even faster than previously reported. The dearth of X-ray emitting AGNs at high redshift is confirmed by the X-ray stacking analysis of the 4 Ms Chandra data at the position of colour-selected z ~ 6, 7, and 8 CANDELS galaxy candidates (Treister et al. Reference Treister, Schawinski, Volonteri and Natarajan2013). The upper limits on the average X-ray luminosities are of the order of 1042 − 43 erg s−1 in the hard X-ray band.
A further deep search for X-ray emission from high redshift galaxies in the CDF-S using the 7 Ms data (Luo et al., in preparation) was recently performed by Vito et al. (Reference Vito2016), stacking the data at the positions of more than 2 000 optically selected galaxies. They find that the stacked X-ray emission in galaxies at z ~ 4–5 is likely dominated by processes related to star formation. Mass accretion onto SMBHs in individually X-ray-undetected galaxies is negligible, compared with the BH accretion rate density measured for samples of X-ray detected AGN. The ultradeep limiting flux is achieved only on a small portion of the field of view of the order of a few arcminutes, highlighting the need of larger area surveys to uncover high-redshift SMBHs.
The bottom line is that the current number of X-ray selected AGN at very high redshift (z > 6) is consistent with zero. There might be a few candidates, but either the redshift determination is uncertain or the source could be a spurious detection in X-rays or both. Much deeper X-ray observations will certainly help to obtain additional and tighter constraints on the emissivity of high-redshift AGN.
2.3. ATHENA surveys
The detection of large, statistically meaningful samples of QSOs around and below the L* luminosity at z > 6, and over a wide range of obscuring column densities, would provide unique constraints on the formation and early growth of BHs. This will require a next generation of X-ray observatories that can perform surveys to comparable depths as the deepest Chandra fields, but over a substantially larger areas. The ATHENA X-ray observatory (Nandra et al. Reference Nandra2013), currently approved as an ESA large mission for a launch in 2028, has the capability to probe this new discovery space.
The prospects for a multi-tiered ATHENA Wide Field Imaging survey, combining extremely deep and shallower wide area observations, include the ability to identify a statistically meaningful sample of AGNs at very high (z > 6) redshifts and thereby revolutionise our understanding of the early Universe at the epoch of reionisation (Aird et al. Reference Aird2013). The multi-cone ATHENA Wide Field Imager (WFI) survey has been designed to maximise the instrument capabilities and the expected breakthroughs in the determination of the luminosity function and its evolution at high ( > 4) and very high ( > 6) redshifts. It is a major investment of the entire science programme and will take more than 1 yr of observations.
To adequately constrain the faint end of the luminosity function (L ~ 1043 − 44 erg s−1 at z ~ 6–8) requires a survey that reaches flux limits of ~ 3 × 10⁻¹⁷ erg s−1 cm−2 over an area a few square degrees and of ~ 2 × 10⁻¹⁶ erg s−1 cm−2 over several tens of square degrees. This coverage is well beyond the capability of current X-ray observatories. The expected output of the multitiered Athena WFI survey is shown in Figure 7 over the entire range of redshifts, and well within the epoch of the reionisation (i.e., up to z ~ 10). From a visual inspection, it is clear that X-ray surveys will nicely complement current and future optical and near-infrared surveys sampling the low-luminosity tail of the distribution.

Figure 7. The luminosity-redshift plane of representative X-ray and optical surveys as labelled. The blue squares are the sources detected in current X-ray surveys. Data are from the COSMOS-Legacy survey and the Chandra Deep Field South. Filled squares represent sources with a spectroscopic redshift, whilst empty squares have photo-z’s. The red triangles are the SDSS QSOs reported in Figure 2. The open empty blue circles are the predictions for the Euclid surveys (Roche et al. Reference Roche2012). The black diamonds are the predictions from the large and deep Athena surveys (Aird et al. Reference Aird2013).
Even though the ATHENA multi-cone survey has been designed to detect several hundreds ( > 400, at z > 6) of AGN minimising the obscuration biases, a full multi-wavelength approach that combines world-class ground-based facilities and space-based missions is needed to understand the physics of the early evolutionary stages. The search for optical and near-infrared counterparts of the ATHENA X-ray sources will require the survey of large sky areas, from a few up to several tens of square degrees, down to faint and ultra-faint magnitudes. The typical magnitudes of the optical counterparts of large samples of Chandra and XMM sources in the COSMOS and CDF-S fields are shown in Figure 8. The LSST-Deep and Euclid-Deep fields (reaching AB magnitudes ~ 28 and ~ 26 in the optical and near-infrared, respectively, over 40 deg2), are well matched to the various layers of the ATHENA surveys. For the faintest X-ray sources, the superior capabilities (near-infrared AB magnitude limit of about 30) of the James Webb Space Telescope (JWST) will be needed.

Figure 8. The observed R magnitudes of X-ray source optical counterparts in the XMM and Chandra COSMOS survey (red dots) and in the CDF-S 4 Ms exposure (blue dots). Optically undetected sources are reported with arrows. The area enclosed between the two diagonal lines corresponds to X-ray to optical flux ratios typical of X-ray selected AGN. Optical bright, X-ray faint sources in the lower left part of the diagram are mainly low-luminosity AGNs and star-forming galaxies. The ATHENA limits are indicated by small red squares. High-redshift AGNs are expected to be extremely faint or undetectable in the optical bands, depending on redshift.
Accurate redshift measurements will be provided by near-infrared spectroscopic follow-up from the planned European Extremely Large Telescope (E-ELT), which will deliver superb spectroscopic capabilities down to HAB ~ 29. The cold dust content and the molecular gas dynamics of the faint obscured AGN will be measured by the ALMA interferometer, mainly using the [CII] 158 μm line (Pentericci et al. Reference Pentericci2016). The Square Kilometer Array (SKA) will detect radio emission amongst a sizable fraction of high-z obscured AGN. It is interesting to note that at the time of the ATHENA surveys, both SKA and E-ELT should be fully operational. In Figure 9, the SED of an obscured AGN at z = 7 is shown along with the sensitivities of major multi-wavelength observatories.

Figure 9. Broadband SED of a moderate-luminosity obscured AGN (as labelled) at z = 7, which will be observable in the ATHENA surveys. The thick black line is that of an obscured AGN with similar luminosity and obscuring column density in the COSMOS survey (Lusso et al. Reference Lusso2011) redshifted to z = 7. The 3σ sensitivities (for a typical survey exposure) of SKA, ALMA, SPICA, JWST, and E-ELT are also shown, as labelled (Aird et al. Reference Aird2013).
Finally, ATHENA may be able to reveal the presence of heavily obscured, accreting supermassive BHs within samples of high-z galaxies that remain beyond the spectroscopic capabilities of E-ELT. Deep observations with the X-ray Integral Field Unit (XIFU) would provide ultra-deep, high-resolution X-ray spectroscopy and may directly measure the redshift of deeply buried, Compton thick AGNs at z > 8 if a strong 6.4 keV (rest-frame) Fe Kα emission line is detected (see Figure 10). The detection of such a line would place constraints on the metallicity and could thus constrain the star-formation history of the host galaxy.

Figure 10. The instrumental background free windows in the XIFU detector where a highly redshifted (as labelled), iron Kα could be detected. Simulations show that an ultra-deep 1 Ms exposure could reveal heavily obscured line dominated sources at z ~ 8.
By sampling moderate to low-luminosity AGNs, ATHENA will start to probe the BH mass function towards values of $M_{\rm BH} \sim 10^{6-7} \text{M}_{\odot}$
, depending on accretion rate. This will help pave the way for detailed studies of accretion physics over a broad range of BH and host galaxy masses and luminosities. The X-ray Surveyor, a large mission concept that is currently being studied for the next Decadal Survey in the United States, would be sensitive to fainter X-ray fluxes than ATHENA due to the sub-arcsec spatial resolution. This would enable the BH mass function at high redshift to be probed to even lower masses, ultimately providing tighter constraints on BH seeds.
$M_{\rm BH} \sim 10^{6-7} \text{M}_{\odot}$
, depending on accretion rate. This will help pave the way for detailed studies of accretion physics over a broad range of BH and host galaxy masses and luminosities. The X-ray Surveyor, a large mission concept that is currently being studied for the next Decadal Survey in the United States, would be sensitive to fainter X-ray fluxes than ATHENA due to the sub-arcsec spatial resolution. This would enable the BH mass function at high redshift to be probed to even lower masses, ultimately providing tighter constraints on BH seeds.
3 LOCAL RELICS OF BLACK HOLE SEEDS IN DWARF GALAXIES
As discussed above, the detection of the first high-redshift BH seeds is beyond our current capabilities and will continue to be challenging even with the next generation of ground- and space-based observatories. However, present-day dwarf galaxies, which have low masses and relatively quiet merger histories, offer another avenue to observationally constrain the origin of massive BHs. Searching for the smallest nuclear BHs in today’s dwarf galaxies ( $M_{\rm BH} \lesssim 10^{5} \text{M}_{\odot}$
) and studying their properties can place valuable constraints on the masses, host galaxies, and even the formation mechanism of BH seeds (Volonteri Reference Volonteri2010; Greene Reference Greene2012).
$M_{\rm BH} \lesssim 10^{5} \text{M}_{\odot}$
) and studying their properties can place valuable constraints on the masses, host galaxies, and even the formation mechanism of BH seeds (Volonteri Reference Volonteri2010; Greene Reference Greene2012).
3.1. Dynamical searches
In general, the most reliable method for discovering massive BHs and measuring their masses is to use stellar or gas dynamics to weigh the central BH (for a review, see Kormendy & Ho Reference Kormendy and Ho2013). There are a few detections and upper limits on dynamical BH masses in nearby dwarf galaxies, and these are summarised in Table 2
Footnote
1
. However, at present, dynamical searches are quite limited since the gravitational sphere of influence cannot be resolved for low-mass BHs in dwarf galaxies much beyond the Local Group. Consider, for example, a $10^5 \text{M}_\odot$
BH in a dwarf galaxy with a stellar velocity dispersion of σ = 30 km s−1. The radius of influence in this case is only ~ 0.5 pc (where r
infl = GM
BH/σ2). Future large ( ~ 30 m) ground-based telescopes will expand the volume in which we can use dynamical methods to search for massive BHs in dwarf galaxies, but for now, we are forced to look for accreting BHs shining as AGNs in populations of more distant dwarf galaxies.
$10^5 \text{M}_\odot$
BH in a dwarf galaxy with a stellar velocity dispersion of σ = 30 km s−1. The radius of influence in this case is only ~ 0.5 pc (where r
infl = GM
BH/σ2). Future large ( ~ 30 m) ground-based telescopes will expand the volume in which we can use dynamical methods to search for massive BHs in dwarf galaxies, but for now, we are forced to look for accreting BHs shining as AGNs in populations of more distant dwarf galaxies.
Table 2. BH masses and upper limits in nearby dwarf galaxies based on stellar and gas dynamics.

a Also see e.g., Dressler & Richstone (Reference Dressler and Richstone1988), van der Marel et al. (Reference van der Marel, Cretton, de Zeeuw and Rix1998), Joseph et al. (Reference Joseph2001), Verolme et al. (Reference Verolme2002), Kormendy (Reference Kormendy and Ho2004).
3.2. Optically selected AGNs
The first dwarf galaxies found to host AGNs, NGC 4395 (Filippenko & Sargent Reference Filippenko and Sargent1989), and Pox 52 (Kunth et al. Reference Kunth, Sargent and Bothun1987), were discovered nearly three decades ago. NGC 4395 is a late-type dwarf spiral galaxy and Pox 52 is a dwarf elliptical (Filippenko & Ho Reference Filippenko and Ho2003; Barth et al. Reference Barth, Ho, Rutledge and Sargent2004, see Figure 11). Both galaxies have stellar masses of $M_\star \sim 10^9 \text{M}_\odot$
and show clear AGN signatures, including high-ionisation narrow emission lines and broad Balmer lines. NGC 4395 also exhibits a compact radio jet (Wrobel & Ho Reference Wrobel and Ho2006) and large variability in X-rays (Vaughan et al. Reference Vaughan, Iwasawa, Fabian and Hayashida2005; Moran et al. Reference Moran2005). Estimates for the BH masses in these systems are on the order of a few
$M_\star \sim 10^9 \text{M}_\odot$
and show clear AGN signatures, including high-ionisation narrow emission lines and broad Balmer lines. NGC 4395 also exhibits a compact radio jet (Wrobel & Ho Reference Wrobel and Ho2006) and large variability in X-rays (Vaughan et al. Reference Vaughan, Iwasawa, Fabian and Hayashida2005; Moran et al. Reference Moran2005). Estimates for the BH masses in these systems are on the order of a few $\times 10^5 \text{M}_\odot$
(Peterson et al. Reference Peterson2005; Thornton et al. Reference Thornton, Barth, Ho, Rutledge and Greene2008), with a recent dynamical mass measurement for the BH in NGC 4395 by den Brok et al. (Reference den Brok2015, see Table 2). For a long time, NGC 4395 and Pox 52 were the only dwarf galaxies known to host massive BHs.
$\times 10^5 \text{M}_\odot$
(Peterson et al. Reference Peterson2005; Thornton et al. Reference Thornton, Barth, Ho, Rutledge and Greene2008), with a recent dynamical mass measurement for the BH in NGC 4395 by den Brok et al. (Reference den Brok2015, see Table 2). For a long time, NGC 4395 and Pox 52 were the only dwarf galaxies known to host massive BHs.
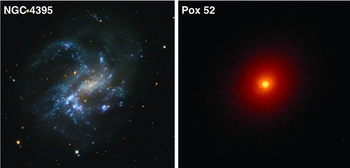
Figure 11. Prototypical examples of dwarf galaxies hosting AGN. Left: Ground-based image of NGC 4395 (d ~ 4 Mpc). Image courtesy of Bob Franke/Focal Pointe Observatory. Right: HST/ACS F814W archival image of Pox 52 using logarithmic scaling (d ~ 90 Mpc; also see Thornton et al. Reference Thornton, Barth, Ho, Rutledge and Greene2008).
Once the SDSS became available, systematic searches in the low-mass regime began. Greene & Ho (Reference Greene and Ho2004, Reference Greene and Ho2007) conducted the first searches for low-mass BHs using SDSS spectroscopy (also see Dong et al. Reference Dong2012, for a similar study). They searched for broad-line AGN, for which they estimated BH masses (Greene & Ho Reference Greene and Ho2005), and found ~ 200 objects with $M_{\rm BH} \lesssim 10^{6.5}\;\text{M}_\odot$
. These BHs, therefore, have masses comparable to or less than the BH at the centre of the Milky Way (Ghez et al. Reference Ghez2008). The median BH mass of the Greene & Ho (Reference Greene and Ho2007) sample is
$M_{\rm BH} \lesssim 10^{6.5}\;\text{M}_\odot$
. These BHs, therefore, have masses comparable to or less than the BH at the centre of the Milky Way (Ghez et al. Reference Ghez2008). The median BH mass of the Greene & Ho (Reference Greene and Ho2007) sample is $\langle M_{\rm BH}\rangle \sim 1.3 \times 10^6\;\text{M}_\odot$
. Barth, Greene, & Ho (Reference Barth, Greene and Ho2008) conducted a complementary search for narrow-line AGN in low-luminosity galaxies with absolute magnitudes fainter than Mg
= −20 mag. They present a sample of 29 objects with stellar velocity dispersions in the range σ⋆ ~ 40–90 km s−1. The host galaxies in the Greene & Ho (Reference Greene and Ho2007) and Barth et al. (Reference Barth, Greene and Ho2008) samples have median absolute g-band magnitudes of ⟨Mg
⟩ ~ −19.3 and ⟨Mg
⟩ ~ −19.0, respectively, and are thus sub-L
⋆ galaxies. These samples include a few galaxies with stellar masses similar to NGC 4395 and Pox 52, however, the vast majority of the galaxies in these samples are more massive than a few
$\langle M_{\rm BH}\rangle \sim 1.3 \times 10^6\;\text{M}_\odot$
. Barth, Greene, & Ho (Reference Barth, Greene and Ho2008) conducted a complementary search for narrow-line AGN in low-luminosity galaxies with absolute magnitudes fainter than Mg
= −20 mag. They present a sample of 29 objects with stellar velocity dispersions in the range σ⋆ ~ 40–90 km s−1. The host galaxies in the Greene & Ho (Reference Greene and Ho2007) and Barth et al. (Reference Barth, Greene and Ho2008) samples have median absolute g-band magnitudes of ⟨Mg
⟩ ~ −19.3 and ⟨Mg
⟩ ~ −19.0, respectively, and are thus sub-L
⋆ galaxies. These samples include a few galaxies with stellar masses similar to NGC 4395 and Pox 52, however, the vast majority of the galaxies in these samples are more massive than a few $\times 10^9 \text{M}_\odot$
and, for the most part, do not probe the dwarf galaxy regime (see Barth et al. Reference Barth, Greene and Ho2008 and Figure 12 here).
$\times 10^9 \text{M}_\odot$
and, for the most part, do not probe the dwarf galaxy regime (see Barth et al. Reference Barth, Greene and Ho2008 and Figure 12 here).

Figure 12. Optical signatures of active massive BHs in dwarf galaxies adapted from Reines et al. (Reference Reines, Greene and Geha2013). (a) BPT diagram for ~ 25000 dwarf emission line galaxies in the SDSS with $M_\star \lesssim 3 \times 10^9 \text{M}_\odot$
and z < 0.055. Thirty-five objects fall in the AGN part of the diagram (red points) and 101 objects fall in the ‘composite’ (AGN+SF) part of the diagram (purple points). Of these 136 dwarf galaxies with narrow-line signatures indicating an active massive BH, 10 have broad Hα emission likely signifying dense gas orbiting close to the BH. An additional 15 galaxies in the star-forming part of the BPT diagram exhibit broad Hα emission in their spectra. (b) Distribution of BH masses for the galaxies with broad Hα emission in their SDSS spectra. BH masses are calculated using equation (5) in Reines et al. (Reference Reines, Greene and Geha2013), which is based on the method of Greene & Ho (Reference Greene and Ho2005) but uses the updated radius–luminosity relationship of Bentz et al. (Reference Bentz2013). The apparent excess at larger BH masses for the BPT star-forming objects (blue histogram) is most likely due to SNe masquerading as broad-line AGN (e.g., Baldassare et al. Reference Baldassare2016a). For the more secure broad-line AGN candidates (BPT AGN + composites; orange histogram), the median BH mass is just
$M_\star \lesssim 3 \times 10^9 \text{M}_\odot$
and z < 0.055. Thirty-five objects fall in the AGN part of the diagram (red points) and 101 objects fall in the ‘composite’ (AGN+SF) part of the diagram (purple points). Of these 136 dwarf galaxies with narrow-line signatures indicating an active massive BH, 10 have broad Hα emission likely signifying dense gas orbiting close to the BH. An additional 15 galaxies in the star-forming part of the BPT diagram exhibit broad Hα emission in their spectra. (b) Distribution of BH masses for the galaxies with broad Hα emission in their SDSS spectra. BH masses are calculated using equation (5) in Reines et al. (Reference Reines, Greene and Geha2013), which is based on the method of Greene & Ho (Reference Greene and Ho2005) but uses the updated radius–luminosity relationship of Bentz et al. (Reference Bentz2013). The apparent excess at larger BH masses for the BPT star-forming objects (blue histogram) is most likely due to SNe masquerading as broad-line AGN (e.g., Baldassare et al. Reference Baldassare2016a). For the more secure broad-line AGN candidates (BPT AGN + composites; orange histogram), the median BH mass is just $\langle M_{\rm BH}\rangle \sim 2 \times 10^5 \text{M}_\odot$
. All 10 of the broad-line AGN and composites are also detected in X-rays with Chandra (Baldassare et al., Reference Baldassare, Reines, Gallo and Greene2016b). © AAS. Reproduced with permission.
$\langle M_{\rm BH}\rangle \sim 2 \times 10^5 \text{M}_\odot$
. All 10 of the broad-line AGN and composites are also detected in X-rays with Chandra (Baldassare et al., Reference Baldassare, Reines, Gallo and Greene2016b). © AAS. Reproduced with permission.
Reines et al. (Reference Reines, Greene and Geha2013) conducted the first systematic search for active massive BHs in dwarf galaxies by analysing spectra from the SDSS, specifically targeting galaxies with stellar masses $M_\star \le 3 \times 10^9\;\text{M}_\odot$
Footnote
2
and redshifts z ⩽ 0.055. This work resulted in more than an order of magnitude increase in the number of known dwarf galaxies with massive BHs. Reines et al. (Reference Reines, Greene and Geha2013) present a sample of 136 dwarf galaxies with stellar masses in the range
$M_\star \le 3 \times 10^9\;\text{M}_\odot$
Footnote
2
and redshifts z ⩽ 0.055. This work resulted in more than an order of magnitude increase in the number of known dwarf galaxies with massive BHs. Reines et al. (Reference Reines, Greene and Geha2013) present a sample of 136 dwarf galaxies with stellar masses in the range $10^{8.5} \lesssim M_\star \lesssim 10^{9.5} \text{M}_\odot$
( ~ SMC to LMC) that exhibit spectroscopic photoionisation signatures of active BHs based on standard narrow emission-line diagnostic diagrams (Kewley et al. Reference Kewley, Groves, Kauffmann and Heckman2006, and references therein)Footnote
3
. Of these, 35 objects fall in the AGN part of the [O III]/Hβ versus [N II]/Hα (i.e., BPT; Baldwin, Phillips, & Terlevich Reference Baldwin, Phillips and Terlevich1981) diagram (including NGC 4395 and two objects from the Barth et al. Reference Barth, Greene and Ho2008 sample) and 101 objects fall in the ‘composite’ region, possibly indicating contributions from both AGN activity and star formation (Figure 12). The location of the composites in the [O III]/Hβ versus [S II]/Hα and [O III]/Hβ versus [O I]/Hα diagnostic diagrams indicates the majority of these objects have Seyfert-like line ratios and very likely do indeed host massive BHs. Broad Hα emission (FWHM ~ 600–1600 km s−1) was detected in the spectra of six AGNs and four composites (including NGC 4395, two objects from the Greene & Ho Reference Greene and Ho2007 sample, and the dwarf disk galaxy from Dong et al. Reference Dong2007). Using standard virial techniques (see Equation 5 in Reines et al. Reference Reines, Greene and Geha2013, and references therein), the range of BH masses for the 10 broad-line AGNs and composites is
$10^{8.5} \lesssim M_\star \lesssim 10^{9.5} \text{M}_\odot$
( ~ SMC to LMC) that exhibit spectroscopic photoionisation signatures of active BHs based on standard narrow emission-line diagnostic diagrams (Kewley et al. Reference Kewley, Groves, Kauffmann and Heckman2006, and references therein)Footnote
3
. Of these, 35 objects fall in the AGN part of the [O III]/Hβ versus [N II]/Hα (i.e., BPT; Baldwin, Phillips, & Terlevich Reference Baldwin, Phillips and Terlevich1981) diagram (including NGC 4395 and two objects from the Barth et al. Reference Barth, Greene and Ho2008 sample) and 101 objects fall in the ‘composite’ region, possibly indicating contributions from both AGN activity and star formation (Figure 12). The location of the composites in the [O III]/Hβ versus [S II]/Hα and [O III]/Hβ versus [O I]/Hα diagnostic diagrams indicates the majority of these objects have Seyfert-like line ratios and very likely do indeed host massive BHs. Broad Hα emission (FWHM ~ 600–1600 km s−1) was detected in the spectra of six AGNs and four composites (including NGC 4395, two objects from the Greene & Ho Reference Greene and Ho2007 sample, and the dwarf disk galaxy from Dong et al. Reference Dong2007). Using standard virial techniques (see Equation 5 in Reines et al. Reference Reines, Greene and Geha2013, and references therein), the range of BH masses for the 10 broad-line AGNs and composites is $M_{\rm BH} \sim 10^5-10^6 \text{M}_\odot$
with a median of
$M_{\rm BH} \sim 10^5-10^6 \text{M}_\odot$
with a median of $\langle M_{\rm BH}\rangle \sim 2 \times 10^5\;\text{M}_\odot$
. All 10 of these objects are detected in X-rays with Chandra (Baldassare et al., Reference Baldassare, Reines, Gallo and Greene2016b). The flux limit of the SDSS makes it very unlikely to detect broad-line AGNs with BH masses much less than
$\langle M_{\rm BH}\rangle \sim 2 \times 10^5\;\text{M}_\odot$
. All 10 of these objects are detected in X-rays with Chandra (Baldassare et al., Reference Baldassare, Reines, Gallo and Greene2016b). The flux limit of the SDSS makes it very unlikely to detect broad-line AGNs with BH masses much less than $M_{\rm BH} \sim 10^5 \text{M}_\odot$
at an Eddington ratio of ~ 10% (Reines et al. Reference Reines, Greene and Geha2013).
$M_{\rm BH} \sim 10^5 \text{M}_\odot$
at an Eddington ratio of ~ 10% (Reines et al. Reference Reines, Greene and Geha2013).
Follow-up observations of the Reines et al. (Reference Reines, Greene and Geha2013) sample has led to the discovery of a new record holder for the least-massive BH known in a galaxy nucleus. Baldassare et al. (Reference Baldassare, Reines, Gallo and Greene2015) present evidence for a ${\sim}50\,000\;\text{M}_\odot$
BH at the centre of RGG 118, which has a stellar mass of
${\sim}50\,000\;\text{M}_\odot$
BH at the centre of RGG 118, which has a stellar mass of $M_\star \sim 2.5 \times 10^9 \text{M}_\odot$
and was originally classified as a narrow-line composite object (Reines et al. Reference Reines, Greene and Geha2013, ID 118). New Magellan spectroscopy of RGG 118, with higher sensitivity and spectral resolution than the original SDSS spectrum, displays clear broad Hα emission, which is used to estimate the BH mass. The source is also detected in X-rays with Chandra, providing additional support for a massive BH. The X-ray observations imply an accretion powered luminosity of ~ 4 × 1040 erg s−1 and the corresponding Eddington ratio is ~ 1%, which is typical of Seyfert nuclei in more massive galaxies. Baldassare et al. (Reference Baldassare, Reines, Gallo and Greene2015) measure a velocity dispersion of just ~ 27 km s−1 and find that this object falls on the extrapolation of the M
BH − σ⋆ relation to the lowest masses yet (Figure 13, also see Barth, Greene, & Ho Reference Barth, Greene and Ho2005 and Xiao et al. Reference Xiao2011).
$M_\star \sim 2.5 \times 10^9 \text{M}_\odot$
and was originally classified as a narrow-line composite object (Reines et al. Reference Reines, Greene and Geha2013, ID 118). New Magellan spectroscopy of RGG 118, with higher sensitivity and spectral resolution than the original SDSS spectrum, displays clear broad Hα emission, which is used to estimate the BH mass. The source is also detected in X-rays with Chandra, providing additional support for a massive BH. The X-ray observations imply an accretion powered luminosity of ~ 4 × 1040 erg s−1 and the corresponding Eddington ratio is ~ 1%, which is typical of Seyfert nuclei in more massive galaxies. Baldassare et al. (Reference Baldassare, Reines, Gallo and Greene2015) measure a velocity dispersion of just ~ 27 km s−1 and find that this object falls on the extrapolation of the M
BH − σ⋆ relation to the lowest masses yet (Figure 13, also see Barth, Greene, & Ho Reference Barth, Greene and Ho2005 and Xiao et al. Reference Xiao2011).

Figure 13. The dwarf galaxy RGG 118, which contains a ${\sim}50\,000\;\text{M}_\odot$
nuclear BH (Baldassare et al. Reference Baldassare, Reines, Gallo and Greene2015). Left: The optical image is from SDSS data and the inset shows the X-ray detection with Chandra. Image credit – X-ray: NASA/CXC/Univ of Michigan/V.F.Baldassare, et al; Optical: SDSS. Right: RGG 118 on the M
BH − σ⋆ relation. From Baldassare et al. (Reference Baldassare, Reines, Gallo and Greene2015). © AAS. Reproduced with permission.
${\sim}50\,000\;\text{M}_\odot$
nuclear BH (Baldassare et al. Reference Baldassare, Reines, Gallo and Greene2015). Left: The optical image is from SDSS data and the inset shows the X-ray detection with Chandra. Image credit – X-ray: NASA/CXC/Univ of Michigan/V.F.Baldassare, et al; Optical: SDSS. Right: RGG 118 on the M
BH − σ⋆ relation. From Baldassare et al. (Reference Baldassare, Reines, Gallo and Greene2015). © AAS. Reproduced with permission.
Moran et al. (Reference Moran, Shahinyan, Sugarman, Vélez and Eracleous2014) present a sample of 28 AGNs in low-mass galaxies also discovered by analysing SDSS spectra and looking for AGN-like line ratios. They apply different selection criteria than Reines et al. (Reference Reines, Greene and Geha2013), including galaxies with stellar masses $M_\star \lesssim 10^{10}\;\text{M}_\odot$
, distances d ⩽ 80 Mpc and, for the most part, they do not include composite objects. An object-by-object comparison of the Moran et al. (Reference Moran, Shahinyan, Sugarman, Vélez and Eracleous2014) sample to the Reines et al. (Reference Reines, Greene and Geha2013) sample indicates that 10 objects were previously identified by Reines et al. (Reference Reines, Greene and Geha2013) and the remaining 18 were not in the parent sample of Reines et al. (Reference Reines, Greene and Geha2013), and therefore not examined in that work. The majority of these 18 objects (15/18)Footnote
4
were cut because their stellar masses are above the limit of
$M_\star \lesssim 10^{10}\;\text{M}_\odot$
, distances d ⩽ 80 Mpc and, for the most part, they do not include composite objects. An object-by-object comparison of the Moran et al. (Reference Moran, Shahinyan, Sugarman, Vélez and Eracleous2014) sample to the Reines et al. (Reference Reines, Greene and Geha2013) sample indicates that 10 objects were previously identified by Reines et al. (Reference Reines, Greene and Geha2013) and the remaining 18 were not in the parent sample of Reines et al. (Reference Reines, Greene and Geha2013), and therefore not examined in that work. The majority of these 18 objects (15/18)Footnote
4
were cut because their stellar masses are above the limit of $3 \times 10^9\;\text{M}_\odot$
applied in Reines et al. (Reference Reines, Greene and Geha2013). Whilst there are systematic differences in the stellar mass estimates used by the two studies, overall, the overlap between the samples is amongst the lower mass objects in Moran et al. (Reference Moran, Shahinyan, Sugarman, Vélez and Eracleous2014).
$3 \times 10^9\;\text{M}_\odot$
applied in Reines et al. (Reference Reines, Greene and Geha2013). Whilst there are systematic differences in the stellar mass estimates used by the two studies, overall, the overlap between the samples is amongst the lower mass objects in Moran et al. (Reference Moran, Shahinyan, Sugarman, Vélez and Eracleous2014).
Sartori et al. (Reference Sartori2015) also searched for AGNs in dwarf galaxies using emission line measurements of SDSS galaxies provided by the OSSY catalogue (Oh et al. Reference Oh, Sarzi, Schawinski and Yi2011), applying stellar mass and redshift cuts of $M_\star \lesssim 3 \times 10^{9}\;\text{M}_\odot$
and z < 0.1. They find 48 galaxies with Seyfert-like line ratios using the BPT diagram. They also find 121 candidate AGNs using the He II λ4686/Hβ versus [N II]λ6584/Hα diagnostic diagram from Shirazi & Brinchmann (Reference Shirazi and Brinchmann2012). All of the BPT-selected AGNs with detectable He II emission are also selected as AGNs using the Shirazi & Brinchmann (Reference Shirazi and Brinchmann2012) criterion, but the vast majority of the He II-selected AGN candidates look like star-forming galaxies in the BPT diagram. Further investigation would be helpful to determine if the strong He II emitters are indeed AGNs.
$M_\star \lesssim 3 \times 10^{9}\;\text{M}_\odot$
and z < 0.1. They find 48 galaxies with Seyfert-like line ratios using the BPT diagram. They also find 121 candidate AGNs using the He II λ4686/Hβ versus [N II]λ6584/Hα diagnostic diagram from Shirazi & Brinchmann (Reference Shirazi and Brinchmann2012). All of the BPT-selected AGNs with detectable He II emission are also selected as AGNs using the Shirazi & Brinchmann (Reference Shirazi and Brinchmann2012) criterion, but the vast majority of the He II-selected AGN candidates look like star-forming galaxies in the BPT diagram. Further investigation would be helpful to determine if the strong He II emitters are indeed AGNs.
Low-mass galaxies exhibiting broad Hα emission, yet classified as star-forming galaxies based on narrow line ratios (e.g., the BPT diagram), have also been flagged as possible AGNs in a number of studies (Greene & Ho Reference Greene and Ho2007; Izotov, Thuan, & Guseva Reference Izotov, Thuan and Guseva2007; Izotov & Thuan Reference Izotov and Thuan2008; Reines et al. Reference Reines, Greene and Geha2013; Koss et al. Reference Koss2014). Whilst some of these objects may indeed be bonafide AGNs, stellar processes (e.g., luminous Type II SNe, LBVs) can also account for the observed broad Hα emission in many cases. For example, follow-up spectroscopic observations of 14 broad-line objects falling in the star-forming part of the BPT diagram from Reines et al. (Reference Reines, Greene and Geha2013) demonstrate that the broad Hα emission either completely disappeared or was ambiguous over a time span of several years, indicating the presence of a SNe or some other transient in the original SDSS spectrum (Baldassare et al. Reference Baldassare2016a). This is in stark contrast to the broad-line objects falling in the AGN and composite region of the BPT diagram (see Figure 14). For those with follow-up spectroscopy, Baldassare et al. (Reference Baldassare2016a) find that the broad lines persist as expected for an AGN origin. Therefore, objects exhibiting broad Balmer lines without narrow line signatures of an active BH should be treated with caution. Fast optical variability ( < 1 day) in a galaxy nucleus, on the other hand, could signal an accreting low-mass BH (e.g., Morokuma et al. Reference Morokuma2016) and help overcome the selection bias against AGNs in star-forming galaxies.

Figure 14. Multi-epoch spectroscopy of dwarf galaxies with broad Hα emission (Baldassare et al. Reference Baldassare2016a). The top panels show two spectra of RGG 9 (a BPT AGN from Reines et al. Reference Reines, Greene and Geha2013) taken more than a decade apart. The broad line is persistent, confirming an AGN origin. The bottom panels show spectra of RGG C, which has narrow emission line ratios dominated by recent star formation. The broad Hα emission has disappeared between the two epochs, indicating an SNe or other transient was responsible for the broad line originally detected in the SDSS spectrum. Adapted from Baldassare et al. (Reference Baldassare2016a). © AAS. Reproduced with permission.
3.3. X-ray observations
AGN samples selected using optical emission lines, such as those described above, tend to be biased towards BHs radiating at moderate to high fractions of their Eddington luminosities. In contrast, X-ray observations are capable of probing BH accretion down to very low levels. For example, the AMUSEFootnote 5 surveys targeted 203 early-type galaxies within ~ 30 Mpc with Chandra and reached a sensitivity limit of log L X ≃ 38.3 erg s−1 (Miller et al. Reference Miller2015, also see Gallo et al. Reference Gallo2010 and Miller et al. Reference Miller, Gallo, Treu and Woo2012). At such low luminosities, contamination from X-ray binaries (XRBs) becomes a concern. To minimise contamination from high-mass XRBs, the AMUSE surveys focus on early-type galaxies with low star-formation rates. Chance contamination from low-mass XRBs in the presence of a nuclear star cluster is estimated using the enclosed mass in conjunction with the shape and normalisation of the low-mass XRB luminosity function (e.g., Gallo et al. Reference Gallo2010). For nuclear X-ray sources very likely powered by accretion onto a massive BH in the AMUSE galaxies, the X-ray luminosities are highly sub-Eddington, typically with L X/L Edd < 10−5.
Stellar masses of the host galaxies in the AMUSE surveys are in the range $7.7 \lesssim {\rm log}(M_\star /\text{M}_\odot ) \lesssim 12$
and, whilst the vast majority of nuclear X-ray detections are in massive galaxies with
$7.7 \lesssim {\rm log}(M_\star /\text{M}_\odot ) \lesssim 12$
and, whilst the vast majority of nuclear X-ray detections are in massive galaxies with $M_\star \ge 10^{10} \text{M}_\odot$
, seven galaxies with
$M_\star \ge 10^{10} \text{M}_\odot$
, seven galaxies with $M_\star < 10^{10} \text{M}_\odot$
have detectable nuclear X-ray sources that are very likely coming from accreting massive BHsFootnote
6
(Miller et al. Reference Miller2015, also see Gallo et al. Reference Gallo2008). Accounting for the scaling of nuclear X-ray luminosity with stellar mass, Miller et al. (Reference Miller2015) constrain the occupation fraction of massive BHs in early-type galaxies with
$M_\star < 10^{10} \text{M}_\odot$
have detectable nuclear X-ray sources that are very likely coming from accreting massive BHsFootnote
6
(Miller et al. Reference Miller2015, also see Gallo et al. Reference Gallo2008). Accounting for the scaling of nuclear X-ray luminosity with stellar mass, Miller et al. (Reference Miller2015) constrain the occupation fraction of massive BHs in early-type galaxies with $M_\star < 10^{10} \text{M}_\odot$
to be > 20%.
$M_\star < 10^{10} \text{M}_\odot$
to be > 20%.
In addition to low-mass early-type galaxies, X-ray observations have revealed small samples of massive BH candidates in late-type spiral galaxies (Ghosh et al. Reference Ghosh, Mathur, Fiore and Ferrarese2008; Desroches & Ho Reference Desroches and Ho2009), Lyman Break Analogs (Jia et al. Reference Jia2011), dwarf irregulars (Lemons et al. Reference Lemons, Reines, Plotkin, Gallo and Greene2015; Secrest et al. Reference Secrest2015), and blue compact dwarf galaxies (Reines et al. Reference Reines, Sivakoff, Johnson and Brogan2011, Reference Reines2014, also see Section 3.4 below). A hard X-ray selected sample of AGNs in galaxies with $M_\star \lesssim 10^{10} \text{M}_\odot$
has recently been assembled by Chen et al. (in preparation), based on serendipitous detections by NuSTAR. An X-ray variability study by Kamizasa, Terashima, & Awaki (Reference Kamizasa, Terashima and Awaki2012) led to the discovery of 15 candidate AGNs with
$M_\star \lesssim 10^{10} \text{M}_\odot$
has recently been assembled by Chen et al. (in preparation), based on serendipitous detections by NuSTAR. An X-ray variability study by Kamizasa, Terashima, & Awaki (Reference Kamizasa, Terashima and Awaki2012) led to the discovery of 15 candidate AGNs with $M_{\rm BH} \sim (1.1-6.6) \times 10^6 \text{M}_\odot$
, a BH mass regime similar to (or slightly larger than) the optically selected broad-line AGNs in the Greene & Ho (Reference Greene and Ho2007) sample. Optical spectroscopic observations by Ho & Kim (Reference Ho and Kim2016) detect broad Hα emission in 12 of these objects (all of those observed), confirming the sample consists of relatively low-mass BHs accreting at high Eddington ratios.
$M_{\rm BH} \sim (1.1-6.6) \times 10^6 \text{M}_\odot$
, a BH mass regime similar to (or slightly larger than) the optically selected broad-line AGNs in the Greene & Ho (Reference Greene and Ho2007) sample. Optical spectroscopic observations by Ho & Kim (Reference Ho and Kim2016) detect broad Hα emission in 12 of these objects (all of those observed), confirming the sample consists of relatively low-mass BHs accreting at high Eddington ratios.
Lemons et al. (Reference Lemons, Reines, Plotkin, Gallo and Greene2015) leveraged the Chandra data archive in a systematic search for candidate BHs in dwarf galaxies with stellar masses $M_\star \lesssim 3 \times 10^9 \text{M}_\odot$
and redshifts z < 0.055. They present a sample of 19 dwarf galaxies spanning a wide range in colour, specific star-formation rate and morphology, consisting of a total of 43 hard X-ray point-like sources with luminosities in the range L
2-10keV ~ 1037–1040 erg s−1. The majority of these sources are likely luminous stellar mass XRBs. However, some sources may be powered by more massive BHs radiating at low Eddington ratios, such as the well-studied dwarf Seyfert galaxy NGC 4395 (e.g., Filippenko & Sargent Reference Filippenko and Sargent1989; Filippenko & Ho Reference Filippenko and Ho2003) which falls in the Lemons et al. (Reference Lemons, Reines, Plotkin, Gallo and Greene2015) sample. Follow-up observations, particularly at radio wavelengths (e.g., see Section 3.4 below), would help differentiate between stellar-mass and massive BHs in these dwarf galaxies.
$M_\star \lesssim 3 \times 10^9 \text{M}_\odot$
and redshifts z < 0.055. They present a sample of 19 dwarf galaxies spanning a wide range in colour, specific star-formation rate and morphology, consisting of a total of 43 hard X-ray point-like sources with luminosities in the range L
2-10keV ~ 1037–1040 erg s−1. The majority of these sources are likely luminous stellar mass XRBs. However, some sources may be powered by more massive BHs radiating at low Eddington ratios, such as the well-studied dwarf Seyfert galaxy NGC 4395 (e.g., Filippenko & Sargent Reference Filippenko and Sargent1989; Filippenko & Ho Reference Filippenko and Ho2003) which falls in the Lemons et al. (Reference Lemons, Reines, Plotkin, Gallo and Greene2015) sample. Follow-up observations, particularly at radio wavelengths (e.g., see Section 3.4 below), would help differentiate between stellar-mass and massive BHs in these dwarf galaxies.
There is a growing body of evidence for massive BHs in low-mass galaxies at moderate redshifts from deep X-ray surveys. Using the 4 Ms CDF-S survey and a stacking analysis, Xue et al. (Reference Xue2012) find that obscured AGNs in galaxies with stellar masses of $2 \times 10^8 \lesssim M_\star /\text{M}_\odot \lesssim 2 \times 10^9$
, blue colours, and redshifts of 1 ≲ z ≲ 3 are responsible for the majority of the unresolved 6–8 keV cosmic X-ray background. Schramm et al. (Reference Schramm2013) present a detailed study of three galaxies with
$2 \times 10^8 \lesssim M_\star /\text{M}_\odot \lesssim 2 \times 10^9$
, blue colours, and redshifts of 1 ≲ z ≲ 3 are responsible for the majority of the unresolved 6–8 keV cosmic X-ray background. Schramm et al. (Reference Schramm2013) present a detailed study of three galaxies with $M_\star \lesssim 3 \times 10^9 \text{M}_\odot$
at z < 0.3 hosting candidate AGNs that are individually detected in the CDF-S. Using the Chandra COSMOS-Legacy survey data, Mezcua et al. (Reference Mezcua, Civano, Fabbiano, Miyaji and Marchesi2016) perform a stacking analysis of non-detected low-mass galaxies (
$M_\star \lesssim 3 \times 10^9 \text{M}_\odot$
at z < 0.3 hosting candidate AGNs that are individually detected in the CDF-S. Using the Chandra COSMOS-Legacy survey data, Mezcua et al. (Reference Mezcua, Civano, Fabbiano, Miyaji and Marchesi2016) perform a stacking analysis of non-detected low-mass galaxies ( $M_\star \lesssim 3 \times 10^9 \text{M}_\odot$
) in five redshift bins from z = 0 to z = 1.5. After accounting for X-ray emission from XRBs and hot ISM gas, Mezcua et al. (Reference Mezcua, Civano, Fabbiano, Miyaji and Marchesi2016) find an excess in the stacked X-ray emission that can be attributed to accreting massive BHs. Using deep archival Chandra observations overlapping with the NEWFIRM Medium-Band Survey, Pardo et al. (Reference Pardo2016) identify 10 dwarf galaxies at redshifts 0.1 ≲ z ≲ 0.6 (from DEEP2 spectroscopy) exhibiting X-ray emission consistent with AGN activity (see Figure 15).
$M_\star \lesssim 3 \times 10^9 \text{M}_\odot$
) in five redshift bins from z = 0 to z = 1.5. After accounting for X-ray emission from XRBs and hot ISM gas, Mezcua et al. (Reference Mezcua, Civano, Fabbiano, Miyaji and Marchesi2016) find an excess in the stacked X-ray emission that can be attributed to accreting massive BHs. Using deep archival Chandra observations overlapping with the NEWFIRM Medium-Band Survey, Pardo et al. (Reference Pardo2016) identify 10 dwarf galaxies at redshifts 0.1 ≲ z ≲ 0.6 (from DEEP2 spectroscopy) exhibiting X-ray emission consistent with AGN activity (see Figure 15).

Figure 15. X-ray luminosity versus star formation rate for the dwarf galaxies identified by Pardo et al. (Reference Pardo2016). The X-ray luminosities are well above the expected contribution from high-mass X-ray binaries and are consistent with an AGN origin. From Pardo et al. (Reference Pardo2016). © AAS. Reproduced with permission.
At higher redshifts, z ≳ 5–6, few if any AGNs have been detected in galaxies with stellar masses $M_\star \sim 10^9 \text{M}_\odot$
, either through direct X-ray detections (Fiore et al. Reference Fiore2012a; Giallongo et al. Reference Giallongo2015; Weigel et al. Reference Weigel2015; Cappelluti et al. Reference Cappelluti2016) or stacking of Lyman Break Galaxies (LBGs) (Willott Reference Willott2011; Cowie et al. Reference Cowie, Barger and Hasinger2012; Treister et al. Reference Treister, Schawinski, Volonteri and Natarajan2013; Vito et al. Reference Vito2016). Extrapolating local BH mass to bulge mass relations defined by early-type galaxies (e.g., Marconi & Hunt Reference Marconi and Hunt2003; Häring & Rix Reference Häring and Rix2004; Kormendy & Ho Reference Kormendy and Ho2013) would suggest a higher detection rate. However, Volonteri & Reines (Reference Volonteri and Reines2016) demonstrate that the non-detections can be accounted for by instead extrapolating the local BH to total stellar mass relation of Reines & Volonteri (Reference Reines and Volonteri2015), which has a significantly lower normalisation and is defined by moderate-luminosity AGNs predominantly in lower mass later-type galaxies.
$M_\star \sim 10^9 \text{M}_\odot$
, either through direct X-ray detections (Fiore et al. Reference Fiore2012a; Giallongo et al. Reference Giallongo2015; Weigel et al. Reference Weigel2015; Cappelluti et al. Reference Cappelluti2016) or stacking of Lyman Break Galaxies (LBGs) (Willott Reference Willott2011; Cowie et al. Reference Cowie, Barger and Hasinger2012; Treister et al. Reference Treister, Schawinski, Volonteri and Natarajan2013; Vito et al. Reference Vito2016). Extrapolating local BH mass to bulge mass relations defined by early-type galaxies (e.g., Marconi & Hunt Reference Marconi and Hunt2003; Häring & Rix Reference Häring and Rix2004; Kormendy & Ho Reference Kormendy and Ho2013) would suggest a higher detection rate. However, Volonteri & Reines (Reference Volonteri and Reines2016) demonstrate that the non-detections can be accounted for by instead extrapolating the local BH to total stellar mass relation of Reines & Volonteri (Reference Reines and Volonteri2015), which has a significantly lower normalisation and is defined by moderate-luminosity AGNs predominantly in lower mass later-type galaxies.
3.4. Combined radio + X-ray searches
The combination of sensitive, high-resolution radio, and X-ray observations offer a promising path forward in the search for massive BHs in dwarf galaxies. These observations can detect weakly accreting BHs, as well as those living in dwarf galaxies with ongoing star formation that can hide BH accretion signatures at optical wavelengths. Moreover, radio observations can help break the degeneracy at X-ray luminosities that are consistent with either luminous stellar-mass XRBs or more massive BHs radiating at low Eddington ratios (e.g., Merloni, Heinz, & di Matteo Reference Merloni, Heinz and Matteo2003; Falcke, Körding, & Markoff Reference Falcke, Körding and Markoff2004; Plotkin et al. Reference Plotkin, Markoff, Kelly, Körding and Anderson2012). For a given X-ray luminosity, massive BHs are significantly more luminous in the radio than stellar-mass BHs. Unfortunately, existing radio and X-ray surveys are either too shallow and/or lack sufficient angular resolution to reliably identify AGNs in dwarf galaxies. There are other potential sources of compact radio and X-ray emission, particularly in star-forming dwarf galaxies (e.g., H II regions, supernovae, supernova remnants, XRBs, hot X-ray gas from star formation), and therefore a careful multiwavelength approach must be employed that is currently only possible with dedicated observations.
Reines et al. (Reference Reines, Sivakoff, Johnson and Brogan2011) present evidence for a massive BH in the dwarf starburst galaxy Henize 2–10. Optical spectroscopy of Henize 2–10 is dominated by star formation, yet VLA and Chandra observations reveal a compact source of radio and X-ray emissionFootnote
7
strongly suggesting a massive BH at the centre of the galaxy (see Reines et al. Reference Volonteri and Reines2016 for new, deep Chandra observations of Henize 2–10). Furthermore, follow-up Very Long Baseline Interferometry observations by Reines & Deller (Reference Reines and Deller2012) detect a parsec-scale, non-thermal radio core at the precise position of the central source, providing additional support for a massive BH. A comparison with HST narrow-band Hα and Paα imaging demonstrates that the BH lies at the centre of a ~ 250 pc-long ionised gas structure with a morphology suggestive of bipolar flow (Figure 16; also see Figure 2 in Reines et al. Reference Reines, Sivakoff, Johnson and Brogan2011). No star cluster is detected at the location of the BH in Henize 2–10 (Reines et al. Reference Reines, Sivakoff, Johnson and Brogan2011); however, several young massive ( ${\sim}10^5-10^6 \text{M}_\odot$
) star clusters reside within the central region of the galaxy (e.g., Johnson et al. Reference Johnson, Leitherer, Vacca and Conti2000; Chandar et al. Reference Chandar, Leitherer, Tremonti and Calzetti2003; Nguyen et al. Reference Nguyen2014). The dynamical friction timescales for the most massive clusters to reach the centre of the galaxy are only a few hundred Myr, suggesting a nuclear star cluster will form around the pre-existing BH in a relatively short time (Nguyen et al. Reference Nguyen2014). N-body simulations modelling the future evolution of the central clusters and the BH in Henize 2–10 come to the same conclusion (Arca-Sedda et al. Reference Arca-Sedda, Capuzzo-Dolcetta, Antonini and Seth2015). Estimates for the total stellar mass of Henize 2–10 are in the range
${\sim}10^5-10^6 \text{M}_\odot$
) star clusters reside within the central region of the galaxy (e.g., Johnson et al. Reference Johnson, Leitherer, Vacca and Conti2000; Chandar et al. Reference Chandar, Leitherer, Tremonti and Calzetti2003; Nguyen et al. Reference Nguyen2014). The dynamical friction timescales for the most massive clusters to reach the centre of the galaxy are only a few hundred Myr, suggesting a nuclear star cluster will form around the pre-existing BH in a relatively short time (Nguyen et al. Reference Nguyen2014). N-body simulations modelling the future evolution of the central clusters and the BH in Henize 2–10 come to the same conclusion (Arca-Sedda et al. Reference Arca-Sedda, Capuzzo-Dolcetta, Antonini and Seth2015). Estimates for the total stellar mass of Henize 2–10 are in the range $M_\star \sim 10^9-10^{10} \text{M}_\odot$
(Reines et al. Reference Reines, Sivakoff, Johnson and Brogan2011; Kormendy & Ho Reference Kormendy and Ho2013; Nguyen et al. Reference Nguyen2014), a mass regime in which the coexistence of nuclear star clusters and massive BHs is very common (Seth et al. Reference Seth, Agüeros, Lee and Basu-Zych2008).
$M_\star \sim 10^9-10^{10} \text{M}_\odot$
(Reines et al. Reference Reines, Sivakoff, Johnson and Brogan2011; Kormendy & Ho Reference Kormendy and Ho2013; Nguyen et al. Reference Nguyen2014), a mass regime in which the coexistence of nuclear star clusters and massive BHs is very common (Seth et al. Reference Seth, Agüeros, Lee and Basu-Zych2008).

Figure 16. Left: HST optical image of Henize 2–10, a dwarf starburst galaxy with a massive BH (Reines et al. Reference Reines, Sivakoff, Johnson and Brogan2011). Right: HST narrow-band Paα image of the central few hundred parsecs of the galaxy showing ionised gas emission. Black contours indicate radio emission detected with the VLA and green contours show the VLBI detection from Reines & Deller (Reference Reines and Deller2012). Reines et al. (Reference Volonteri and Reines2016) present a study of the X-ray emission from the massive BH using deep Chandra observations. © AAS. Reproduced with permission.
A continued search for massive BHs in dwarf star-forming galaxies using the combination of high-resolution radio and X-ray observations has led to the discovery of a candidate AGN in Mrk 709 (Reines et al. Reference Reines2014). Mrk 709 is a low-metallicity (Masegosa, Moles, & Campos-Aguilar Reference Masegosa, Moles and Campos-Aguilar1994) blue compact dwarf (Gil de Paz, Madore, & Pevunova Reference Gil de Paz, Madore and Pevunova2003) that appears to be a pair of interacting galaxies with stellar masses of $M_\star \sim 1.1 \times 10^9 \text{M}_\odot$
(Mrk 709 N) and
$M_\star \sim 1.1 \times 10^9 \text{M}_\odot$
(Mrk 709 N) and $M_\star \sim 2.5 \times 10^9 \text{M}_\odot$
(Mrk 709 S) (Reines et al. Reference Reines2014). VLA and Chandra observations reveal spatially coincident (within the astrometric uncertainties) radio and hard X-ray point sources at the centre of the southern galaxy, Mrk 709 S, with luminosities suggesting the presence of an accreting massive BH. With a metallicity of only ~ 10% of the solar value, Mrk 709 is amongst the most metal-poor galaxies with evidence for a massive BH. Given the low metallicity, copious star formation, as well as the interaction, Mrk 709 may be a good local analogue of higher redshift systems of similar mass.
$M_\star \sim 2.5 \times 10^9 \text{M}_\odot$
(Mrk 709 S) (Reines et al. Reference Reines2014). VLA and Chandra observations reveal spatially coincident (within the astrometric uncertainties) radio and hard X-ray point sources at the centre of the southern galaxy, Mrk 709 S, with luminosities suggesting the presence of an accreting massive BH. With a metallicity of only ~ 10% of the solar value, Mrk 709 is amongst the most metal-poor galaxies with evidence for a massive BH. Given the low metallicity, copious star formation, as well as the interaction, Mrk 709 may be a good local analogue of higher redshift systems of similar mass.
3.5. Mid-infrared searches
Observations at mid-infrared wavelengths, for example with Spitzer and the Wide-field Infrared Survey Explorer (WISE), have proved useful for finding obscured and unobscured luminous AGNs out to high redshifts. In recent years, a number of studies have extrapolated WISE AGN diagnostics (Jarrett et al. Reference Jarrett2011; Stern et al. Reference Stern2012) to low-bulge and low-mass galaxies (Satyapal et al. Reference Satyapal2014; Marleau et al. Reference Marleau, Clancy, Bianconi and Habas2014; Sartori et al. Reference Sartori2015; Hainline et al. Reference Hainline, Reines, Greene and Stern2016).
The mid-infrared selection technique relies on distinguishing the broadband colours of dust heated to high temperatures by AGNs (roughly a power law spectrum) from other sources of mid-infrared emission. The mid-infrared colours of luminous AGNs are clearly distinct from stars and normal galaxies that have blackbody spectra at long wavelengths. However, mid-infrared colour cuts for AGNs can overlap with the colours of star-forming galaxies, which can also exhibit red WISE colours from hot dust emission. This is particularly consequential for dwarf star-forming galaxies that can have integrated mid-infrared photometry completely dominated by a young starburst (e.g., Griffith et al. Reference Griffith2011; Izotov et al. Reference Izotov, Guseva, Fricke and Henkel2011, Reference Izotov, Guseva, Fricke and Henkel2014). Indeed, Hainline et al. (Reference Hainline, Reines, Greene and Stern2016) clearly demonstrate that star-forming dwarf galaxies, particularly those with very young stellar populations (t ≲ 5 Myr) and high specific SFRs, can have mid-infrared colours overlapping those of WISE-selected AGNs (Figure 17).

Figure 17.
WISE mid-infrared colour–colour diagram for optically selected star-forming dwarf galaxies ( $M_\star \le 3 \times 10^9 \text{M}_\odot$
) within z ⩽ 0.055. Left: Points are colour-coded by the equivalent width of the Hα emission line, which is anticorrelated with stellar age (Leitherer et al. Reference Leitherer1999). Right: Points are colour-coded by Hα luminosity, which is correlated with ionising flux and star-formation rate (e.g., Condon Reference Condon1992; Kennicutt & Evans Reference Kennicutt and Evans2012). The dwarf galaxies with the reddest WISE colours are optically blue and compact, with young stellar populations and high specific star-formation rates (Hainline et al. Reference Hainline, Reines, Greene and Stern2016). The star-forming sequence wraps around and largely avoids the Jarrett et al. (Reference Jarrett2011) AGN selection box shown in blue. However, the star-forming dwarf galaxies with the reddest WISE colours satisfy the canonical (luminous) AGN selection criterion of W1 − W2 ⩾ 0.8 from Stern et al. (Reference Stern2012, orange line). Therefore, caution should be exercised when attempting to select AGNs in dwarf galaxies using infrared colours, as star-forming dwarfs can heat dust in such a way that mimics luminous AGNs. From Hainline et al. (Reference Hainline, Reines, Greene and Stern2016). © AAS. Reproduced with permission.
$M_\star \le 3 \times 10^9 \text{M}_\odot$
) within z ⩽ 0.055. Left: Points are colour-coded by the equivalent width of the Hα emission line, which is anticorrelated with stellar age (Leitherer et al. Reference Leitherer1999). Right: Points are colour-coded by Hα luminosity, which is correlated with ionising flux and star-formation rate (e.g., Condon Reference Condon1992; Kennicutt & Evans Reference Kennicutt and Evans2012). The dwarf galaxies with the reddest WISE colours are optically blue and compact, with young stellar populations and high specific star-formation rates (Hainline et al. Reference Hainline, Reines, Greene and Stern2016). The star-forming sequence wraps around and largely avoids the Jarrett et al. (Reference Jarrett2011) AGN selection box shown in blue. However, the star-forming dwarf galaxies with the reddest WISE colours satisfy the canonical (luminous) AGN selection criterion of W1 − W2 ⩾ 0.8 from Stern et al. (Reference Stern2012, orange line). Therefore, caution should be exercised when attempting to select AGNs in dwarf galaxies using infrared colours, as star-forming dwarfs can heat dust in such a way that mimics luminous AGNs. From Hainline et al. (Reference Hainline, Reines, Greene and Stern2016). © AAS. Reproduced with permission.
Given the confusion between dwarf starburst galaxies and luminous AGNs in mid-infrared colour space, red WISE colours alone should not necessarily be taken as evidence for AGNs in low-mass galaxies. Contamination from star-forming galaxies may also help explain one particularly puzzling result first found by Satyapal et al. (Reference Satyapal2014), and also seen to some extent by Marleau et al. (Reference Marleau, Clancy, Bianconi and Habas2014) and Sartori et al. (Reference Sartori2015). All of these studies claim the mid-infrared AGN fraction actually increases at very low-galaxy masses ( $M_\star \sim 10^6\hbox{--}10^8 \text{M}_\odot$
) relative to higher mass galaxies, in contrast to what is found in optical studies. This is surprising given that the BH occupation fraction is generally expected to drop with decreasing stellar mass. Furthermore, at the time of writing, no galaxy with a stellar mass
$M_\star \sim 10^6\hbox{--}10^8 \text{M}_\odot$
) relative to higher mass galaxies, in contrast to what is found in optical studies. This is surprising given that the BH occupation fraction is generally expected to drop with decreasing stellar mass. Furthermore, at the time of writing, no galaxy with a stellar mass $M_\star \lesssim 10^8 \text{M}_\odot$
has evidence for a massive BH at either optical or X-ray wavelengths.
$M_\star \lesssim 10^8 \text{M}_\odot$
has evidence for a massive BH at either optical or X-ray wavelengths.
3.6. Future outlook
In recent years, we have made significant progress finding and characterising AGNs in dwarf galaxies. To maximise the utility of these types of systems in constraining seed-formation mechanisms, we now need a more complete census of massive BHs in z ~ 0 low-mass galaxies and to accurately measure BH masses and host galaxy properties (see Figure 1 and Section 1).
In the near term, it would be useful to obtain larger samples of broad-line AGNs in dwarf galaxies with very low-BH masses and continue to populate the low-mass end of the M BH − σ⋆ relation (e.g., Baldassare et al. Reference Baldassare, Reines, Gallo and Greene2015, Reference Baldassare2016a; Bentz et al. Reference Bentz2016), a key discriminant between BH seed-formation mechanisms. We can also use observations with the VLA to search for compact sources of radio emission at the centres of dwarf galaxies that could indicate low-level nuclear activity (e.g., Reines et al. Reference Reines, Sivakoff, Johnson and Brogan2011). The exquisite sensitivity provided by the upgrade to the VLA now makes large surveys of such objects feasible. X-ray observations with Chandra could provide the necessary follow-up data to confirm BH candidates. Such an approach has the potential to more tightly constrain the BH occupation fraction at low mass (another primary diagnostic of seed formation) than is currently possible with optically selected spectroscopic AGN samples that are biased towards higher Eddington ratios and host galaxies with relatively low levels of star formation (e.g., Reines et al. Reference Reines, Greene and Geha2013). Optical variability studies using large imaging surveys could also push to low-accretion rates and help overcome the bias against finding active massive BHs in star-forming dwarf galaxies.
With LSST on the horizon, tidal disruptions of stars may prove useful for detecting otherwise quiescent BHs in dwarf galaxies (e.g., MacLeod et al. Reference MacLeod, Guillochon, Ramirez-Ruiz, Kasen and Rosswog2016; also see Miller & Gültekin Reference Miller and Gültekin2011, Yoon et al. Reference Yoon2015, Maksym, Lin, & Irwin Reference Maksym, Lin and Irwin2014a, Maksym et al. Reference Maksym2014b, and Donato et al. Reference Donato2014 for current candidates in the low-mass regime). Further down the road, the next generation of large ( ~ 30–40 m) ground-based telescopes will revolutionise our understanding of BH demographics in local dwarf galaxies. Dynamical searches, for example with the Thirty-Meter Telescope (TMT), the Giant Magellan Telescope (GMT), and the E-ELT, could provide robust masses (or upper limits) on quiescent BHs in dwarf galaxies that are currently out of reach (e.g., see Figure 18), and thereby reliably determine the BH occupation fraction (rather than the active fraction) at low masses.

Figure 18. The spatial resolution of 30-m class telescopes will dramatically increase the accessible volume for dynamical BH searches, enabling the detection of low-mass BHs ( $M_{\rm BH} \sim 10^5 \text{M}_\odot$
) in dwarf galaxies well beyond the Local Group. Adapted from Do et al. (Reference Do2014). © AAS. Reproduced with permission.
$M_{\rm BH} \sim 10^5 \text{M}_\odot$
) in dwarf galaxies well beyond the Local Group. Adapted from Do et al. (Reference Do2014). © AAS. Reproduced with permission.
4 CONCLUSIONS
Efforts to observationally constrain the birth and growth of massive BHs have advanced considerably in recent years. There are ever growing samples of high-redshift quasars with giant BHs, and smaller and smaller BHs are being discovered in nearby dwarf galaxies. What are these observations telling us about the formation of the first BH seeds?
There are hints from the quasar population that massive seeds ( $M_{\rm seed} \sim 10^5 \text{M}_\odot$
) may be preferred over lighter stellar-mass seeds (
$M_{\rm seed} \sim 10^5 \text{M}_\odot$
) may be preferred over lighter stellar-mass seeds ( $M_{\rm seed} \sim 10^2 \text{M}_\odot$
). For example, Natarajan & Volonteri (Reference Natarajan and Volonteri2012) compare the BH mass function of luminous broad-line quasars in the SDSS from 1 < z < 4.5 (Kelly et al. Reference Kelly2010) with merger-driven BH growth models. They find that models with low-mass seeds underproduce the massive end of the BH mass function from intermediate to high redshifts, even when the BHs are accreting at the Eddington rate at all times. Natarajan & Volonteri (Reference Natarajan and Volonteri2012) conclude that stellar-mass seeds would have had to undergone extreme growth conditions (e.g., super-Eddington accretion; also see Madau et al. Reference Madau, Haardt and Dotti2014) or BH seeds were significantly more massive.
$M_{\rm seed} \sim 10^2 \text{M}_\odot$
). For example, Natarajan & Volonteri (Reference Natarajan and Volonteri2012) compare the BH mass function of luminous broad-line quasars in the SDSS from 1 < z < 4.5 (Kelly et al. Reference Kelly2010) with merger-driven BH growth models. They find that models with low-mass seeds underproduce the massive end of the BH mass function from intermediate to high redshifts, even when the BHs are accreting at the Eddington rate at all times. Natarajan & Volonteri (Reference Natarajan and Volonteri2012) conclude that stellar-mass seeds would have had to undergone extreme growth conditions (e.g., super-Eddington accretion; also see Madau et al. Reference Madau, Haardt and Dotti2014) or BH seeds were significantly more massive.
We also have some clues from z ~ 0 dwarf galaxies. The existence of BHs with masses overlapping those predicted by some seed-formation models ( $M_{\rm BH} \sim 10^5 \text{M}_\odot$
) demonstrates that BHs do indeed extend to such low masses. It remains to be seen, however, how low they go. Detecting even smaller BHs and measuring their masses is difficult with current observational capabilities. The current record-holder for the least-massive nuclear BH known is
$M_{\rm BH} \sim 10^5 \text{M}_\odot$
) demonstrates that BHs do indeed extend to such low masses. It remains to be seen, however, how low they go. Detecting even smaller BHs and measuring their masses is difficult with current observational capabilities. The current record-holder for the least-massive nuclear BH known is $M_{\rm BH} \sim 5 \times 10^4 \text{M}_\odot$
(Baldassare et al. Reference Baldassare, Reines, Gallo and Greene2015) in the dwarf galaxy RGG 118 (Reines et al. Reference Reines, Greene and Geha2013). In addition to pushing to lower BH masses, we would like to compare observational results to predictions for the BH occupation fraction and scaling relations at low mass for various seed models (e.g., Figure 1). Spectroscopic selection of AGNs in dwarfs have produced the largest samples, but they only place a lower limit on the BH occupation fraction. Moreover, the selection effects are severe and challenging to quantify. Currently, the best constraints on the local BH occupation fraction in low-mass galaxies come from sensitive X-ray observations, but the implications for BH seeding are inconclusive (Miller et al. Reference Miller2015). We are beginning to populate the very low mass end of the M
BH − σ⋆ relation (e.g., Baldassare et al. Reference Baldassare2016a), but there are not yet enough objects to reliably distinguish between models of BH seed formation using this diagnostic. It is interesting to note, however, that the simulated BHs with seed masses of
$M_{\rm BH} \sim 5 \times 10^4 \text{M}_\odot$
(Baldassare et al. Reference Baldassare, Reines, Gallo and Greene2015) in the dwarf galaxy RGG 118 (Reines et al. Reference Reines, Greene and Geha2013). In addition to pushing to lower BH masses, we would like to compare observational results to predictions for the BH occupation fraction and scaling relations at low mass for various seed models (e.g., Figure 1). Spectroscopic selection of AGNs in dwarfs have produced the largest samples, but they only place a lower limit on the BH occupation fraction. Moreover, the selection effects are severe and challenging to quantify. Currently, the best constraints on the local BH occupation fraction in low-mass galaxies come from sensitive X-ray observations, but the implications for BH seeding are inconclusive (Miller et al. Reference Miller2015). We are beginning to populate the very low mass end of the M
BH − σ⋆ relation (e.g., Baldassare et al. Reference Baldassare2016a), but there are not yet enough objects to reliably distinguish between models of BH seed formation using this diagnostic. It is interesting to note, however, that the simulated BHs with seed masses of $M_{\rm BH} \sim 10^3 \text{M}_\odot$
from Habouzit et al. (Reference Habouzit, Volonteri and Dubois2016) eventually grow and connect to the low-redshift sample of broad-line AGNs from Reines & Volonteri (Reference Reines and Volonteri2015) in the M
BH − M
⋆ plane.
$M_{\rm BH} \sim 10^3 \text{M}_\odot$
from Habouzit et al. (Reference Habouzit, Volonteri and Dubois2016) eventually grow and connect to the low-redshift sample of broad-line AGNs from Reines & Volonteri (Reference Reines and Volonteri2015) in the M
BH − M
⋆ plane.
The dearth of detectable X-ray emitting AGNs in high-redshift (z > 6) Lyman Break Galaxies (LBGs) provides additional constraints on the early growth of massive BHs (e.g., Cowie et al. Reference Cowie, Barger and Hasinger2012; Fiore, Puccetti, & Mathur Reference Fiore, Puccetti and Mathur2012b; Treister et al. Reference Treister, Schawinski, Volonteri and Natarajan2013). LBGs with typical stellar masses of $M_{\star} \sim 10^9 \text{M}_\odot$
were massive galaxies at z ~ 6, and it is expected that they would have been seeded with a BH by that time (Volonteri Reference Volonteri2010). Volonteri & Reines (Reference Volonteri and Reines2016) demonstrate that the current non-detections of moderate-luminosity AGNs from stacking high-redshift LBGs can be explained if the BHs in these galaxies have masses on the order of
$M_{\star} \sim 10^9 \text{M}_\odot$
were massive galaxies at z ~ 6, and it is expected that they would have been seeded with a BH by that time (Volonteri Reference Volonteri2010). Volonteri & Reines (Reference Volonteri and Reines2016) demonstrate that the current non-detections of moderate-luminosity AGNs from stacking high-redshift LBGs can be explained if the BHs in these galaxies have masses on the order of $M_{\rm BH} \sim 10^5 \text{M}_\odot$
, as for local AGN host galaxies of similar mass (Reines & Volonteri Reference Reines and Volonteri2015). If this is indeed the case, the implication is that BH seeds must be lower than or comparable to this mass.
$M_{\rm BH} \sim 10^5 \text{M}_\odot$
, as for local AGN host galaxies of similar mass (Reines & Volonteri Reference Reines and Volonteri2015). If this is indeed the case, the implication is that BH seeds must be lower than or comparable to this mass.
The deepest search for X-ray emission in high-redshift galaxies using the 7 Ms CDF-S observations suggests that the faint end of the AGN luminosity function at high redshift has a fairly flat slope, which may favor heavy ( $M_{\rm BH} \sim 10^4-10^5 \text{M}_\odot$
) BH seeds (Vito et al. Reference Vito2016). The lack of bonafide X-ray selected AGN at z > 6 may be due to insufficient coverage of the area versus flux plane of current X-ray surveys and the lack of sensitive spectroscopy in the near-infrared. Future dedicated Chandra surveys coupled with deep near-infrared JWST and sub-millimetre ALMA spectroscopy will pave the way for the next generation of X-ray observatories (ATHENA and the X-ray Surveyor) and extremely large ground-based telescopes (E-ELT, TMT, GMT).
$M_{\rm BH} \sim 10^4-10^5 \text{M}_\odot$
) BH seeds (Vito et al. Reference Vito2016). The lack of bonafide X-ray selected AGN at z > 6 may be due to insufficient coverage of the area versus flux plane of current X-ray surveys and the lack of sensitive spectroscopy in the near-infrared. Future dedicated Chandra surveys coupled with deep near-infrared JWST and sub-millimetre ALMA spectroscopy will pave the way for the next generation of X-ray observatories (ATHENA and the X-ray Surveyor) and extremely large ground-based telescopes (E-ELT, TMT, GMT).
Although we do not yet have a definitive answer regarding the origin of the first BH seeds, there are many reasons to be optimistic about the future (e.g., see Sections 2.3 and 3.6). The theoretical and observational groundwork has already been laid. We are now in a position to capitalise on new and upcoming instruments, telescopes and large surveys, and compare the observational results to ever more sophisticated models.
ACKNOWLEDGEMENTS
We thank Rosa Valiante, Rafaella Schneider, and Marta Volonteri for organising the EWASS symposium ‘Understanding the growth of the first supermassive black holes’ and for the opportunity to write this review. We also thank Marta Volonteri, Jenny Greene, and the anonymous referee for providing useful comments that improved the manuscript. AER is grateful for the support of NASA through Hubble Fellowship grant HST-HF2-51347.001-A awarded by the Space Telescope Science Institute, which is operated by the Association of Universities for Research in Astronomy, Inc., for NASA, under contract NAS 5-26555. AC acknowledges the longstanding collaborators of the Bologna high energy astrophysics group: Marcella Brusa, Nico Cappelluti, Francesca Civano, Roberto Gilli, Giorgio Lanzuisi, Elisabeta Lusso, Stefano Marchesi, Marco Mignoli, Cristian Vignali, Fabio Vito for very useful discussions. James Aird is warmly thanked for providing data for Figure 7 and for his contribution to conceive and develop the Athena surveys strategy. Financial contribution from the PRIN–INAF–2014, the ASI-INAF 2014-045-R.0 grants is acknowledged.


