


The outbreak of coronavirus disease 2019 (COVID-19) is spreading all over the world within a short time span. 1 Globally, 3 090 445 confirmed cases were detected and 217 769 deaths were confirmed as of April 30, 2020. 2 COVID-19 was first started in Wuhan, China, during early December 2019 and rapidly spread in China. Reference Lai, Shih and Ko3,Reference Sun, Lu and Xu4 The COVID-19 outbreak was declared a Public Health Emergency of International Concern on January 30, 2020 Reference Sohrabi, Alsafi and O’Neill5 and a pandemic on March 12, 2020, by the World Health Organization. 6 Most of the Asian and European countries are located in the high-risk zone of the epidemic. Reference Haider, Yavlinsky and Simons7
The world’s most climate-vulnerable country, Bangladesh (BD), Reference Karim and Mimura8-11 is a state in South Asia and also vulnerable to the COVID-19 epidemic (ie, 34 ranked in high-risk index). Reference Haider, Yavlinsky and Simons7 The adverse impacts of the COVID-19 epidemic are expected to be severe in BD. Reference Khan, Siddique and Ali12 On March 8, the first 3 COVID-19-positive patients were confirmed in BD. 1 BD has supported a humanitarian response to immigrants coming from different COVID-19 infected countries (eg, China, Italy, United States, UK). The BD Government’s strategy regarding immigrants’ entry was hampered due to management issues and the unwillingness of most immigrants to maintain proper quarantine and social distancing after their entry. Some of the immigrants were traveling all over the country interacting with others while not adhering to infection prevention practices. As a result, the virus causing COVID-19 spread briskly in different areas of BD. High population density and extreme poverty levels make the situation even worse. COVID-19 has become a serious problem for the residents of BD. The identification of risky areas has not yet been clarified, so it is not obvious which areas in BD are actually affected severely by COVID-19. A spatial mapping-based study also has not been conducted in BD for addressing COVID-19 affected areas. As a result, the spending of government funds might increase but problems remain the same. In this situation, a susceptibility mapping might be an important tool for detecting and reducing the risk of COVID-19. Susceptibility is defined as the likelihood of the occurrence of an event in a certain region. Reference Flentje, Miner and Whitt13 It provides the probability of an event for a given set of physical conditions.
This research included investigating the COVID-19 scenario and identifying actual risky areas based on multicriteria evaluation (MCE) techniques. MCE is a structured framework for investigating, evaluating, and analyzing complex decisions using multiple conflicting criteria. This study also identified the district-wise probable affected zones, which might help find the priority initiatives. The study used 9 factors (ie, population, population density, patient in quarantine, health care facilities, type of port, literacy rate, distance from the capital, number of children, and number of older citizens) for calculating a susceptibility index. The results of the index were classified in different susceptibility levels (ie, high, medium, and low-susceptibility) and represented as susceptibility mapping. The findings of the research will help government authorities develop an effective decision-making process for minimizing COVID-19 exposure and rapid transmission. The specific objective of this study was to examine the factors associated with COVID-19 and to investigate COVID-19 susceptibility using MCE techniques of BD.
DATA AND METHODS
Description of Study Area
BD is located in South Asia sharing a border with India and Myanmar (Figure 1). The country is also narrowly separated from Nepal, Bhutan, and China by the Indian corridor. According to the population, BD is eighth-ranked with having a population of 161 million people. 14 The Ganges Delta connected with the Bay of Bengal is the leading geographic feature of BD. The country is also one of the world’s fastest-growing economies and one of the fastest-growing middle-income countries. 15 BD is divided into 8 administrative divisions and 64 districts. The 64 districts of BD were selected as the study area for the research.
Map of Bangladesh, Highlighting the District.

Description of Materials
Secondary data from relevant organizations were collected, including physical features (ie, boundary, roads, river, etc.) from Geological Survey of Bangladesh (GSB), socioeconomic and demographic data from Bangladesh Bureau of Statistics (BBS), port information from Bangladesh Land Port Authority, distance between different districts from the Local Government Engineering Department (LGED), location of health care facilities from the Directorate General of Health Services (DGHS), information about COVID-19 from the Institute of Epidemiology Disease Control and Research (IEDCR), and satellite images from Google Earth. For calculating the weight of different factors and subfactors of MCE techniques, randomly 120 primary data were collected from expert opinion surveys. The results were also validated through stakeholder interviews (ie, 12 key persons of government agencies).
MCE Techniques and Susceptibility Mapping
Many methods are available for susceptibility mapping, that is, analytic hierarchy process (AHP), conditional analysis method (CAM), regression models (RM), geomorphological mapping (GM), frequency ratio approach (FRA), and machine learning (ML), etc. CAM is the simplest method, Reference Clerici, Perego and Tellini16 GM is often used in the field of geomorphological and environmental research, Reference Nefeslioglu, Duman and Durmaz17 statistical approach FRA is used to simulation environmental conditions, Reference Yilmaz18 RM are statistical processes for estimating the relationships between different variables, Reference Lee19 and ML is the study of computerized algorithms and statistical models for conducting specific tasks. Reference Bhutia, Borah, Pradhan, Sarma, Bhuyan, Borah and Dutta20 On the other hand, AHP is a structured technique for organizing and analyzing complex decisions, based on mathematics and psychology. Reference Pourghasemi, Pradhan and Gokceoglu21 Geographical Information System (GIS)-based susceptibility mapping using AHP provides the most accurate result among other methods. In this research, the COVID-19 susceptibility map was prepared by using the AHP method. The AHP method is one of the popular MCE techniques. Reference Saaty22 MCE techniques are effective in this research because the factors used for susceptibility mapping conflict with each other. Nine factors (ie, population, population density, patient in quarantine, health care facilities, type of port, literacy rate, distance from the capital, number of children, and number of older citizens) were selected for the research. All factors are classified into 4 classes for existing inventory analysis. AHP develops a hierarchy of decision factors through a pairwise comparison matrix. Reference Poudyal, Chang and Oh23,Reference Feizizadeh and Blaschke24 A pairwise comparison was conducted for both the factors and classified subfactors. The weight rating follows a 9-point continuous scale: (1/9, 1/8, 1/7, 1/6, 1/5, 1/4, 1/3, 1/2, 1, 2, 3, 4, 5, 6, 7, 8, 9). Here, the factor weight values greater than 1 represent more importance, less than 1 represent less importance, and 1 represents equal importance in relation to another factor. Reference Eastman25 Eigenvalues were calculated through weight rating. Eigenvalues are a special set of scalars associated with a linear system of equations (ie, a matrix equation). For susceptibility mapping using AHP, weights of each causative factor are obtained from the eigenvalues. A consistency ratio (CR) (ie, index for degree of consistency) was calculated, as shown 26 :
 $$CR = {{CI} \over {RI}}$$
Where RI = mean or average consistency index, and CI = consistency index
 $$CI = {{{y_{\max }} - N} \over {(N - 1)}}$$
Where ymax = the largest Eigenvalue, and N = the order of the comparison matrix.
The acceptable value of CR should not be greater than 0.10. Reference Saaty22 Finally, the GIS-based susceptibility index (SI) was calculated using factor maps and weight of factors and subclass. The following equation was used for index calculation. Reference Reis, Yalcin and Atasoy27
 $$SI = \mathop \sum \limits_{j = 1}^n W_j*{w_{ij}}$$
Where, Wj= Weight of causative factor j, wij= weighted value of class i of causative factor j.
Finally, districts were grouped in 4 quantiles based on the susceptibility index where high-susceptibility districts were grouped as the 4th (ie, greater than 75th percentile), medium-susceptibility districts were grouped as 3rd (ie, 50–75th percentiles), and 2nd (ie, 25–50th percentiles) and low-susceptibility districts were grouped as 1st (ie, less than 25th percentile). A susceptibility map was prepared for representing the different levels of susceptibility. A comparison between district-wise susceptibility indexes and district-wise confirmed cases was conducted.
RESULTS AND DISCUSSION
BD is the world’s eighth-most populated country (containing 2.2% of the world’s population). Reference Kayastha, Dhital and De28 According to the population census of 2011, the population of BD was 144 million and the population was projected as 168 million in 2020. The vast number of the population might be one of the major causes of widespread COVID-19. It is difficult to maintain social distance (especially in the market and public transport) for the residents due to the vast population. If the outbreak of COVID-19 spread through community transitions, more people might be affected because of higher population numbers. On the other hand, it will be difficult to maintain all of the facilities for the enormous population by government agencies. The research classified the 64 districts into 4 classes (Figure 2). Four districts (ie, Dhaka, Chittagong, Comilla, Mymensingh) have populations of more than 5 million. These districts might be severely affected by COVID-19. The world’s fastest-growing megacity, Dhaka, has a population of more than 12 million. Dhaka is considered a high-risk district in BD for COVID-19. Districts near Dhaka (ie, Narayanganj, Gazipur, Tangail, etc.), divisional district (ie, Rajshahi, Sylhet, Rangpur, etc.), and economically influential district (ie, Bogra and Jessore) are in a class population of 2.5–5 million. These districts might be also affected if COVID-19 has spread all over the country. Based on population, the hill tracts district (Khagrachhari, Rangamati, and Bandarban) might be in the low-risk zone of COVID-19.
Population.

According to population density, BD is seventh in the world (having 1107 people per square kilometer). Reference Kayastha, Dhital and De28 A higher population density might be responsible for more interaction as well as COVID-19 transmission. Figure 3 illustrates that Dhaka and Narayanganj population densities total more than 3000. The Dhaka District contains 8111 people per square kilometer and might be most vulnerable to the COVID-19 epidemic. The districts near Dhaka and Narayanganj (ie, Narsingdi, Gazipur, Comilla, and Feni) were classed as 1500–3000 people per square kilometer. It can be said that the central zone of BD (including these districts) might be affected severely if the epidemic spread throughout the country. The population density in southern districts is less than the northern part. Due to population density, the southern part of BD might be less vulnerable than the northern part.
Population Density.

According to the IEDCR of BD, a total of 1345 patients in 37 districts were in quarantine by March 14, 2020. According to Figure 4, 4 districts (ie, Chandpur, Manikganj, Shariatpur, and Kishoreganj) have more than 50 patients in quarantine, and these districts might be in the high-risk zone for COVID-19. These 4 districts are near Dhaka and, as a result, central regions of BD might be affected by the districts. On the other hand, districts Narayanganj, Narsingdi, and Madaripur near Dhaka, those near the largest land port (ie, Jessore, Jhenaidah, Magura, Rajbari), and Chittagong have 6–50 patients. Most of the patients in the Jessore region have come from India, and the majority of patients in quarantine in other districts have come from Italy, the UK, and the United States. Figure 4 also illustrates southern districts in the low-risk zone based on patient numbers in quarantine.
Patients in Quarantine.

Districts were classified into 4 classes based on the number of health care facilities (eg, community clinic, government hospital, non-government hospital, private hospital). All health care facilities in BD do not have the capacity for treating COVID-19 patients; however, health care centers may play a good role for building public awareness. Previously, the health care centers played a respectable role for building community awareness (eg, AIDS, family planning, first aid). The majority of government hospitals have doctors, test facilities, and other supporting facilities. Last year, government hospitals gave great support during the dengue epidemic. So, it can be said these hospitals can play a vital role in minimizing the impact of the COVID-19 epidemic on the community level. Figure 5 illustrates western coastal districts (ie, Khulna, Barguna, Bhola, etc.) and hill tracts districts (ie, Chittagong, Khagrachari, Rangamati, and Bandarban), which have fewer numbers of health care facilities, therefore greatly impacting the capacity of these facilities to properly treat patients with COVID-19. The northern part of BD has respectively more health care facilities. Districts in the northern part might be in the low-risk zone due to availability of health care.
Health Care Facilities.

According to Figure 6, 3 types of international ports (ie, airport, land port, and seaport) are available in BD. Three international airports are located in Dhaka, Chittagong, and Sylhet districts. These 3 districts are more susceptible due to more immigrants coming from COVID-19 affected countries. On the other, land ports are mainly connected with India and Myanmar; 20 districts have the land port and those districts may also be vulnerable to COVID-19. The majority of port users visited different parts of India because of medical facilities and visiting historical places. They might interact with other foreigners, contributing to the COVID-19 transmission in BD. Chittagong, Khulna, and Patuakhali Districts might also be affected by COVID-19 due to seaport users. It can be said that Chittagong and Sylhet Districts are at high-risk because of having more than 1 port. Districts having no ports might be at low-risk, but COVID-19 can spread from the nearby port districts.
Ports Map.

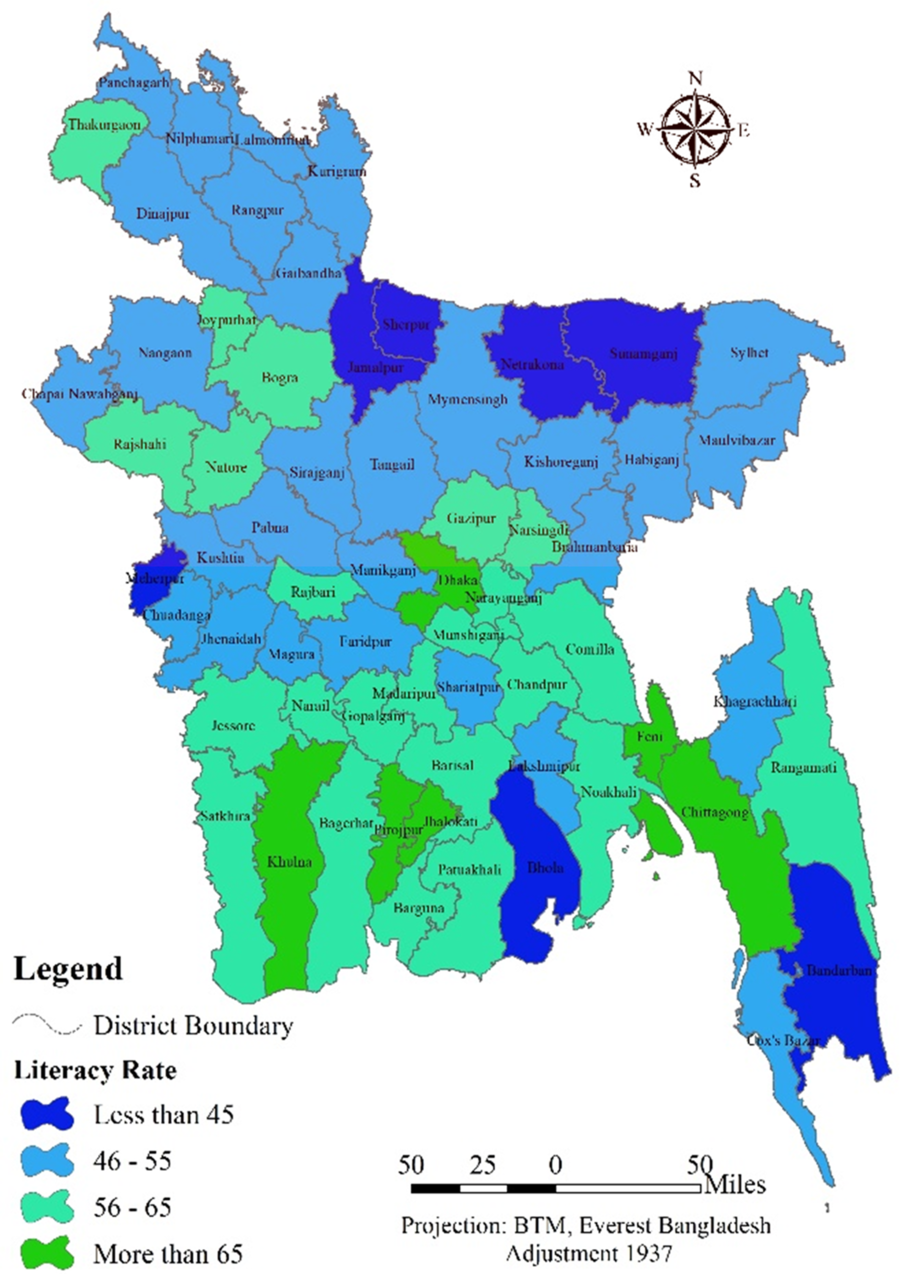
Community awareness depends on the literacy rate. Higher literacy rates might increase public awareness, resulting in a decrease of COVID-19 transmission. Figure 7 illustrates that Dhaka, Chittagong, and Khulna divisional districts have a literacy rate of more than 65%. These districts fall in a low-susceptible level of infection based on education level. The northern districts are at higher risk than the southern districts due to lower literacy rates.
Literacy Rate Map.
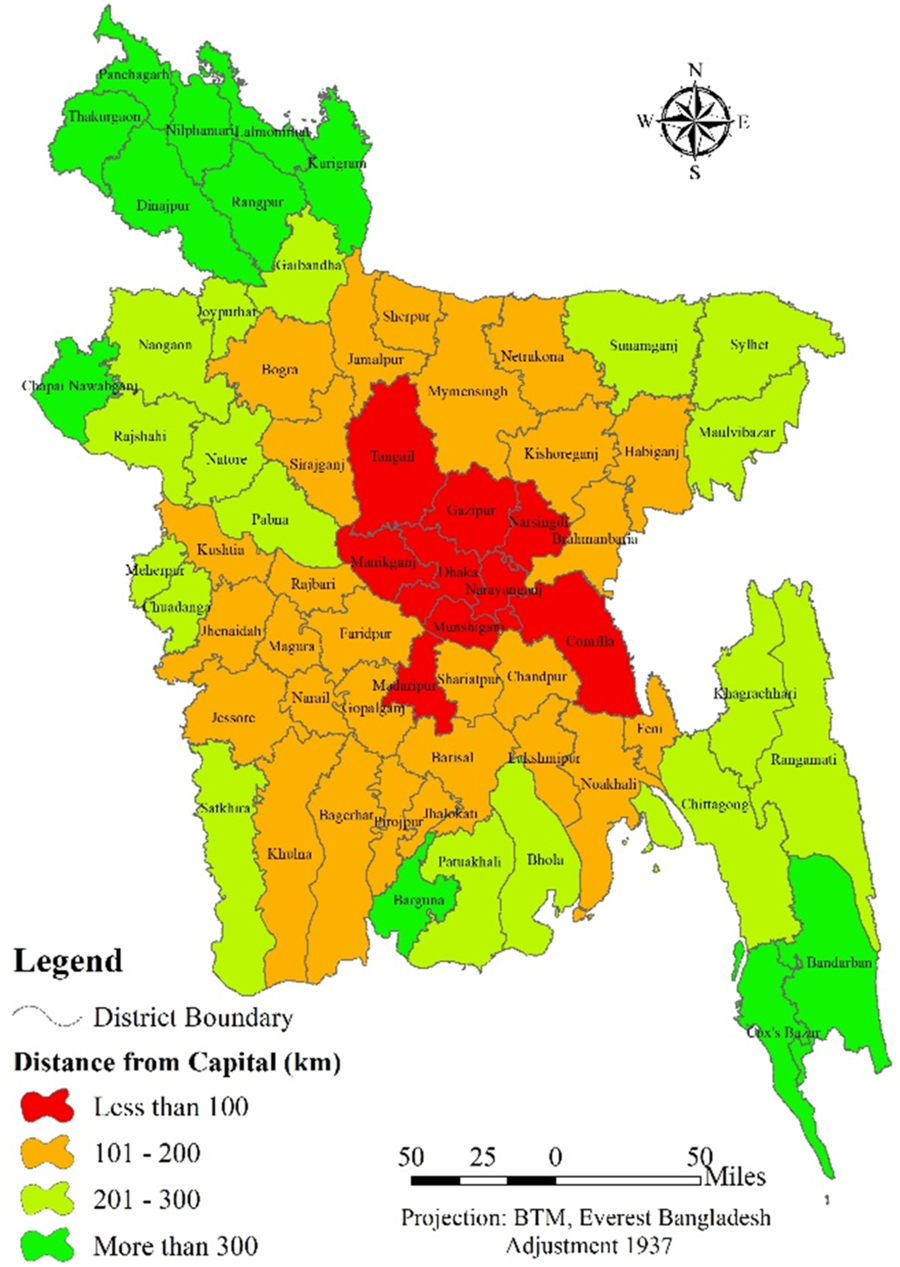
Dhaka is the center of all socioeconomic activities in BD. Every day, people from all districts visit Dhaka for various purposes. Also, Dhaka might be considered a high-risk zone for COVID-19 due to international collaboration, thereby contributing to the spread of COVID-19 throughout the country. Districts near Dhaka (ie, approximately 100 kilometers) having more interactions (in the scale of the population) with the capital are in high-risk zones. Figure 8 illustrates the distance from the capital. Northern districts are far from Dhaka and located in low-susceptible zones.
Distance From the Capital.
Senior citizens and children are at high-risk of COVID-19. Figure 9 illustrates the number of children in different districts. More than 350 000 children live in each of these districts: Dhaka, Chittagong, Sylhet, and most of the districts in the eastern border of BD. Those districts are more vulnerable to COVID-19. Districts along the western border of BD have less risk due to fewer children.
Number of Children by District.

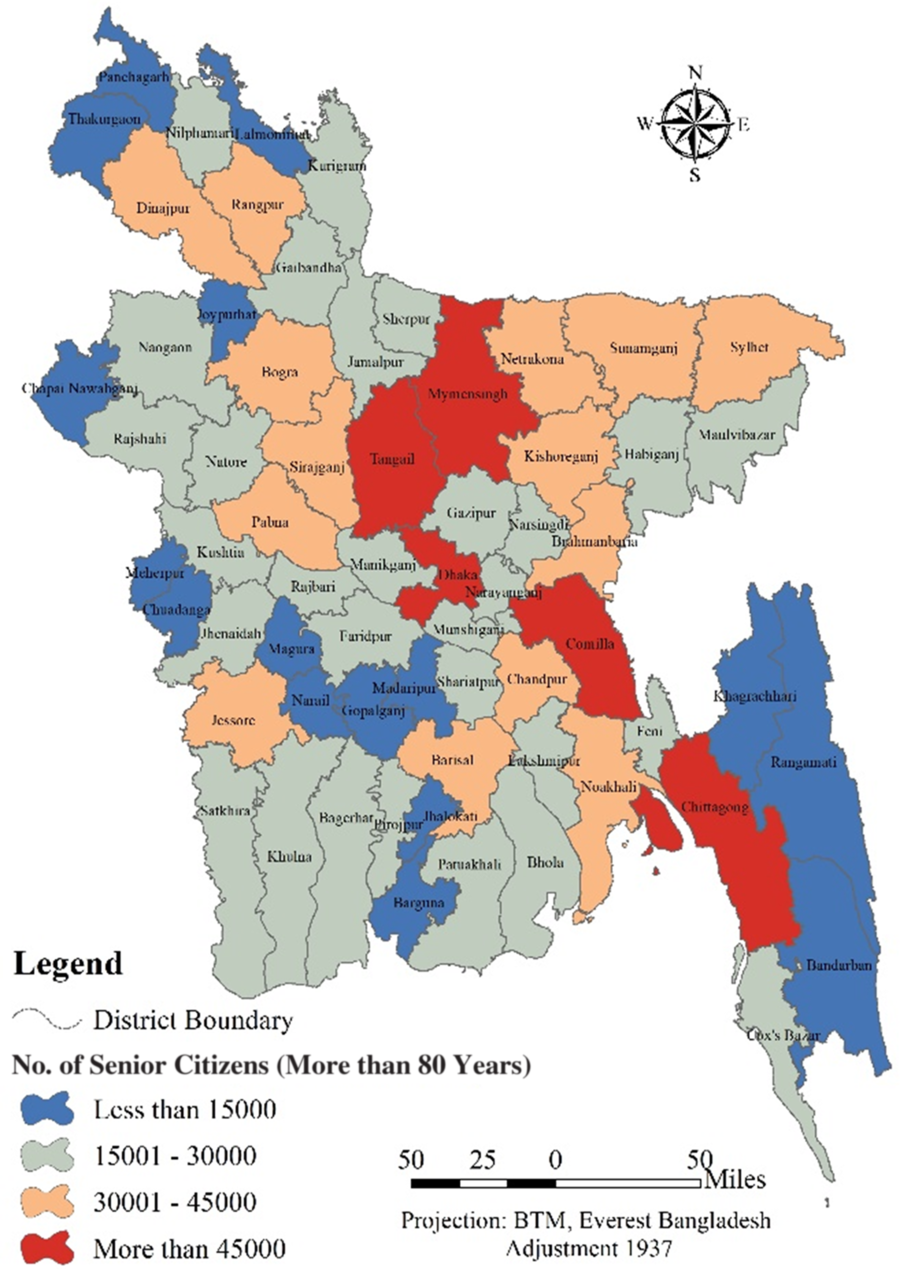
Figure 10 shows the distribution of senior citizens in BD. Five districts (ie, Comilla, Mymensingh, Chittagong, Dhaka, and Tangail) have more than 45 000 senior citizens. Those districts are in the high-susceptible levels of COVID-19. Districts in the hill tracts, southwestern, and northern districts are in low-susceptible levels due to less numbers of senior citizens.
Number of Senior Citizens by District.
Pairwise Comparison Matrix of the Subfactors
The values of the pairwise comparison matrix (Table 1) were calculated through an expert opinion survey. The table shows relative weights of the subfactors, CR, and eigenvalues. For the purpose of the study, each of the 9 factors was classified into 4 classes. According to the matrix, the CR for all factors was less than 0.10. The CR showed that the matrix ratings were randomly and preferable for susceptibility calculation. Based on observation, eigenvalues are higher for the subfactor, which might influence the spread of COVID-19.
Pairwise Comparison Matrix, Consistency Ratio, and Weights of the Subfactors

Pairwise Comparison Matrix of the Factors
Finally, weight for 9 factors was calculated using a pairwise comparison matrix (Table 2). The CR was 0.082786 for the factors and it was in the permissible limit. As found from the matrix, the type of port factor has the highest weight (ie, eigenvalues = 0.2907). COVID-19 did not originate in BD, and people in BD were affected due to those coming to BD from different countries (ie, international passengers). That might be the reason behind giving the most importance to this factor by the experts. The weight for patients in quarantine was the second high (ie, eigenvalues = 0.207715). In March 2020, a vast number of immigrants came to BD from various affected countries. Some of the immigrants followed the guidelines of the BD government and some might not have. Experts might give higher importance on this factor based on the reason. On the other hand, the availability of health care facilities might reduce the spreading of COVID-19 in BD. Experts gave more importance to the availability of health care facilities factor. Similarly, distance from the capital, population density, and population have higher weights than the rest of the factors.
Pairwise Comparison Matrix, Consistency Ratio, and Weights of the Factors

COVID-19 Susceptibility Index and Susceptibility Map
Figure 11 illustrates a district-wise susceptibility map based on the COVID-19 susceptibility index. Districts were classified into 4 quantiles (Table 3). According to Table 3, the 1st quantile susceptibility index represented low-susceptible districts, 2nd and 3rd quantiles susceptibility index represented medium-susceptible districts, and high-susceptible districts were represented by the 4th quantile susceptibility index. It was found that Chittagong District was most susceptible to COVID-19 (ie, susceptibility index = 0.435219362). Dhaka was second in rank for susceptibility (ie, susceptibility index = 0.41133316). Higher index values showed that most of the factors were higher in these 2 districts. Especially, Chittagong has 2 ports and Dhaka is the center of all international collaborations. The 2 districts also have a higher population and population density. Sylhet was fifth in index ranking with having 2 ports (international airport and land port). Districts along the eastern border of BD (ie, Comilla, Feni, Brahmanbaria) and near Dhaka (ie, Manikganj, Narayanganj, Mymensingh, Narsingdi, etc.) were found to be high-susceptible districts. Good communication with Dhaka and Chittagong might be the reason behind this. In the center of the southwestern part of BD, Jessore district was ranked 12th in the susceptibility index. This district has the largest and most important Bangladesh–India land port. No high-susceptible districts were found in the northern part of BD because of less international connections, lower populations, and lower population density. Southwestern coastal districts are in the medium- and low-susceptible zones of COVID-19.
Map Based on District COVID-19 Susceptibility Index.

List of Districts Based on Their COVID-19 Susceptibility Index in Different Quantiles

The IEDCR reported 33 confirmed COVID-19 cases in 7 districts as of March 24, 2020. The susceptibility index values of 7 districts were compared with the number of confirmed cases (Figure 12). All confirmed cases were in high- and medium-susceptible districts.
Relative Susceptibility of Districts and the Number of Confirmed COVID-19 Cases Reported by the IEDCR as of March 24, 2020.

CONCLUSION
Multiple causal factors might be responsible for COVID-19 spreading in BD. The research prepared different factor maps, susceptibility index, and susceptibility zoning map for BD. Nine factors were used for the study. As results indicated, Dhaka and Chittagong Districts might be most vulnerable to COVID-19. Dhaka and Narayanganj Districts have a high population density and, as a result, these districts might be vulnerable to COVID-19 transmission. Patients in the quarantine factor showed that 4 districts (Chandpur, Manikganj, Shariatpur, and Kishoreganj) might be in the high-risk zone of COVID-19. Districts located in the northern part of BD might be in the low-risk zone due to the higher availability of health care facilities and treatment. Dhaka, Chittagong, and Sylhet Districts have more connectivity with immigrants coming from COVID-19 affected countries therefore higher susceptibility to COVID-19. According to the literacy rate factor, northern districts are at higher risk than the southern areas of BD. The study also illustrated that Dhaka and nearby districts (within 100 kilometers) have more collaboration and are located in high-risk zones of COVID-19. As shown in the pairwise comparison matrix, the CRs for subfactors and factors were less than 0.10 (0.036315–0.082786). Factor weights 0.2907, 0.207715, and 0.150903 were determined for type of port, patients in quarantine, and the number of health care facilities, respectively. The maximum value for susceptibility index was 0.435219362 for Chittagong, and the minimum value was 0.076174 for Naogaon. Based on results, Chittagong District was ranked first in the susceptibility index and the capital Dhaka ranked second (susceptibility index = 0.41133316). Finally, the COVID-19 susceptibility map illustrated the district-wise susceptibility distribution (ie, 4th quantile for high susceptibility, 3rd and 2nd quantiles for medium susceptibility, and 1st quantile for low susceptibility).
The findings of this research might help the communities and government agencies in developing an effective decision-making approach to reduce losses caused by COVID-19. Initiatives associated with the prevention, mitigation, and avoidance of COVID-19 might be effective in BD based on the results of the research. However, some limitations exist. A factor-based method was used in this research, but the factors are not fixed. Therefore, future changes with the factors can change the susceptibility levels. Further research will be needed to address the limitations.
Conflict of Interest Statement
The author has no conflict of interest to declare.


 Open access