


Introduction
Ground state depletion (GSD) microscopy is a form of super-resolution light microscopy suggested almost a decade ago [Reference Hell and Kroug1] but demonstrated practically in 2007 [Reference Bretschneider, Eggeling and Hell2]. In principle, this is a parallel recording wide-field approach that temporarily switches the majority of fluorophores off to allow the precise localization of single fluorophores. Almost all fluorophores in the sample are turned dark by high-intensity laser excitation, leaving only single, well-separated fluorophores emitting fluorescence. The precise localization of the fluorescent dyes is then determined to produce images with a resolution in the 20- to 50-nanometer range. One of the key advantages of this method over other localization techniques is that it can be used with standard fluorescence labels routinely applied in biomedical research.
Polar epithelial cells can be found on the surface of multi-cellular organisms and can cover cavities throughout the body and serve as a protection barrier. They thus regulate the secretion and exchange of different substances. One of the most important issues in the development and maintenance of a polarized epithelium is the specific composition of the apical and the basolateral plasma membrane. Therefore, proteins and lipids are segregated into distinct vesicle populations destined for one of the two membrane domains. The underlying process of vesicle trafficking involves the integrity of cytoskeletal tracks formed by actin microfilaments and microtubules. Actin microfilaments are involved in endocytic uptake from the plasma membrane as well as in postendocytic trafficking in epithelial cells [Reference Apodaca3]. Microtubules are required for long-range transport processes, and consequently the integrity of an epithelial cell sheet can be disturbed by alterations in the microtubule composition [Reference Yap, Stevenson, Abel, Cragoe and Manley4]. Extensive experiments with microtubule-disrupting agents showed the importance of microtubules in apical protein trafficking [Reference Apodaca3, Reference Musch5]. Microtubules are long filamentous elements that are important in organelle positioning and trafficking. They are composed of two highly conserved subunits, alpha- and beta-tubulin, which are alternatingly arranged along individual protofilaments. One microtubule is composed of thirteen laterally aligned protofilaments with a polarized arrangement defined by a plus and a minus end. Microtubules originate from microtubule organizing centers or equivalent structures and point with their plus ends toward the cell periphery. They are highly dynamic structures because they are constantly built and degraded in a living cell. The dynamics of microtubules can be modulated by cellular factors, like microtubule-associated proteins (MAPs), catastrophines, and post-translational modifications. One of the early described post-translational modifications is the tyrosination-detyrosination-cycle of tubulin, where a tyrosine residue is added (tyrosination) or removed (detyrosination) from the C-terminus of α-tubulin. Alpha-tubulin is synthesized with a C-terminal tyrosine that can be removed by α-tubulin tyrosine carboxypeptidase, leading to detyrosinated tubulin (detyr-tubulin). Another enzyme, tubulin tyrosine ligase (TTL), catalyzes the post-translational C-terminal tyrosination of alpha-tubulin and thus restores the C-terminus of alpha-tubulin. Structural analysis of TTL revealed that this enzyme forms an elongated complex with the tubulin dimer and prevents its incorporation into microtubules by capping the tubulin longitudinal interface [Reference Szyk, Deaconescu, Piszczek and Roll-Mecak6]. Consequently, TTL modifies preferentially alpha-tubulin in the soluble tubulin pool. This tyrosination-detyrosination cycle has been characterized in a wide range of eukaryotes including trypanosomes, nematodes, and humans [Reference Szyk, Deaconescu, Piszczek and Roll-Mecak6]. Tyrosination or detyrosination of alpha-tubulin affects the stability of microtubules because dynamic microtubules are considered to be tyrosinated (tyr-), whereas the detyrosinated (detyr-) form can be found in stable microtubules inhibiting microtubule disassembly [Reference Peris, Wagenbach, Lafanechere, Brocard, Moore, Kozielski, Job, Wordeman and Andrieux7].
In this article we used ground state depletion (GSD) microscopy to depict the arrangement of tyr- and detyr-tubulin along single microtubules with a resolution in the 50 nm range. Intervention into the balance between the two tubulin forms by overexpression of TTL alters the equilibrium between tyr- and detyr-microtubules. This results in the disruption of epithelial monolayer formation and affects the apical protein trafficking.
Methods and Materials
Cell culture. Madin-Darby canine kidney (MDCK) cells were cultured at 37° C under 5% CO2 in minimum essential medium (PAA) containing 5% fetal calf serum (FCS) or in Dulbecco's Modified Eagle's Medium (4.5 g/l glucose) containing 10% FCS supplemented with antibiotics and glutamine. To prepare 3D cysts approximately 1 × 10⁵ MDCK cells were mixed 1:1 with BD Matrigel™ Basement Membrane Matrix Phenol Red Free (BD Biosciences) coated on a coverslip and incubated for 8 days.
Immunofluorescence staining. After a five-minute fixation with ice-cold methanol, the cells were blocked for 1 hour with 1% milk powder in PBS++ (PBS with 1 mM CaCl2 and 1 mM MgCl2). The immunostaining was performed by using monoclonal anti-alpha tubulin (DM1 A, Sigma), monoclonal anti-tyr-tubulin (YL1/2, Santa Cruz), or polyclonal anti-detyr-tubulin (Millipore) primary antibodies for 2 hours, which were then labeled with AlexaFluor488-, AlexaFluor546-, or AlexaFluor647-coupled secondary antibodies (Invitrogen) for 1 hour. For GSD microscopy, coverslips were sealed at that time onto the cavity of a depression microscope slide in 10 mM MEA (β-Mercaptoethylamine) in PBS using Twinsil® in a ratio of 1:1. For confocal microscopy the nucleus staining was performed using Hoechst 33342. Three-dimensional cysts were stained in a similar manner but with longer incubation times: methanol fixation for 20 minutes, blocking for 2 hours, primary antibody for 24 hours, secondary antibody for 14 hours, Hoechst 33342 for 30 minutes, and washing steps for 20 minutes each.
Microscopy. Confocal images were acquired on a Leica TCS SP2 AOBS microscope using a 40× oil planapochromat objective (Leica Microsystems). The high-resolution images were acquired on the Leica SR GSD super-resolution system (Leica Microsystems). For GSD, prepared samples were sequentially analyzed for Alexa488- and Alexa647-fluorescence. Up to 5,000 images were recorded per dye for image construction. Image recordings of each dye from identical sections were then merged with the corresponding Leica software tool for image presentation. In general, image data were evaluated with Leica software in combination with the Volocity imaging software package (Improvision).
Results
Distribution of detyrosinated and tyrosinated tubulin. To analyze the apical and basolateral transport processes in polarized cells, it was necessary to check the arrangement of different tubulin modifications by using immunofluorescence microscopy. Here, MDCK cells were used; these resemble a classical cell culture model to analyze epithelial polarity, epithelial morphogenesis, and epithelial junctions [Reference Rodriguez-Boulan, Kreitzer and Musch8]. If MDCK cells are grown in a collagenous matrix (Matrigel), they form cysts lined by monolayers of highly polarized cells. These cysts were fixed, and detyrosinated or tyrosinated microtubules were specifically stained with anti-detyr-tubulin or anti-tyr-tubulin antibodies and analyzed by immunofluorescence. Figure 1 indicates that neither detyr- nor tyr-tubulin preferentially concentrates at one of the two cell poles. The distribution of detyr- and tyr-tubulin on single microtubules was then analyzed by high-resolution GSD-microscopy of MDCK cells. Because this technique requires relatively flat objects for optimal results, MDCK wild-type cells were grown on coverslips for only one day. As depicted in Figure 2B alpha tubulin antibodies were evenly distributed along the microtubule. If specific antibodies for tyr- or detyr-tubulin were used, short detyr-tubulin sections of up to 1 μm length were disrupted by longer segments of tyr-tubulin, concentrated at the tubulus ends (Figure 2A). So, detyr- and tyr-tubulin were arranged like a pearl cord along microtubules. Similar observations based on electron microscopy have been described before [Reference Geuens, Gundersen, Nuydens, Cornelissen, Bulinski and DeBrabander9]. These previous workers had analyzed microtubules from African green monkey and rat kangaroo cells and detected a patchy staining of tyr- and detyr-tubulin-rich segments of about 800 to 900 nm in length.
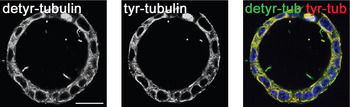
Figure 1: There is no evidence for a polarized occurrence on the apical or basolateral cell pole for tyr- or detyr-tubulin. MDCK cell cysts were grown for 7 days in Matrigel, as a model for studying the polarized distribution of proteins and were then analyzed by confocal microscopy. The left and the middle image show the same cyst immunostained with antibodies directed against detyrosinated (AlexaFluor488, green) and tyrosinated tubulin (AlexaFluor546, red). In the right panel merged images are depicted. The localization of both tubulin forms on the same area is displayed by yellow coloring, and the nuclei are shown in blue. Scale bar = 20 μm.
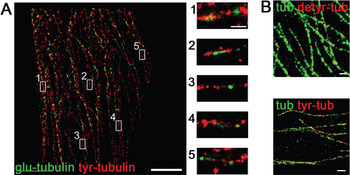
Figure 2: High-resolution images of single microtubules stained with various tubulin antibodies. The immunostaining for GSD microscopy was performed with AlexaFluor488 and AlexaFluor647 to label detyr-, tyr-, or alpha-tubulin on cells one day after seeding. (A) On the left side an overview screen of a cell is shown with detyr-tubulin in green and tyr-tubulin in red. Enlarged images of this overview are marked with the indicated numbers. A sequential alignment of the two alpha-tubulin variants along microtubules can be observed. Left scale bar = 5 μm, right scale bar = 1 μm. (B) For control the microtubules were stained with antibodies directed against alpha-tubulin (green) and detyr- or tyr-tubulin (red). Microtubules show a continuous staining with alpha-tubulin. Scale bars = 5 μm.
Depletion of detyr-tubulin by tubulin tyrosine ligase. To assess the effect of changes in tyr- and detyr-tubulin during the polarization process, we impaired the post-translational modification of tubulin by stably over-expressing the TTL in MDCK cells. At first, the cDNA of TTL had to be cloned from MDCK cells by reverse transcriptase polymerase chain reaction (RT-PCR). Then it was fused to enhanced green fluorescent protein (eGFP) for fluorescence microscopic detection and cloned into a eukaryotic expression vector. Following transfection into MDCK cells, clones stably expressing TTL-GFP were isolated by G418-selection, fluorescence microscopy, and immunoblot analysis. The resulting cell clone was named MDCKTTL-GFP. Co-cultivation of MDCK and MDCKTTL-GFP cells, followed by fixation and immunostaining against detyr- and tyr-tubulin, revealed that MDCKTTL-GFP cells show a dramatic decrease in detyr-tubulin (Figure 3). This alteration might affect the morphology of epithelial monolayers as well as intracellular trafficking pathways. The morphology of detyr-tubulin deficient MDCK cells (MDCKTTL-GFP) was compared with the morphology of MDCK cells after various days in culture. One day after plating, MDCKTTL-GFP cells showed a tendency to join into small cell islands and a significant decrease in cell size (Figure 4). Furthermore, in comparison to MDCK cells they prematurely polarized as assessed by immunostaining with specific apical and basolateral polarity markers [Reference Zink, Grosse, Freikamp, Banfer, Muksch and Jacob10]. In addition, studies on the polarized delivery of glycoproteins to the apical or basolateral membrane compartment revealed that TTL expression significantly reduces the transport kinetics of apical proteins in MDCK cells [Reference Zink, Grosse, Freikamp, Banfer, Muksch and Jacob10].
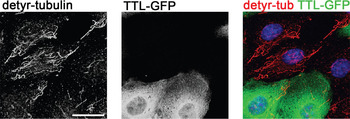
Figure 3: In MDCKTTL-GFP cells the level of detyr-tubulin is dramatically decreased. MDCK and MDCKTTL-GFP cells (green) together were immunostained 3 days after seeding with specific detyr-tubulin antibodies (AlexaFluor546, red). The merged image (right) shows a significantly reduced level of detyr-tubulin (shown in red, left) in cells over expressing TTL-GFP (shown in green, middle) compared to cells without TTL-GFP (no green staining, right and left). Nuclei are indicated in blue in the merged image (right). Scale bar = 20 μm.
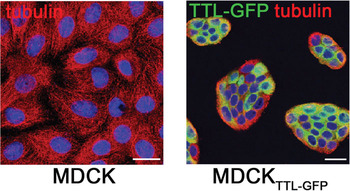
Figure 4: MDCKTTL-GFP cells show a tendency to join into islands in the early polarization process. MDCK and MDCKTTL-GFP (green) cells were seeded at identical densities on coverslips, incubated for one day and fixed for immuno-staining with anti-tubulin antibodies (Alexa546, red). Wildtype cells show the normal extended morphology of epithelial cells early after seeding (left image). In comparison TTL overexpressing cells (MDCKTTL-GFP, green) are much smaller and arranged in compact cell islands (right image) at the same time point. Nuclei are indicated in blue. Scale bar = 20 μm.
Discussion
In this study, we investigated the arrangement of tyrosinated and detyrosinated tubulin in epithelial cells and during the polarization process. Previous analysis on nerve cells revealed a prevalent location of tyr-tubulin in the cell body and of detyr-tubulin at the minus ends [Reference Baas and Black11, Reference Brown, Slaughter and Black12]. We could not detect a polarized distribution of one of the modifications in MDCK cells indicating a different cytoskeletal architecture in various cell types.
The alternating stretches of both tubulin variants shown in Figure 2 were described and generated previously with several methods and in various organisms [Reference Arce and Barra13, Reference Geuens, Gundersen, Nuydens, Cornelissen, Bulinski and DeBrabander14, Reference Johnson15, Reference Webster, Gundersen, Bulinski and Borisy16]. Here, we showed for the first time this segmental labeling using high-resolution light microscopy. The authors speculate that this structure contributes to a preferential binding of dynein or kinesin motor proteins for distinct trafficking events within epithelial cells. This exciting technique allows us to visualize the distribution of these post-translational modifications of tubulin along single microtubules, which was not possible using conventional fluorescence microscopy. We were thus able to focus on separated microtubule strands to measure the described tubulin segments.
An overexpression of the TTL, the enzyme that converts detyrosinated to tyrosinated tubulin, dramatically reduces the level of detyr-tubulin (Figure 3). The depletion of detyr-tubulin and thereby of stable microtubules leads to a disorganization of monolayer formation and to a cell island assembly in an early stage of the polarization process (Figure 4).
Additionally, these cells show a prematurely polarized architecture [Reference Zink, Grosse, Freikamp, Banfer, Muksch and Jacob10]. These morphological effects could be explained by the need of detyrosinated microtubules for the asymmetry of migrating cells, which was previously reported by Gundersen and Bulinski in 1988 [Reference Gundersen and Bulinski17]. So, the TTL overexpressing cells are more immobile and settle down to form the typical islands with tight contact to neighboring cells. In contrast, an increase in detyr-tubulin levels is required for the whole differentiation processes in various cell types [Reference Peris, Thery, Faure, Saoudi, Lafanechere, Chilton, Gordon-Weeks, Galjart, Bornens, Wordeman, Wehland, Andrieux and Job18, Reference Whipple, Matrone, Cho, Balzer, Vitolo, Yoon, Ioffe, Tuttle, Yang and Martin19].
Our further studies aim to clarify the function of tubulin modifications for epithelial integrity and with that the involvement of components or interaction partners for this process.
Conclusion
In this study we analyzed the arrangement of tyr- and detyr-tubulin in polarized MDCK cells. In many cases we observed a sequential alignment of the two alpha-tubulin variants along microtubules. The distribution of detyr- and tyr-tubulin was localized by super-resolution GSD microscopy in greater detail so that we could confirm, with a fluorescence microscopy technique, observations that were previously based on electron microscopy. This organization seems to be involved in subcellular apical trafficking because a depletion of detyr-tubulin reduces the apical transport efficiency. In addition, alterations in the morphology of TTL-overexpressing MDCK cells revealed that the balance between detyr- and tyr-tubulin plays a decisive role in the formation of epithelial monolayers. Taken together, detyrosinated microtubules are required for the establishment and maintenance of polarized epithelial cell monolayers.
Acknowledgments
We thank Leica Microsystems for the use of the SR GSD super-resolution system and the SFB 593 (Deutsche Forschungsgemeinschaft) for funding.


