


Introduction
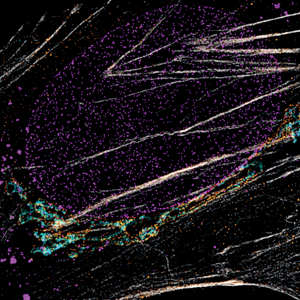
The basic approach behind stimulated emission depletion (STED) is straightforward [Reference Hell and Wichmann1]. It starts where confocal microscopy ends: a small region is excited by a focused laser beam (Figure 1A). However, “small,” by the laws of physics, is not an arbitrary term but happens to be about half of the wavelength used. At a diameter of about 200 nanometers, this is still much larger than a molecule, so that individual fluorophores cannot be singled out. Essentially, it's like probing a vinyl disk with a broomstick—you're missing the groove. Now, STED brings a second light beam into play. This light beam switches off excited fluorophores through a basic molecular process called stimulated emission (hence the name). It is shaped like a ring with a hole, often referred to as a donut, and thus deliberately silences fluorescent molecules in the outskirts of the diffraction-limited focus region, effectively making it much smaller than the limitation dictated by basic optics (Figure 1B). What is left to fluoresce is a tiny area in the dark center of the donut with a minute diameter way below 200 nm. Even better, this concept can be extended to three dimensions [Reference Heine2] (Figure 1C).
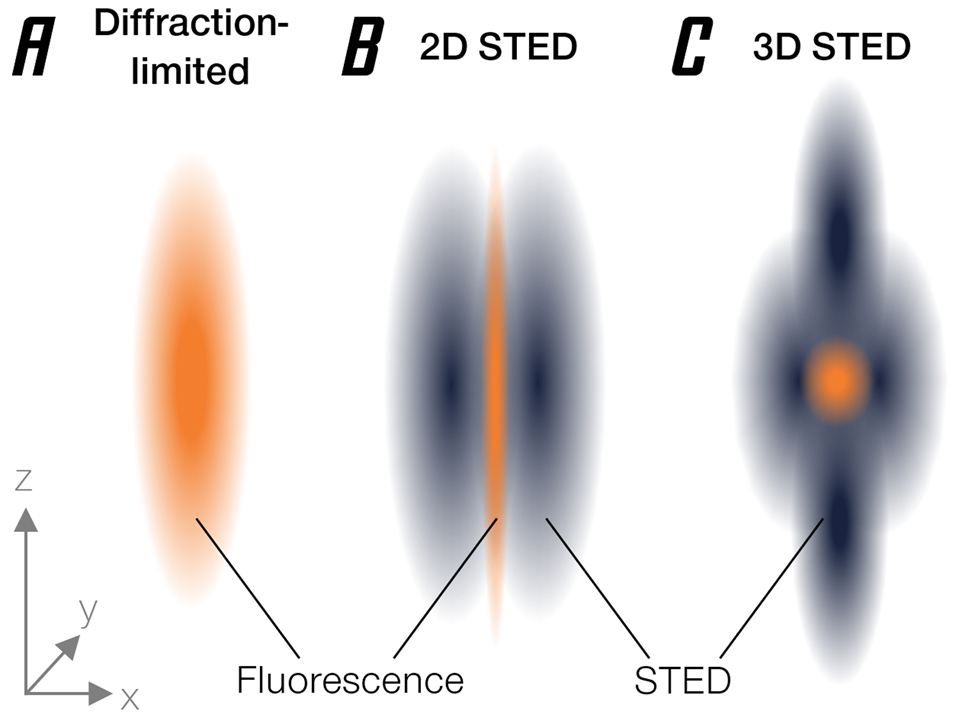
Figure 1: Narrowing of the effective emission area by stimulated emission depletion. (A) Diffraction-limited PSF. (B) Donut-shaped STED beam narrows PSF diameter. (C) 3D-STED enables axial super-resolution.
STED unlocks the direct imaging of structures much smaller than the diffraction limit and helps in the understanding of biological processes on a sub-cellular scale in a very direct, visual way. Because of this, it has grown into an essential tool in fields such as neurobiology [Reference Wang3], genomics [Reference Hilbert4], and virology [Reference Chojnacki and Eggeling5], to name a few.
All Tools Under a Single Roof
In the past decade, the focus of STED development has shifted from improving the approach itself to making it available for imaging of a wide range of samples from living cells to complex tissue samples. STED has now matured into a technically refined method. It not only overcomes the diffraction barrier in a proof-of-principle way, but integrates the complex demands of microscopic imaging as a basic research tool providing:
• A comprehensive imaging station with microscopes designed around a standard light microscope frame. Today's imaging systems offer everything from brightfield microscopy over state-of-the-art confocal laser scanning to super-resolution STED in one package. Existing light microscope setups can often be upgraded with packages such as the STEDYCON to provide a super-resolution microscope.
• Superior performance: At the same time, there should be no compromises on efficacy. Breakthrough discoveries require exceptional tools.
• Sample protection: Pulsed lasers are preferred as they significantly reduce the destructive effects of light on the sample [Reference Vicidomini6,Reference Castello7]. Intelligent adaptive illumination schemes apply laser light only and exactly when it is needed, thus avoiding unnecessary exposure.
• Extraordinary sensitivity: Avalanche photodiodes (APD) have the highest quantum efficiency on the market. Other detector types miss many of the photons that are emitted from the sample. High-sensitivity detectors mean faster acquisition especially of dim specimens and save the sample from unnecessary excitation [Reference Michalet8].
• Optics and fluorophores from a single vendor: In addition to pioneering hardware, fluorescent dyes and labeling solutions can be purchased from abberior. This means that all components of the imaging process are perfectly matched for the best results.
• Upgradeability: Considering the fast pace of the field, it makes sense to design modular microscopes that can be retrofitted with essential enhancements. This allows constant upgrades and access to new features, as opposed to frequently purchasing a new system.
This combination of deep knowledge in organic chemistry and optics (Figure 2), together with daily involvement in life science issues, has allowed STED to become a true multi-talent technique.

Figure 2: abberior's one-roof approach.
Super-resolution imaging has tremendous implications, and microscopes need to be multifunctional platforms that can be adapted to specific applications. The following sections will delve into three cases that require specific solutions to realize the full potential of STED (Figure 3).

Figure 3: Optimization of STED microscopy. These are further discussed in the text and subsequent figures by the use of three examples showing structural analysis, live-cell dynamics, and deep tissue imaging.
Focus Cases
Enhanced multi-color imaging and resolution improvement with time-resolved detection.
The first example highlights the impact of time-resolved detection on daily microscopy work. Basically, in-depth structural studies often require the use of multi-color imaging to visualize sample context and for analyzing spatial relationships and interactions. The ability to unambiguously sort multiple dyes into different detection channels is a major factor in experimental design and usually not a simple feat, especially in connection with super-resolution microscopy. Traditionally, this is achieved by selective activation of dyes with different excitation lasers followed by selective detection, where the emitted signal is separated based on spectral bands. Unfortunately, excitation and emission spectra are broad and hard to distinguish when growing in number, even with spectral unmixing. When using STED, more constraints are added because the dyes also must be sufficiently de-excitable at the available STED wavelengths. The use of long Stokes-shift dyes is a remedy; for example, STAR 460L in combination with STAR ORANGE and STAR RED, which allows for easy three-color imaging with a single 775 nm STED laser. But to fully lift the restrictions imposed by overlapping spectra, all of the fluorophores’ characteristics have to be used (Figure 4C).

Figure 4: Unlocking uncomplicated multi-color experiments with time-resolved detection. Four-color imaging showing nuclear pores (NUP968, STAR RED), Golgi membrane (GM130, STAR 635), Golgi medial rims (Giantin, STAR ORANGE), and actin (STAR 580 phalloidin) in fixed cells. (A) Confocal image without time-resolved detection shows only two colors due to limited separability illustrated in (C). (B) Detail of the orange (upper image) and red (lower image) detection channels with separation by lifetime illustrated in (D). (E) Final, fully separated image. Scale bars: (A) 5 μm, (B and E) 2 μm.
As an example, the dye combination STAR ORANGE, STAR 580, STAR RED, and STAR 635 consists of four of the best STED-dyes, yet they cannot be combined using strict spectral separation. Effectively, it would only yield a two-color image, since the spectra of STAR ORANGE and STAR 580, and STAR RED and STED 635, respectively, are too similar to be discriminated (Figure 4A). However, they can be separated using another characteristic measure of fluorescence: the lifetime of the excited state, measured by the time that passes between absorption and emission of a photon. Time-resolved detection is needed to record this information, and an easy and versatile implementation was recently released with TIMEBOW. Analyzing the temporal profile of the emission reveals a new dimension for detection (Figure 4D), where the dyes are now clearly separated. Thus, the inclusion of time-resolved detection expands the number of simultaneously resolvable channels (Figure 4B). The resulting multi-color super-resolution image (Figure 4E) demonstrates the ease of performing super-resolution experiments with four targets, all while using only one 775 nm STED laser.
The use of time-resolved detection also improves resolution for low STED powers, as with the intestinal epithelium microvilli in Caco-2 cells shown in Figure 5A. To understand how this works, note that the de-excitation effect of the STED beam can be viewed as a modulation of fluorescence lifetime. Since the intensity of the STED beam is not the same everywhere (the donut has a hole), this means that the lifetime is not the same everywhere, that is, measuring the lifetime reveals additional spatial information that can be used to increase the resolution [Reference Tortarolo9] (Figure 5D). Here, a MATRIX array detector was used additionally to clear up background. In short, the MATRIX uses multiple APDs to obtain not only a one-directional, but instead a comprehensive, multi-angle view of the sample, which enables the direct removal of out-of-focus signal and increases optical sectioning (Figure 5C).
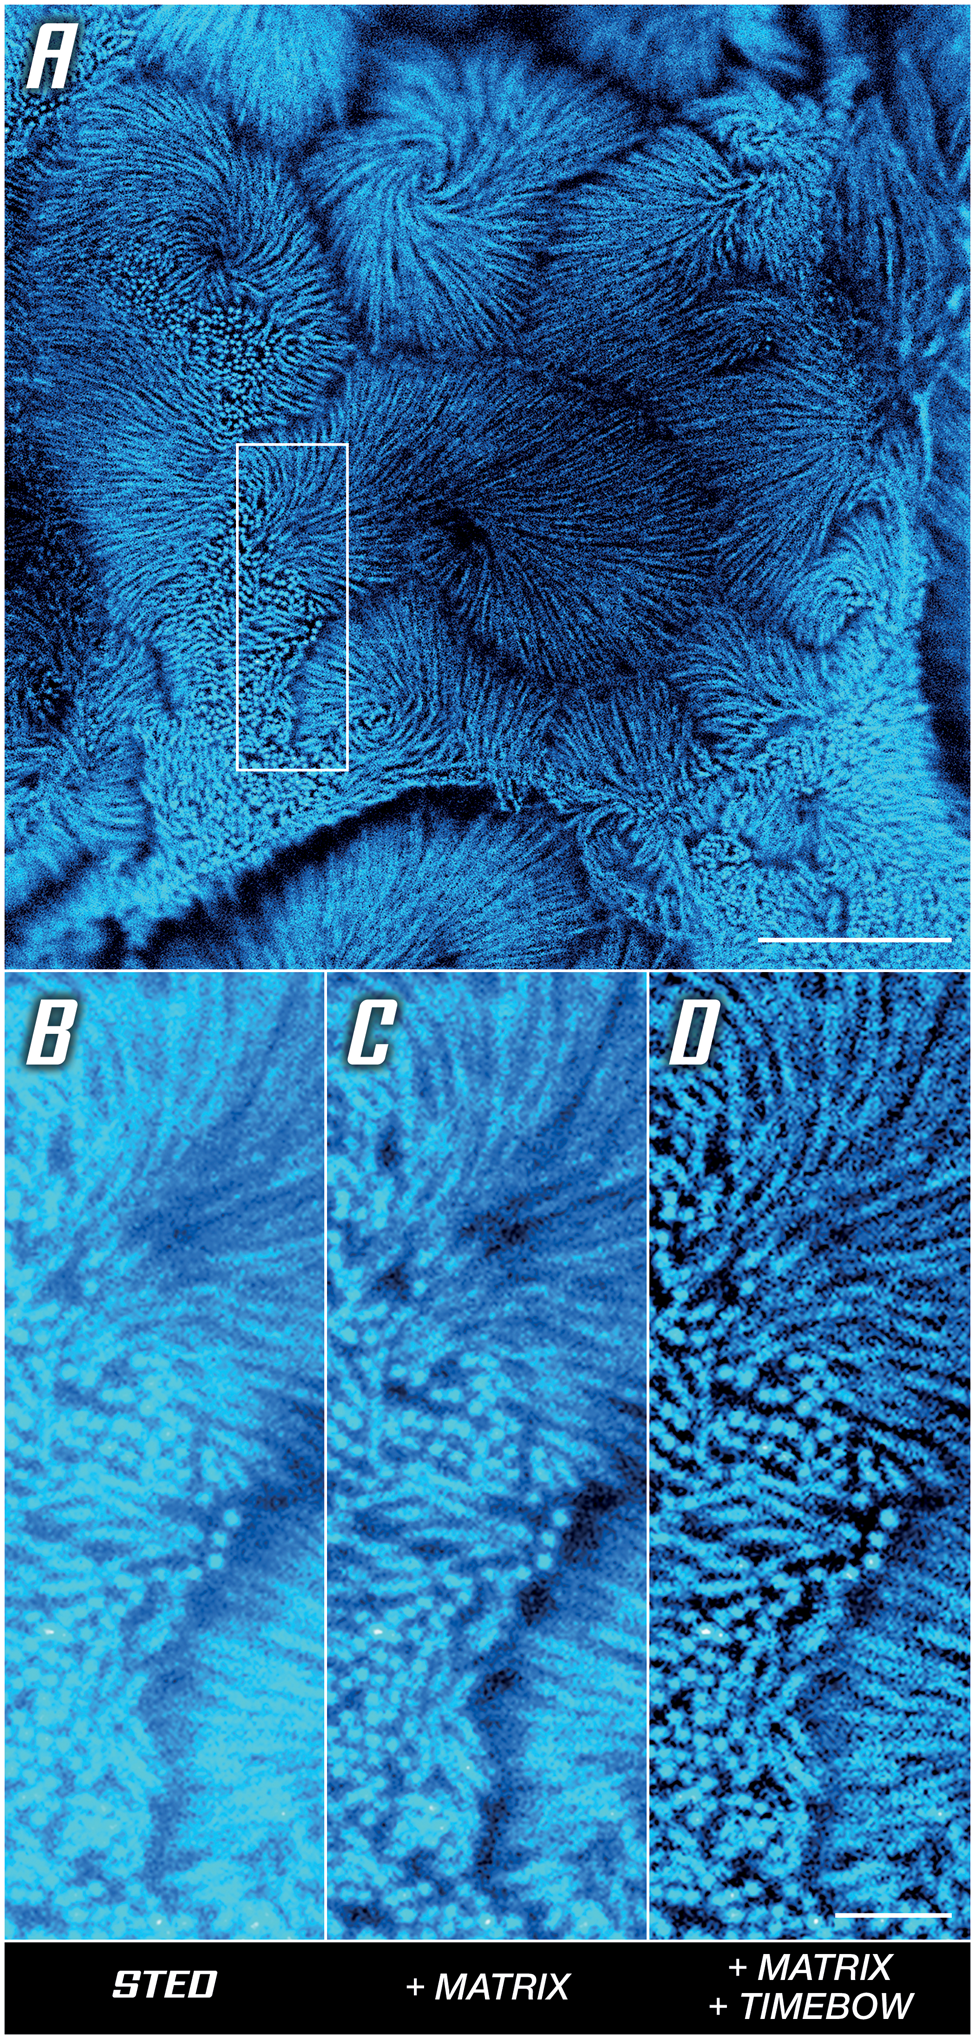
Figure 5: Unlocking sharp imaging in a low-signal high-background sample. Actin in microvilli of Caco-2 cells labelled with abberior STAR RED. (A) Overview image with boxed area compared below. (B) Base STED image. (C) Background reduction by differential detection. (D) Resolution improvement by rejecting outskirt photons, detail of (A). Scale bars: (A) 5 μm, (B–D) 1 μm. Sample provided by Professor Dorothee Günzel and Jörg Piontek (Charité, Berlin).
Low-power imaging of live-cell dynamics.
The ability to image living systems is probably the greatest advantage of light over electron microscopy, as it is the only way to capture detailed physiological processes and dynamics as they happen in their actual environment. The high resolution of STED microscopy provides direct access to subcellular organization and interaction [Reference Stockhammer and Bottanelli10]. To realize this potential, the entire process must be as non-invasive as possible. It requires labels able to reach their target without disrupting membrane structures, in addition to being bright, stable, and specific. An excellent example are abberior’s LIVE dyes—organic dyes with optimized chemical modifications, which make them membrane-permeable and useful already at very low concentrations [Reference Butkevich11–Reference Grimm14]. Depending on the residual group, they can be used either for direct labeling of DNA, actin, tubulin, or lysosomes, or attached to a fusion protein, for example a SNAP®-tag.
For imaging of a living specimen, it is imperative to minimize cellular stress reactions and phototoxic effects. What the microscope can do here is reduce the light dose by making the most of the photons involved, both going in (STED and excitation beams) and coming out (fluorescence) of the specimen. A proven strategy is to apply photons only where and when they are useful. This requires pulsed STED lasers, which arrive during the lifetime of the excited dye states instead of continuous-wave lasers that mostly come too late. It is equally important to adapt the illumination to where sample structures are, for example, by switching it off at exactly those scan positions that contain no labels (Figure 6A). Avoiding useless exposure, in combination with LIVE dyes, facilitates the recording of time series images in living cells. In a series imaging the outer mitochondrial membrane protein OMP25, no degradation of structures or signal quality was found after 50 consecutive frames (Figure 6C). Finally, maximizing detection efficiency with APDs, maximizing the signal-to-background ratio with array detectors like the MATRIX, and maximizing resolution by integrating lifetime information, high signal quality at low laser power settings is enabled (Figure 6B).
Figure 6: Unlocking gentle imaging in living cells. OMP25-SNAP expressed in HeLa cells labeled with abberior LIVE 610. Imaging in DMEMgfp-2 medium at room temperature. (A) RESCue imaging scheme consisting of three steps: confocal imaging, a pixel-wise decision to use or not use STED, and if the decision is made to use STED imaging. (B) Overview image taken before starting a time series in the marked area. (C) Every tenth frame of a time series spanning 50 frames. Scale bars: (A and C) 10 μm, (B) 20 μm.
All this becomes even more important in cases where multiple exposures are required, such as when imaging a volume or recording a time series. There are a range of decision algorithms available to choose from, known as RESCue [Reference Staudt15], DyMIN, and MINFIELD [Reference Heine16], depending on the requirements and the type of sample. A special case is guided STED, a realization of adaptive illumination developed for malaria research [Reference Schloetel17]. It avoids exposing highly reflective iron deposits that appear in late stages of the parasite's life cycle. Normally, these deposits limit imageability and cause phototoxicity, but avoiding these sensitive areas allows non-invasive imaging of these difficult samples.
Aberration-corrected deep tissue imaging with 3D-super-resolution microscopy.
Tissue imaging, like live-cell imaging, is a challenging application, not only because sample preparation is more difficult, but also from a technical point of view. After all, the sample is the last part in the optical train of the microscope, and it does make a large difference when light must travel through one hundred microns or more of optically irregular tissue before it is focused. Even when the sample itself is relatively homogeneous, there is usually a step-like change in refractive index (optical density) between the immersion medium and the sample. This results in spherical aberrations, which become worse for greater refractive index mismatches and with greater distance from the cover slip. For thin samples, one often gets away with using a water immersion lens for aqueous samples, but the resulting mismatch is too large for focusing deep inside a sample. When imaging with super-resolution, the situation becomes worse, since all available methods highly depend on clean light distribution in the focus plane. For example, trying to do STED microscopy with a distorted donut, where the central hole is partially filled, inevitably leads to loss of signal and resolution.
Since one cannot finely adapt the immersion and embedding media for each sample, room temperature, and focusing depth, the only solution is to pre-compensate the distorted wavefronts to counteract any deviations they pick up in the sample on their way to the focus plane [Reference Gould18,Reference Velasco19]. In astronomic telescopes, this has long been done with deformable mirrors that cancel atmospheric streak and turbulence, and the same is available for microscopy. A deformable mirror in the beam path effectively restores nearly perfect conditions in the focus plane as is clearly demonstrated by a drastically improved signal quality at increased imaging depth (Figure 7A). Especially when comparing to reference conditions, it becomes clear that for imaging depths of more than 40 μm, it is almost indispensable to apply a countermeasure against sample-induced distortions (Figure 7B). Once again, MATRIX detection can be applied additionally to reduce out-of-focus background (Figure 7B, right column).
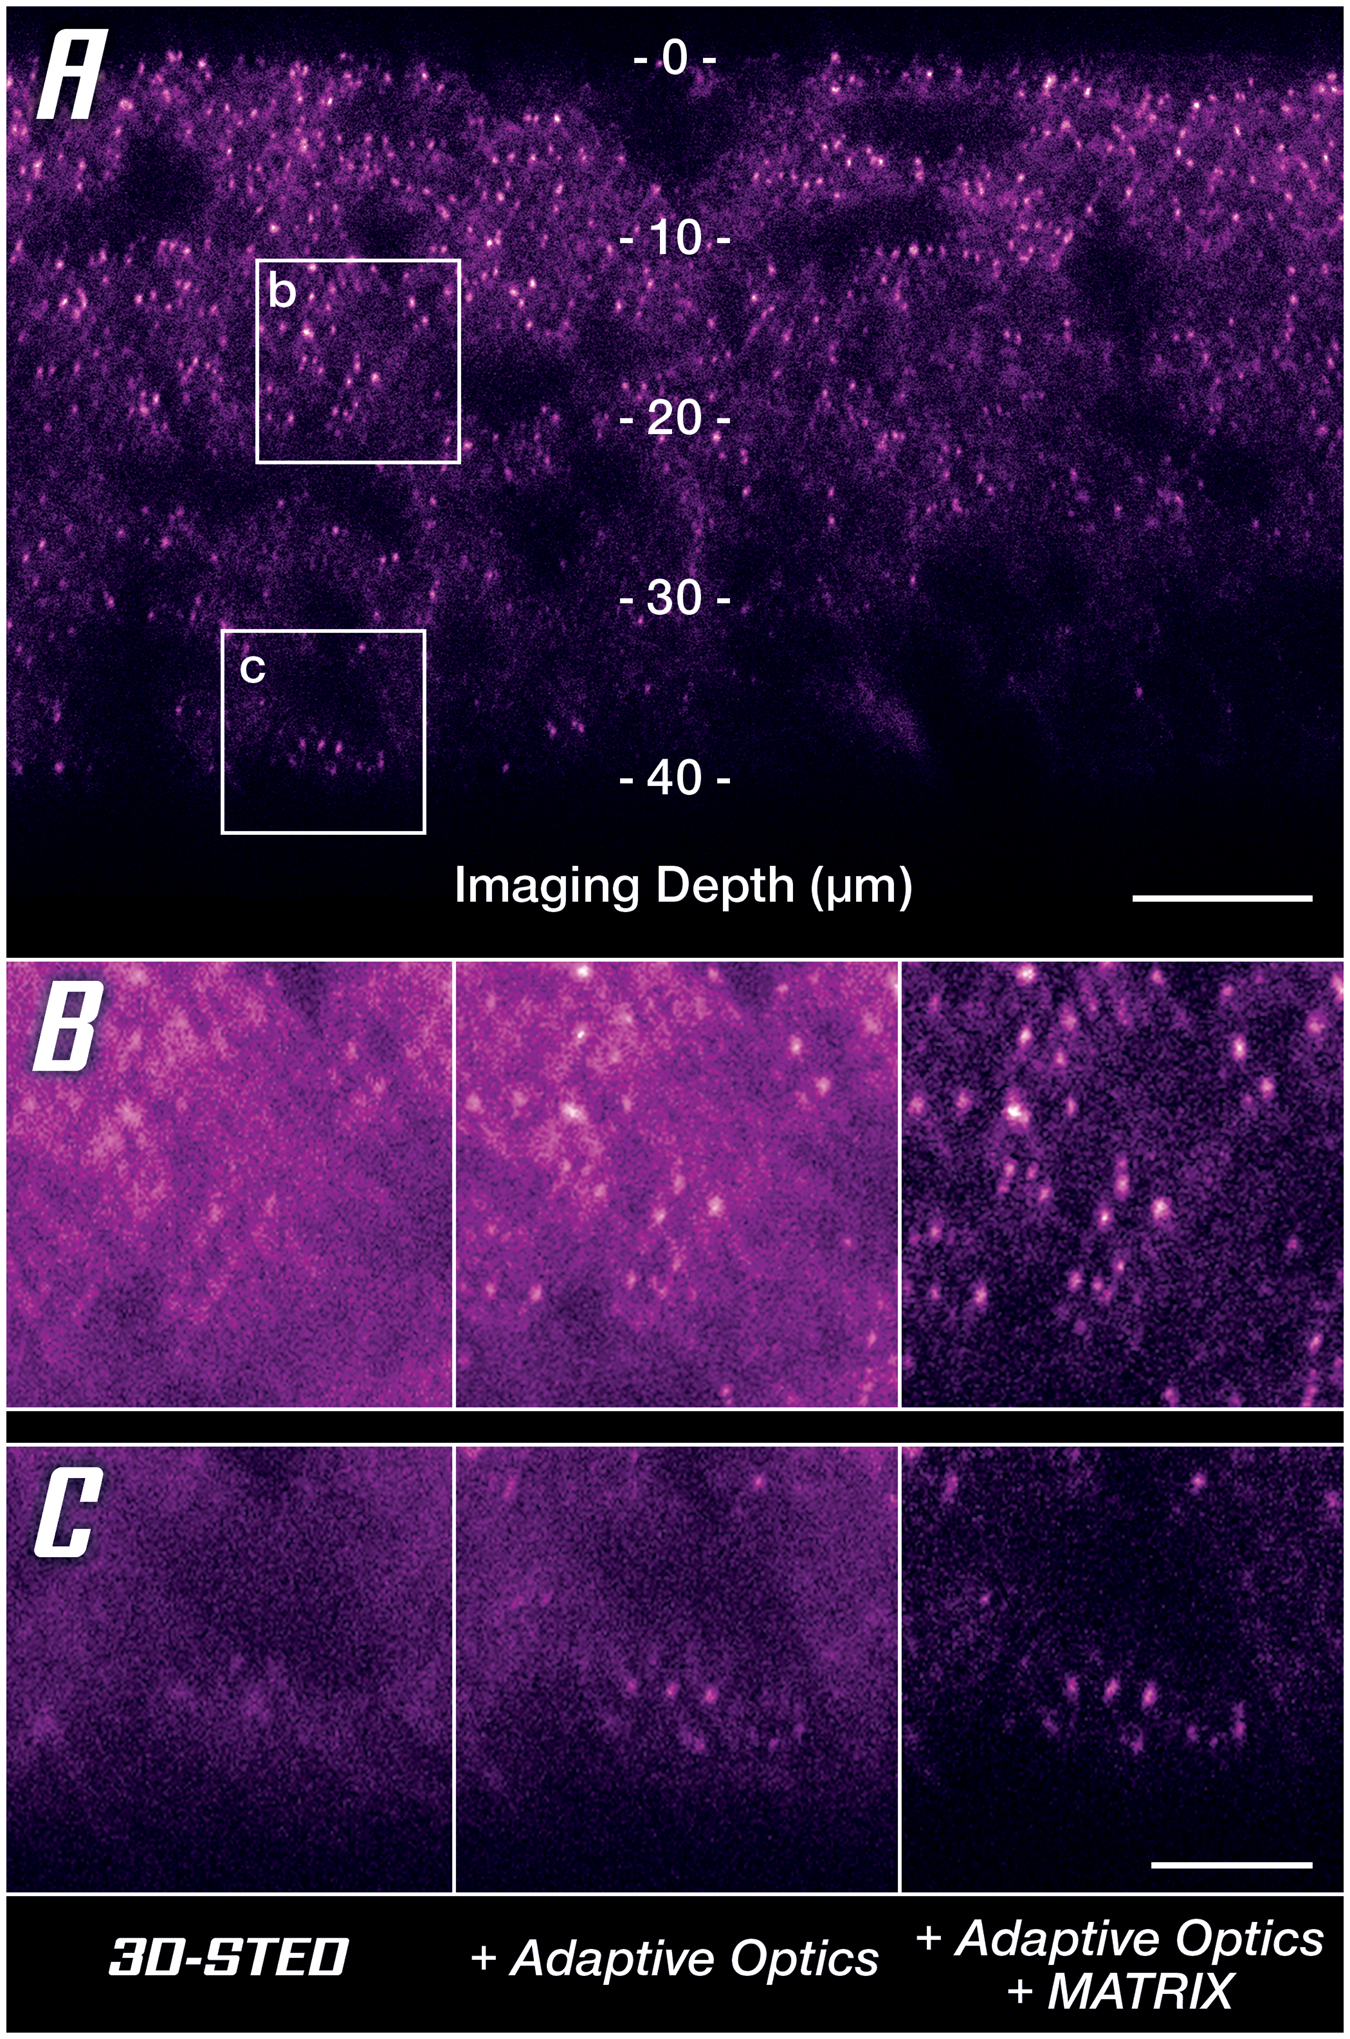
Figure 7: Unlocking super-resolution imaging in thick tissue samples. (A) 3D-STED overview image along the z-axis using MATRIX differential detection and Adaptive Optics. Areas at two depths (at 20 μm and 40 μm labeled b and c, respectively) are compared below. (B, C) Comparison between uncorrected 3D-STED and the addition of countermeasures to retrieve signal quality at 20 μm (B) and 40 μm (C) imaging depth. Scale bars: (A) 10 μm, (B and C) 2 μm. Sample provided by Abdelali Jalil, PhD (Saints Pères Paris Institut for Neuroscience, SPPIN, Paris) during a live demo at MiFoBio 2021.
Optimizing for Spatial Resolution with MINFLUX
With the techniques presented here, resolution in the double-digit nanometer range can be reached in most cases. Full maximization of the resolving power in STED can yield up to 20 nm resolution with good sample preparation and acquisition conditions. Research questions that require even higher resolution call for another method: MINFLUX, which achieves a new technical standard as it reaches spatial resolutions in the range of the size of a molecule and can be used to track emitters with tens of thousands of localizations and unprecedented speed [Reference Balzarotti20–Reference Eilers23].
It does this with a new imaging approach, which increases the information content of the collected photons. MINFLUX allows individual emitters to be located much more quickly and accurately, by finding the minimum of their intensity distribution instead of the maximum as with PALM/STORM. To this end, a donut-shaped excitation beam is placed in the vicinity of the emitter and slightly wiggled to find the position for which emission becomes minimal. When this is the case, the donut is exactly centered on the molecule, and since the position of the donut is known with great precision, so is the location of the molecule. Equally important, only a few photons are spent in this process. Commercial capabilities of MINFLUX systems are evolving at a fast pace and currently include two-color single-molecule imaging in all three dimensions. Dyes optimized for MINFLUX, such as the FLUX family from abberior, open new ways to characterize protein complexes and other organizational units of the cell on the nanometer scale.
Summary
In the past decade, super-resolution microscopy has developed into a mature field and is now readily available and easy to use. Nevertheless, the borders of what can be done are continually being pushed further. STED provides straightforward super-resolution imaging of delicate samples and deep into thick tissue, and MINFLUX delivers the ultimate spatial resolution of the size of a molecule. With these possibilities, it can be expected that new chapters will be opened in the investigation of even living sub-cellular machinery.


