11 An Alternative Look at the Middle to Upper Paleolithic Transition
In chapter 9, foraging theory provided the analytical framework for investigating alleged differences in the resource exploitation strategies of late Neandertals and early modern humans in Europe and southwest Asia. The examination of eight stratified assemblages from Saint-Césaire showed no significant change in diet breadth, although the samples attest to increased food stress during the Aurignacian. The many similarities observed between the assemblages from Saint-Césaire and those from Grotte du Renne and Abri Pataud are concordant with this conclusion, although limited data at these last two sites may indicate a modest increase in fox consumption during the Early Aurignacian.
In Chapter 10, a review of the literature revealed that transitional occupations in southwestern Germany are also associated with narrow diets. Conversely, diet breadth expansions during the earliest Upper Paleolithic were documented in various regions of the Mediterranean basin, particularly in habitats where large ungulates are naturally poorly represented. This last pattern is in agreement with the intensification model. However, the fact that some of these regions are separated by areas where narrow diets persisted well after the transition is difficult to reconcile with the hypothesis of a westward diffusion of a broad-based foraging system. Likewise, evidence for incipient diet broadening among some late Neandertal groups from Iberia, and possibly, Greece and Italy, is inconsistent with this model.
Diet breadth changed little during the transition in the western plains of Europe, despite evidence for a dramatic reduction in environmental carrying capacity, as inferred from a decline in mammal species diversity (Morin Reference Morin2008, see Chapter 3). Exploring the potential effects of these environmental changes on human demography is important, given that it may shed light on the origins of modern humans in Europe. Specifically, evidence presented in this chapter shows that human foragers became increasingly dependent on a very narrow range of highly cyclical resources – mainly reindeer – during the early Upper Paleolithic, a situation that would have negatively affected their population densities. However, before addressing the demographic implications of a narrow diet, we first need to investigate whether the inferred shift toward reindeer dominance was a general pattern in France.
How General was the Shift toward Reindeer Dominance in the Early Aurignacian?
In the plains of western France, final Mousterian and Châtelperronian assemblages generally contain a moderately wide range of ungulate taxa. With few exceptions, reindeer, bison, red deer, and horse account for the vast majority of the ungulate remains in these assemblages (Delpech Reference Delpech1983, 1996; Guadelli Reference Guadelli1987; David and Poulain Reference David, Poulain and Farizy1990; Mellars Reference Mellars1996, Reference Mellars, Akazawa, Aoki and Bar-Yosef1998; Armand in Debénath and Jelinek Reference Armand, Delagnes, Brugal, Meignen and Patou-Mathis1998; Grayson and Delpech Reference Grayson and Delpech2002, Reference Grayson and Delpech2008; Rendu Reference Rendu2007). A similar range of species is documented in comparably dated assemblages primarily accumulated by large carnivores (Guadelli et al.Reference Guadelli, Lenoir, Marambat, Paquereau and Otte1988; David Reference David2004; Beauval and Morin Reference Beauval, Morin, Buisson-Catil and Primault2010).
Patterns of taxonomic composition subsequently changed, as suggested by the strong dominance of reindeer in the Early Aurignacian assemblages of Abri Pataud (Bouchud Reference Bouchud and Movius1975; Sekhr Reference Sekhr1998) and Roc de Combe (Grayson and Delpech Reference Grayson and Delpech2008). This strong dominance of reindeer is also manifest in the Middle Aurignacian occupations at Saint-Césaire (Figure 11.1). But was the shift toward reindeer dominance during the Early Aurignacian general in western France, or was it limited to a few sites? To address this question, faunal trends were investigated in a moderately large sample of well-controlled assemblages.
The study of reindeer dominance presented here is geographically limited to assemblages deposited in karstic contexts in southwestern France, the Pyrenees excluded. Each of the time periods considered – the final Mousterian (ca. 40–45 ka), the Châtelperronian, and the Proto/Early Aurignacian – cover relatively short time spans, which should minimize temporal averaging. To reduce sampling error, the analysis only includes moderate- to large-sized assemblages (NISP > 200), irrespective of whether carnivores played a significant role in their accumulation or not. The fifteen assemblages that met all of these conditions are listed in Table 11.1. To simplify the analysis, the comparisons focused exclusively on red deer, bovines, reindeer, and horse. As indicated earlier, these four taxa largely dominate ungulate assemblages attributed to MIS 3 in the study region.
It should be noted that the transitional assemblages from Roc de Combe were included in the sample, despite the fact that they are affected by collection bias (Bordes Reference Bordes, Zilhão and d’Errico2003; Grayson and Delpech Reference Grayson and Delpech2008). This issue should be of minor concern in the present case because the criteria that guided the retrieval of the specimens at this site are unlikely to have varied significantly between ungulate species. However, the possibility that certain classes of small elements (e.g., sesamoids, carpals, tarsals, deciduous teeth) were less frequently collected for small- than for large-bodied ungulates at Roc de Combe cannot be excluded. Lastly, the sample also includes assemblages principally deposited by carnivores, because these may yield information about climatic change.
The degree of reindeer dominance in the assemblages was evaluated using a ternary diagram. This approach was preferred over a simple comparison of reindeer percentages because it permits the simultaneous comparison of three variables of potential significance. Three ungulate groups (reindeer, horse, and bovines/red deer), one for each axis of the diagram, were created for this purpose. NISP values for red deer and bovines were pooled in this analysis because they occupied habitats that were, in general, more temperate than those in which thrived horse and reindeer (Delpech 1983, Reference Delpech1996; Guadelli Reference Guadelli1987). This pooling is useful in the present case because it emphasizes climatic differences between the taxa, a variable central to the debate about reindeer dominance. The representation of ungulate groups in the ternary diagram was calculated according to the following equation:

where UGi is the ungulate group i and UGtotal the sum of all three ungulate groups (reindeer, horse, and bovines/red deer).
Results of the Reindeer Dominance Analysis
Figure 11.2 shows variations in the representation of reindeer, horse, and bison/red deer in the sample. There is a clear tendency in this figure for Proto/Early Aurignacian assemblages to be positioned near the apex and along the right boundary of the diagram. These areas, identified by light gray shading, are associated with reindeer dominance and reindeer-horse codominance, respectively. The absence of Proto/Early Aurignacian assemblages as one moves away from the right boundary of the diagram suggests that bovines and red deer were very rare during these time periods.
Conversely, final Mousterian and Châtelperronian assemblages tend to occupy the central part of the ternary diagram, regardless of the primary agent of deposition. This area, shown in dark gray in Figure 11.2, corresponds to assemblages with moderately high percentages of bovines and red deer. On the basis of these results, it can be concluded that the shift toward reindeer dominance during the Early Aurignacian at Grotte du Renne and Abri Pataud constitutes a reliable signal of a regional phenomenon. The next section assesses two hypotheses that have been put forward to explain these changes in taxonomic composition.
Revisiting Mellars's Reindeer Specialization Hypothesis
The shift toward reindeer dominance in the early phases of the Aurignacian has traditionally been attributed to climatic change (Bordes and Prat Reference Bordes and Prat1965; Beckouche Reference Beckouche, Champagne and Espitalié1981; Delpech Reference Delpech1983, Reference Delpech1996; Grayson and Delpech Reference Grayson and Delpech2002, Reference Grayson and Delpech2008; Morin Reference Morin2008). However, a minority view challenges this interpretation, holding instead that this shift “reflects a deliberate economic and logistical strategy on the part of the Upper Palaeolithic groups to concentrate specifically on the exploitation of reindeer resources at particular times and places within the Perigord landscape” (Mellars Reference Mellars2004:615). According to Mellars, this highly “specialized” foraging pattern – which he distinguishes from the “generalized” or “broad-spectrum” strategy of resource exploitation of Neandertals – was aimed at reducing competition:
If the Chatelperronian and Aurignacian groups were exploiting different resources then it is likely that they were utilizing to some extent different ranges within the same general territories. Thus the Aurignacians, for example, could have been exploiting predominantly seasonally migrating reindeer herds in the main river valleys of the Perigord (the Vézère, Dordogne, Isle, etc.) while the Chatelperronians were concentrating mainly on more widely dispersed and solitary species (e.g., horse or aurochs) on the intervening plateau and upland areas (Mellars Reference Mellars1989, 1992b). The same patterns could even be tied into more general seasonal contrasts in foraging patterns for these resources, which would have helped further to avoid any direct conflicts for the exploitation of specific resources at the same times and locations. (Mellars Reference Mellars, Akazawa, Aoki and Bar-Yosef1998:500)
It is essential to note that this view, which Mellars (Reference Mellars1989, Reference Mellars1996, Reference Mellars2004) has reiterated in a number of publications, attributes to Neandertals and early modern humans foraging patterns that are inverse of those suggested by O’Connell (2006) and Kuhn and Stiner (2006).
Because Mellars's specialization hypothesis downplays the importance of climatic change as an explanation for shifts in the taxonomic representation of reindeer during the transition, his arguments can be tested using paleoenvironmental proxy data (Grayson and Delpech Reference Grayson and Delpech2003, Reference Grayson and Delpech2008; Morin Reference Morin2008). However, discerning the respective influences of climatic and cultural factors on the composition of ungulate assemblages in the study region has been hindered by the difficulty of correlating anthropogenic faunal sequences with independent climatic data sets. Naturally accumulated micro-mammals can help resolve this issue because they are highly sensitive to variations in ecological conditions and often co-occur with ungulates in archaeological assemblages (Chaline Reference Chaline1970; Marquet Reference Marquet1993). At Saint-Césaire, a previous study comparing micro- and macro-mammals found little support for the reindeer specialization hypothesis (Morin Reference Morin2008).
To further explore this hypothesis, faunal trends at Saint-Césaire were compared with the Middle-to-Upper Paleolithic sequence of Roc de Combe in southwestern France. This site was selected because it is, with Saint-Césaire, one of the few sequences with a substantial data set on taxonomic representation of macro- and micro-mammals for the Middle to Upper Paleolithic transition. In addition, Roc de Combe provides data for the Early Aurignacian, a period that we now know to be unrepresented at Saint-Césaire. Comparisons between the two sites focused on three types of information: red deer/bovine representation and species diversity in micro- versus macro-mammals. The relevant faunal information for Roc de Combe was obtained from Grayson and Delpech (Reference Grayson and Delpech2008) and Marquet (Reference Marquet1993).
Species diversity was examined because it may produce valuable information about climatic change, given the tendency for the number of mammal species to decrease toward the poles (Lomolino et al. 2006; see also Chapter 3). Red deer/bovine representation was considered because it may, in the context of the Middle to Upper Paleolithic transition, signal more favorable climatic conditions. One should note that the strong representation of reindeer during the Aurignacian automatically entails low species diversity for this time period (Grayson and Delpech Reference Grayson and Delpech1998). However, the opposite is not necessarily true because reindeer-poor assemblages may also have low diversity if they are strongly dominated by another taxon, such as bovines or red deer.
The three variables of interest (i.e., micro-mammal species diversity, macro-mammal species diversity, red deer/bovine representation) show similar patterns of variation at Saint-Césaire and Roc de Combe, despite differences in the cultural composition of the two sequences (Figure 11.3). The Mousterian/Châtelperronian of Saint-Césaire deviates slightly from the trend, however, because this occupation contains fewer micro-mammal species than expected based on the abundance of macro-mammal species. Nonetheless, the data are consistent with the climatic hypothesis. Additional support for this hypothesis comes from Figure 11.4, which compares the relative abundances of two cold-adapted taxa: reindeer and the narrow-skulled vole, a control species accumulated by non-human agents. The two sequences are, again, in agreement, as they show comparable fluctuations in the representation of cold-adapted species. Overall, these results demonstrate that, during the transition, changes in the composition of ungulate assemblages were mostly, if not exclusively, driven by fluctuations in climatic conditions. These results appear to falsify the reindeer specialization hypothesis.
An observation of importance for the remainder of this chapter is that despite the many similarities observed between the sequences of Saint-Césaire and Roc de Combe, the narrow-skulled vole is always proportionately more abundant at the former site. For example, 93.0% (93/100, Morin Reference Morin2008:51, table 2) of the micro-mammal remains identified in the Evolved Aurignacian EJM occupation at Saint-Césaire belong to this taxon, versus only 17.3% (9/52, Marquet Reference Marquet1993:73, table 17) in the (possibly more recent?) Evolved Aurignacian layer 6 at Roc de Combe. This highly significant difference (ts = 10.22, p < .0001) contrasts with the similar percentages of reindeer in the same occupations (72.0% in EJM vs. 72.2% in layer 6, ts = 0.07, p < .95). These results suggest the existence of cooler climatic conditions at Saint-Césaire, possibly as a result of its more northerly position (≈180 km NW) relative to Roc de Combe. If real, this latitudinal effect was apparently too weak to have affected the representation of the larger taxa in a significant way.
The Relationship Between Human Density and Mammal Species Diversity
It is commonly assumed that human population densities increased in western Europe during the shift from the Middle to the Upper Paleolithic. This assertion is generally based on date or site/level counts. However, the reliability of this approach is controversial for the Paleolithic because it builds on a number of questionable assumptions about site production, residential mobility, sampling effort, the time span represented by the industries, their archaeological visibility, the accuracy of radiometric dates, the sedimentation rate, etc. A productive alternative is to focus on the relationship between hunter-gatherer density and mammal species diversity because these two variables appear to be linked in some direct or indirect way.
Morin (Reference Morin2008) found a moderately high and significant correlation (rs = 0.62, p < .002) between mammal species diversity and the historical population density of 27 Plains, Subarctic, and Arctic hunter-gatherer groups from North America. These groups were all characterized by an economy primarily based on hunting (>45% of subsistence activities, using the classification1 of Murdoch Reference Murdoch1981). To increase comparability with Late Pleistocene inland foragers, ethnographic groups that were heavily reliant on fish (>45% of the diet) were excluded from this correlation. The relationship between mammal species diversity and hunter-gatherer density appears to be robust given that the correlation is virtually identical (rs = 0.62, p < .02, n = 18) when the sample is restricted to groups with a diet that was more than 55% dependent on hunting (Figure 11.5). This result means that limiting the sample to groups with a greater reliance on hunting does not alter the relationship. However, at higher thresholds (e.g., 65%, 75%), the sample sizes are greatly reduced and, as a result, the correlations become non-significant.
A close inspection of Figure 11.5 shows that the data form not one but two linear relationships, as noted in a previous analysis (Morin Reference Morin2008). Groups that belong to the upper cluster in this figure tend to occupy cold open-country environments, whereas those associated with the lower cluster are found in temperate grasslands and northern forests. Both of these clusters show a very strong correlation between hunter-gatherer density and mammal species diversity, even though one of the relationships cannot be assessed properly because of its small sample size (upper cluster; rs = .70, p < .17, n = 5; lower cluster: rs = .91, p < .002, n = 13). The presence of two separate clusters in this figure means that species diversity does not explain all of the variation in the hunter-gatherer sample.
Yet given that the relationship remains strong when the two clusters are combined, it seems reasonable to conclude that, during the contact period in North America, areas with high species diversity supported, on average, greater densities of human foragers than regions with low numbers of species. Assuming that this relationship also held in the past, it might be possible to use mammal species diversity as a yardstick for predicting the direction (increasing or decreasing) of changes in human densities in Late Pleistocene Europe. However, before exploring its archaeological implications, we should consider an important question that this relationship raises: why do human foragers rarely thrive in environments with low mammal species diversity?
The most likely answer to this question is that low species diversity may not only decrease the overall long-term return rate of foraging but possibly also increase variation in game procurement. The fact that in ethnographic and historical accounts low productivity environments are more frequently associated with episodes of famines than high productivity environments – despite the very low human densities recorded in the former areas – brings support to this view (Keeley Reference Keeley1988). Variation in game procurement seems to have been particularly acute for foragers heavily dependent on Rangifer (Burch Reference Burch1972), as the first Aurignacians presumably were. It is now well documented that caribou and reindeer herds experience dramatic cycles of abundance with fluctuations sometimes approaching ratios of 1:200 within a few decades (Meldgaard Reference Meldgaard1986; Boudreau et al.Reference Boudreau, Payette, Morneau and Couturier2003; Gunn Reference Gunn2003; Valkenburg et al.Reference Valkenburg, Sellers, Squibb, Woolington, Aderman and Dale2003; Couturier et al.Reference Couturier, Jean, Otto and Rivard2004). These fluctuations, which seem to occur independently of hunting pressure, have been attributed to the interaction of several phenomena. Among various possible causal factors, poor grazing and adverse snow conditions are the most frequently cited (Aanes et al.Reference Aanes, Saether, Solberg, Aanes, Strand and Øritsland2003; Gunn Reference Gunn2003).
In low-diversity environments, the impact of the demographic crash of a Rangifer herd on human populations was often buffered by enlisting help from neighboring groups or by moving into a contiguous territory to exploit another herd (Minc Reference Minc1986; Whallon 2006). However, these strategies probably sporadically failed because Rangifer herds tend to crash synchronously at the regional level (Meldgaard Reference Meldgaard1986; Gunn Reference Gunn2003; Post and Forchhammer Reference Post and Forchhammer2006; Morin Reference Morin2008). A few decades ago, Burch (Reference Burch1972:356, original emphasis) emphasized the vulnerability of Rangifer-dependent economies to these abundance cycles:
The more restricted the temporal scope and geographic scope under consideration, the greater the likelihood that fluctuations will occur, the more often they are likely to occur, and the more extreme the fluctuations are likely to be. It is at the level of the individual herd that the dependability of caribou as a human resource is most questionable. Major fluctuations at this level inevitably impose severe limitations on human numbers and distributions in every locality in which caribou are a major basis of human subsistence. Since the range of a given herd can cover anywhere from tens to hundreds of thousands of square kilometers, fluctuations in a single herd might well affect a number of human populations. Given the current state of knowledge, it is not unreasonable to assume that human populations largely dependent upon caribou will be faced with a major resource crisis once at least every 2 or 3 generations.
These comments have important demographic ramifications. If Burch is correct, it can be hypothesized that heavy dependence on reindeer during the Proto/Early Aurignacian would have increased fluctuations of human densities in the western and northern plains. In addition, the correlation between mammal species diversity and historical forager densities suggest that the spectacular shift toward strong reindeer dominance during the Protoaurignacian was also associated with significant declines in human population densities, particularly in regions that lack substantial evidence for dietary intensification, such as France and Germany. The fact that archaeological sequences in Germany tend to show an abrupt break between the Middle Paleolithic and the Early Aurignacian may testify to the intensity of these declines in human densities (Conard and Bolus Reference Conard and Bolus2003). If accurate, these propositions would contradict most interpretations of demographic change during the Middle to Upper Paleolithic transition.
The issue now is to determine whether these inferred changes in human population dynamics were exceptional or the rule during the Middle and Upper Paleolithic. Broadening the temporal scope of the analysis to the entire Late Pleistocene should aid in elucidating this problem.
Environmental Carrying Capacity in Late Pleistocene France
To assess how change in environmental carrying capacity might have affected human densities over time, a composite time series spanning from the end of the Middle Pleistocene to the earliest stages of the Holocene (end of MIS 6–beginning of MIS 1) was assembled for southwestern France. The time series was created with the assistance of several lithic specialists using lithic assemblage composition to determine the chronological placement of the faunal sequences.2 Three variables – the percentage of reindeer, the diversity of ungulate species (as measured by the Reciprocal of Simpson's Index), and the percentage of cold-adapted micro-mammals – were examined in this series to identify fluctuations in environmental carrying capacity.
This composite time series represents a compromise between several constraints. As much as possible, efforts were made to i) use well-documented anthropogenic assemblages accumulated over roughly comparable time spans (this implies that assemblages were combined if deposition occurred over short periods of time); ii) control for variation due to geography by focusing on sites from a single homogeneous area (the Dordogne, the northwestern margin of the Lot, and the Poitou-Charentes); iii) limit the number of sites composing the series to reduce mismatches in sequence correlations; iv) keep sample sizes at an acceptable level, while minimizing temporal averaging; and v) eliminate gaps within the series by intercalating chronologically relevant assemblages.
Twelve archaeological sequences form the backbone of the time series. These sequences all originate from cliff base deposits, rockshelters or caves. The series first builds on the remarkably long and detailed stratigraphy of Combe-Grenal, which covers the end of MIS 6 and the interval from MIS 5b to the first half of MIS 3 (Bordes and Prat Reference Bordes and Prat1965; Bordes et al.Reference Bordes, Laville and Paquereau1966; Laquay Reference Laquay1981; Mellars Reference Mellars1986, Reference Mellars1996; Guadelli Reference Guadelli1987; Delpech and Prat Reference Delpech and Prat1995; Delpech Reference Delpech1996; this study). La Quina (station amont, Debénath and Jelinek 1998; Rendu Reference Rendu2007), Saint-Césaire, Les Cottés (Rendu Reference Rendu2009, pers. comm., 2011), Abri Pataud (Bouchud Reference Bouchud and Movius1975; Cho Reference Cho1998; Sekhr Reference Sekhr1998), Roc de Combe (Grayson and Delpech Reference Grayson and Delpech2008), and Le Flageolet I (Grayson and Delpech Reference Grayson and Delpech1998) provided assemblages for the second half of MIS 3 and the beginning of MIS 2. These assemblages are associated with industries spanning from the late Mousterian to the Final Gravettian. Finally, the Late Glacial and early Holocene occupations from Laugerie Haute Est (Delpech Reference Delpech1983), Le Taillis des Coteaux (Griggo Reference Griggo and Primault2009, pers. comm., 2011), Le Flageolet II, La Madeleine (Delpech Reference Delpech1983), and Bois-Ragot (Griggo Reference Griggo1995, Reference Griggo, Chollet and Dujardin2005) document faunal variation during the Solutrean, Badegoulian, Magdalenian, and Azilian periods. Appendix 15 summarizes the principal characteristics (cultural period, size of the faunal samples) of the ungulate and micro-mammal assemblages.
Geographic variation in the time series (n = 96 faunal assemblages) is limited given that most units (82/96 or 85.4%) are from sites found within a maximum distance of 50 km from each other. More distantly located sites include La Quina (max. dist. ≈120 km), Bois-Ragot (max. dist. ≈170 km), Saint-Césaire (max. dist. ≈170 km), le Taillis des Coteaux (max. dist. ≈180 km), and Les Cottés (≈210 km). The Gironde, the Lot-et-Garonne, and the “Causses” region are omitted from the present analysis because they differ from the Périgord and the Poitou-Charentes in terms of topography and/or the composition of ungulate communities. Importantly, the sequences were aligned relative to each other using only stratigraphic observations and the typo-technological characteristics of the lithic assemblages. This procedure should permit an objective assessment of patterns of faunal change during the Late Pleistocene.
Another point concerns the absolute chronology of the time series. TL dates were used in combination with lithic criteria to assess the age of the Mousterian occupations from La Quina (Debénath and Jelinek Reference Debénath and Jelinek1998) and Saint-Césaire (Mercier et al.Reference Mercier, Valladas, Joron, Reyss, Lévêque, Backer and Guilbaud1993). The task is more complicated at Combe-Grenal because this site lacks reliable radiometric dates (Guibert et al.Reference Guibert, Bechtel, Bourguignon, Brenet, Couchoud, Delagnes, Delpech, Detrain, Duttine, Folgado, Jaubert, Lahaye, Lenoir, Maureille, Texier, Turq, Vieillevigne, Villeneuve, Jaubert, Bordes and Ortega2008). Despite this difficulty, the chronology of Combe-Grenal is relatively well understood thanks to sedimentologic, lithic, and paleontological correlations with other archaeological sequences (Bordes and Prat Reference Bordes and Prat1965; Bordes et al.Reference Bordes, Laville and Paquereau1966, Reference Bordes and Bordes1972; Laquay Reference Laquay1981; Mellars Reference Mellars1986, Reference Mellars1996; Guadelli Reference Guadelli1987; Delpech and Prat Reference Delpech and Prat1995; Delpech Reference Delpech1996; Turq Reference Delpech, Grayson and Rigaud2000; Faivre Reference Faivre2008; Guibert et al.Reference Guibert, Bechtel, Bourguignon, Brenet, Couchoud, Delagnes, Delpech, Detrain, Duttine, Folgado, Jaubert, Lahaye, Lenoir, Maureille, Texier, Turq, Vieillevigne, Villeneuve, Jaubert, Bordes and Ortega2008). The chronology adopted here for this site differs only in minor details from these earlier studies, except for the earliest Late Pleistocene occupations (starting with layer 55), which are here placed in MIS 5b instead of MIS 5d/c, based on correlations with marine cores (discussed subsequently). However, because the chronology of Combe-Grenal cannot be anchored with absolute dates, the proposed correlations must be considered tentative.
The picture is very different for the Upper Paleolithic. In France, the age of the lithic industries attributed to this time period is particularly well constrained with hundreds of assemblages having been dated using the 14C method. Widely accepted time limits, as presented in recent syntheses (e.g., Zilhão and d’Errico Reference Zilhão, Aubry, Almeida and Sacchi1999; Zilhão et al.Reference Zilhão, Aubry, Almeida and Sacchi1999; Langlais Reference Langlais2008; Pesesse Reference Langlais2008), are followed here. The earliest Aurignacian is assumed to date to ≈37 ka, the earliest Gravettian to ≈28.5 ka, the earliest Solutrean to ≈21 ka, the earliest Badegoulian to ≈19 ka, and the earliest Magdalenian to ≈18 ka (dates are uncalibrated). This chronology is considered robust enough to allow the positioning of millennial climatic events within a relatively narrow range of stratigraphic units.
As mentioned earlier, the Combe-Grenal sequence is marked by a hiatus largely coinciding with MIS 5e–c. The rest of the series is thought to be roughly continuous, although minor gaps and misalignments may affect certain stratigraphic units. A related issue is the temporal resolution of the assemblages. The average time span of the stratigraphic units for each of the MIS represented in the series is estimated in Table 11.2. The estimates suggest that the chronological grain is approximately constant across the sequence (range: 0.8–0.9 ka per unit).
The ungulate samples composing the series vary widely in size, with NISP values ranging from 13 to 23,392. The vast majority (86/96 or 89.6%) of the assemblages encompass a minimum of 30 specimens identified at least to the genus level, with more than two-thirds of the samples (61/96 or 63.5%) containing a minimum of 100 identified specimens. However, the small samples (i.e., NISP < 100) are not randomly distributed within the series; most of them (29/35 or 82.9%) are from Combe-Grenal. The latter samples were not aggregated with stratigraphically adjacent assemblages because this procedure would have substantially reduced the temporal resolution of the Combe-Grenal sequence. Consequently, sampling error is more likely to influence faunal patterns in this portion of the time series. Nevertheless, the overall trends are believed to be representative of taxonomic changes in ungulate assemblages during the Late Pleistocene.
Species diversity and the percentage of reindeer were calculated relative to ungulates only. Carnivores were excluded from these calculations because of a general lack of data regarding the agents of accumulation for these taxa. Small-bodied animals (e.g., birds, leporids) were also ignored because they would have obscured comparisons between assemblages that pre- and postdated the Late Glacial shift toward broad diets. Moreover, selective recovery probably reduced the representation of these taxa at Combe-Grenal, Roc de Combe, and Laugerie Haute Est. As noted earlier, this problem is less significant for ungulates because their larger remains are more likely to have been collected, with the possible exception of small elements such as sesamoids and deciduous teeth. Lastly, because values for the Reciprocal of Simpson's Index can be affected by sample size (Magurran Reference Magurran2004), assemblages with less than ≈50 specimens were omitted from the calculation of species diversity.
To control for climate change, the percentage of cold-adapted micro-mammals (Male/root vole, narrow-skulled vole, and collared lemming) throughout the series was evaluated using data gathered by Marquet (Reference Marquet1993) and Oppliger (Reference Oppliger2008). Unfortunately, only a limited number of stratigraphic units (17/96 or 17.7%) contain substantial samples (total MNI ≥ 10) of micro-mammal specimens. Furthermore, the size of these samples tends to be very small, given that approximately two-thirds of them comprise less than 30 individuals. It should be noted that the data set excludes the micro-mammal samples from Saint-Césaire and Bois-Ragot (Marquet Reference Marquet1993) because these “northern” sites tend to show consistently higher percentages of cold-adapted micro-mammals relative to coeval samples from the Dordogne and Lot region (see discussion above on Roc de Combe).
To enlarge the data set, 12 additional archaeological assemblages comprising larger micro-mammal samples (Roc de Combe layers 8, 7, 4, and 1; Le Flageolet I layers V and IV; Cassegros layers 10 and 9; Combe-Saunière layers IV1-IV10; Moulin du Roc couche brune; and Pont d’Ambon layers 3 and 2) were tentatively correlated with units of the time series using lithic criteria. These additional micro-mammal samples are presented in Appendix 15. Although helpful, adding these samples to the data set has the drawback of raising the issue of possible misalignments. Obviously, this issue must be kept in mind when drawing conclusions about variations in the relative abundance of cold-adapted micro-mammals.
The Time Series
The assembled time series is presented in Figure 11.6. A first observation is that episodes of strong reindeer dominance (>80% of ungulate NISP) were rare, although not entirely lacking (discussed later), during the approximately 95,000-year period separating the end of MIS 6 (Combe-Grenal, layers 63–56) from the Protoaurignacian. Reindeer is virtually absent in the earliest Late Pleistocene levels from Combe-Grenal, and it can be safely assumed that this was also the case for the warm substages 5e–c that are not represented in the series.
In comparison, reindeer is moderately common in the later Mousterian (MIS 4 and the first half of MIS 3) where it sometimes accounts for as much as 50 to 60% of the ungulate specimens. Reindeer representation peaked at least twice during this last period. A first set of peaks, analyzed by Delpech (Reference Delpech1996), is recorded in the Quina occupations (layers 26–17) at Combe-Grenal. This set of peaks is distinct from a more recent peak in reindeer abundance recorded in layers 8–6, which are attributed to the Typical Mousterian.
Upper Paleolithic assemblages tend to depart from the Late Pleistocene Mousterian pattern, given that reindeer frequently comprises more than 80%, and sometimes 95%, of the ungulate remains. As noted by Mellars (1973, Reference Mellars1996, Reference Mellars2004) and Delpech (Reference Delpech1983, Reference Delpech1999), this last trend is particularly apparent during MIS 2. In essence, in contrast to the Late Pleistocene Mousterian, episodes of strong reindeer dominance were common during the Upper Paleolithic and the norm during the Late Glacial. However, as shown later, these generalizations are of limited use because they sometimes mask considerable variation in reindeer abundance within these time periods.
One of the most striking features of Figure 11.6 is the amplitude of the faunal changes during the early Upper Paleolithic. Indeed, this time period is associated with several spectacular oscillations in the relative abundance of reindeer in ungulate assemblages (range: 10.3–98.7%). Despite their importance, these dramatic variations have received very little attention in the literature (but see Delpech et al.Reference Delpech, Grayson and Rigaud2000 and Delpech and Texier 2007). Importantly, the early Upper Paleolithic is also characterized by marked fluctuations in species diversity, which suggests that, during this time period, assemblages that were strongly dominated by reindeer frequently gave way to assemblages containing a more even range of ungulate taxa, except for a short episode of red deer dominance during the Early Gravettian (Delpech and Texier 2007). However, additional samples will be needed to validate these inferences, given that some of the extreme fluctuations lie at the interface of separate sequences.
These temporal patterns characterize the time series. Yet because the grain of the series is relatively coarse, one cannot exclude the possibility that small gaps or time averaging muted the signal of certain events of short duration. Specifically, it is of interest to determine with greater certainty whether episodes of strong reindeer dominance (>80% of ungulate NISP) were rare during the Late Pleistocene Mousterian, as argued earlier. The issue is important given its possible demographic implications for human populations.
A review of the literature indicates that few ungulate assemblages3 are strongly dominated by reindeer during this otherwise well-documented period. These assemblages include Marillac layers 11–8 (80.0–90.9%, Costamagno et al.Reference Costamagno, Beauval, Lange-Badré, Vandermeersch, Mann and Maureille2008:381), Grotte Vaufrey layer I (82.9%, Delpech Reference Delpech1988:267–8), Chez Pinaud layers 24–9 (76.9–95.2%, Beauval Reference Beauval and Airvaux2004:126; Jaubert et al.Reference Jaubert, Hublin, McPherron, Soressi, Bordes, Claud, Cochard, Delagnes, Mallye, Michel, Niclot, Niven, Park, Rendu, Richards, Richter, Roussel, Steele, Texier, Thiébaut, Jaubert, Bordes and Ortega2008:216), Pech de l’Azé IV layers I1–G (82.5–93.4%, Laquay Reference Laquay1981:70–71), and La Quina layer 8 (90.0%, Armand in Debénath and Jelinek Reference Armand, Delagnes, Brugal, Meignen and Patou-Mathis1998:56). Excluding this last occupation, these assemblages are all attributed to the Quina facies (Delpech 1996; Jaubert et al.Reference Jaubert, Hublin, McPherron, Soressi, Bordes, Claud, Cochard, Delagnes, Mallye, Michel, Niclot, Niven, Park, Rendu, Richards, Richter, Roussel, Steele, Texier, Thiébaut, Jaubert, Bordes and Ortega2008; Turq et al.Reference Turq, Dibble, Faivre, Goldberg, McPherron, Sandgathe, Jaubert, Bordes and Ortega2008). Given this strong association, it is not unreasonable to conclude, as Delpech (Reference Delpech1996) did based on a smaller sample, that the majority of these assemblages were roughly contemporary with the reindeer-dominated Quina occupations of Combe-Grenal (layers 26–17).
Among the assemblages just listed, the ungulate assemblage from La Quina layer 8 constitutes an exception because it is not associated with the Quina facies. Yet this assemblage contains a high percentage of reindeer and presents many similarities with the reindeer peak documented in layers 8–6 at Combe-Grenal. One of these similarities relates to their stratigraphic relationships with well-described facies. In their respective sequences, only one or two layers separate the La Quina layer 8 and the Combe-Grenal layers 8–6 assemblages from an overlying series of Mousterian of Acheulean Tradition layers. Because this last facies is highly diagnostic and relatively well constrained in time (Delagnes et al.Reference Delagnes, Jaubert, Meignen, Vandermeersch and Maureille2007; Guibert et al.Reference Guibert, Bechtel, Bourguignon, Brenet, Couchoud, Delagnes, Delpech, Detrain, Duttine, Folgado, Jaubert, Lahaye, Lenoir, Maureille, Texier, Turq, Vieillevigne, Villeneuve, Jaubert, Bordes and Ortega2008), these stratigraphic observations may imply that these assemblages were approximately coeval.
However, this argument is complicated by the fact that the Combe-Grenal4 layers 7–6 have been ascribed to the Typical Mousterian (Bordes et al.Reference Bordes, Laville and Paquereau1966), while the La Quina layer 8 belongs to the Denticulate Mousterian (Park Reference Park2007). This inconsistency might be more apparent than real, given that both the Combe-Grenal layers 7–6 and the La Quina layer 8 occupations are rich in sidescrapers (Debénath and Jelinek Reference Debénath and Jelinek1998:47; Turq Reference Turq2000:282), a feature central to the definition of the Typical Mousterian (Bordes Reference Bordes1981b). Moreover, the preferential use of Levallois blanks for making sidescrapers is documented in both sets of assemblages (Turq Reference Turq2000:280–282; Park Reference Park2007:184). Further analysis of these levels is needed to establish whether these similarities are circumstantial or extend to other aspects of the lithic assemblages.
The time series indicates that episodes of strong reindeer dominance occurred with varying frequencies during the period corresponding to MIS 6–2. Can the emergence of these reindeer peaks be attributed mostly to climate change, as argued for the Middle to Upper Paleolithic transition? Despite the limitations of the samples, the micro-mammal data set assembled here suggests that climatic forcing was the principal mechanism influencing change in reindeer representation. This is demonstrated by a statistically significant correlation between the percentage of reindeer and the percentage of cold-adapted micro-mammals in the stratigraphic units in the time series (rs = .52, p < .01, n = 29, micro-mammal samples with MNI ≥ 10). The correlation between these variables becomes exceptionally strong when the data set is limited to micro-mammal samples with MNI ≥ 50 (rs = .94, p < .002, n = 12, Figure 11.7). The importance of climate as a causal factor driving taxonomic representation in the time series is further confirmed by a statistically significant relationship between species diversity values for ungulates and those for micro-mammals (rs = .66, p < .03, n = 12, micro-mammal samples with MNI ≥ 50). These correlations are notable because they imply that, during the Late Pleistocene, humans transported ungulate taxa to shelters in a way that closely tracked variations in the natural abundance of these species.
In sum, the time series and data taken from the literature point to the existence of only two episodes of strong reindeer dominance during the Late Pleistocene Mousterian. A first episode – or set of episodes – is associated with the Quina facies. Several lines of evidence, including trends in reindeer body size, indicate that this or these event(s) took place during MIS 4 (Delpech Reference Delpech1996). A second, apparently short-lived, episode of strong reindeer dominance occurred during MIS 3 just before the emergence of the Mousterian of Acheulean Tradition facies. Factors that possibly affected the temporal spacing of these reindeer peaks are discussed subsequently.
Reindeer Peaks and Millennial-Scale Climatic Events
The study of ice cores has led to the discovery of several climatic oscillations operating at the millennial scale during the last glacial period, including Dansgaard-Oeschger cycles (e.g., Dansgaard et al.Reference Dansgaard, Johnsen, Clausen, Dahl-Jensen, Gundestrup, Hammer, Hvidberg, Steffensen, Sveinbjörnsdottir, Jouzel and Bond1993; Grootes and Stuiver Reference Grootes and Stuiver1997). Dansgaard-Oeschger cycles are marked by warm interstadial (GIS, Greenland interstadial) and cold stadial (GS, Greenland stadial) phases. Climatic oscillations have also been detected in deep-sea cores from the North Atlantic region (Bond et al.Reference Bond, Heinrich, Broecker, Labeyrie, McManus, Andrews, Huon, Jantschik, Clasen, Simet, Tedesco, Klas, Bonani and Ivy1992, Reference Bond, Broecker, Johnsen, McManus, Labeyrie, Jouzel and Bonani1993; Broecker Reference Broecker1994; Bond and Lotti Reference Bond and Lotti1995; Chapman and Shackleton Reference Chapman and Shackleton1998; Voelker et al.Reference Voelker2002). Some of these oscillations, the so-called “Heinrich events,” were extremely cold and were caused by episodes of massive iceberg discharges into the North Atlantic region (e.g., Bond and Lotti Reference Bond and Lotti1995; Hemming Reference Hemming2004).
The Heinrich events caused a reduction of sea-surface temperatures, which would have fueled a southward migration of the oceanic thermal front toward the mid-latitudes of the North Atlantic (Paillard and Labeyrie Reference Paillard and Labeyrie1994; Cortijo et al.Reference Cortijo, Labeyrie, Vidal, Vautravers, Chapman, Duplessy, Elliot, Arnold, Turon and Auffret1997; Naughton et al. Reference Naughton, Sánchez Goñi, Kageyama, Bard, Duprat, Cortijo, Desprat, Malaizé, Joly, Rostek and Turon2009). Several climatic simulations have demonstrated that significant freshwater pulses into this region can decrease or stop thermohaline circulation (Hemming Reference Hemming2004; Timmermann et al.Reference Timmermann, An, Krebs and Goosse2005). Changes in thermohaline circulation would have inhibited the diffusion of comparatively warm and humid atmospheric conditions from the equatorial zone to the high latitudes of the North Atlantic and therefore would have affected vegetation in Europe. Vegetative change associated with Heinrich events is attested in marine sequences from the eastern North Atlantic and the Mediterranean regions (e.g., Sánchez Goñi et al. Reference Sánchez Goñi, Turon, Eynaud and Gendreau2000, Reference Sánchez Goñi, Landais, Fletcher, Naughton, Desprat and Duprat2008; Roucoux et al.Reference Roucoux, de Abreu, Shackleton and Tzedakis2005; Naughton et al. Reference Naughton, Sánchez Goñi, Kageyama, Bard, Duprat, Cortijo, Desprat, Malaizé, Joly, Rostek and Turon2009; Fletcher et al.Reference Fletcher, Sánchez Goñi, Allen, Cheddadi, Combourieu-Nebout, Huntley, Lawson, Londeix, Magri, Margari, Muller, Naughton, Novenko, Roucoux and Tzedakis2010).
The amplitude of these oscillations means that climatic variations have been significantly underestimated in previous reconstructions of continental environments. This problem has been attributed to insufficient chronological resolution, the use of a small number of indirect climatic proxies from often-distant geographic regions, and erroneous assumptions about the response of vegetation to rapid climatic change:
Our record from Monticchio [a lacustrine sequence in Italy] demonstrates the capability of late Quaternary lake sediments to provide sensitive, high-resolution records of rapid (centennial-millennial) environmental fluctuations comparable to those obtained from ice cores. It also reveals that the biosphere was a full participant in these rapid fluctuations, contrary to widely held views that vegetation is unable to change with such rapidity. (Allen et al.Reference Allen, Brandt, Brauer, Hubberten, Huntley, Keller, Kraml, Mackensen, Mingram, Negendank, Nowaczyk, Oberhänsli, Watts, Wulf and Zolitschka1999:743)
While several periods of high primary productivity are seen at Les Echets between c. 36.2 and 28 kyr BP, only two interstadial events, Hengelo and Denekamp, have been recognized in pollen-stratigraphic records from central and northwest Europe for the same time interval (Behre 1989; Allen and Huntley 2000; Caspers and Freund 2001; Guiter et al. 2003; Müller et al. 2003; Preusser 2004). The high-resolution geochemical and chronological record for core EC1 indicates that these terrestrial interstadials were not individual events, but may contain several events with alternating interstadial and stadial conditions, partly explaining the discrepancies in the dating (Behre 1989; Caspers and Freund 2001) and environmental reconstructions (Guiter et al. 2003) for these events. (Veres et al.Reference Veres, Lallier-Vergès, Wohlfarth, Lacourse, Kéravis, Björck, Preusser, Andrieu-Ponel and Ampel2008:240)
In archaeology, similar problems have limited the accuracy of models assessing the impact of climate change on the composition of ungulate assemblages. The resolution of the present time series should allow an examination of correlations between the relative abundance of reindeer and climatic cycles at the millennial to orbital (glacial/interglacial) scale. At the millennial scale, Heinrich events are central to the discussion, given that they may have decreased global temperatures by several degrees Celsius (Broecker Reference Broecker1994; Chapman et al.Reference Chapman and Shackleton1998; Sachs and Anderson Reference Sachs and Anderson2005; Maslin Reference Maslin and Gornitz2009). Because Heinrich events are considered to have had stronger effects on the eastern than on the western North Atlantic (Seidov Reference Seidov and Gornitz2009), these cold episodes might have been involved in the formation of the strong reindeer peaks documented in the time series.
This hypothesis was evaluated by comparing the time series with data derived from the DSDP-609 core in the North Atlantic (Bond et al.Reference Bond, Heinrich, Broecker, Labeyrie, McManus, Andrews, Huon, Jantschik, Clasen, Simet, Tedesco, Klas, Bonani and Ivy1992, Reference Bond, Broecker, Johnsen, McManus, Labeyrie, Jouzel and Bonani1993; Bond and Lotti Reference Bond and Lotti1995; Allen et al.Reference Allen, Brandt, Brauer, Hubberten, Huntley, Keller, Kraml, Mackensen, Mingram, Negendank, Nowaczyk, Oberhänsli, Watts, Wulf and Zolitschka1999) and the twin MD95–2042 and SU81–18 cores on the western Iberian margin (Sánchez Goñi et al.Reference Sánchez Goñi, Landais, Fletcher, Naughton, Desprat and Duprat2008). Three climatic proxies were considered in these comparisons: i) the relative abundance of Neogloboquadrina pachyderma (left coiling), a planktic (planktonic) foraminifer indicative of cold water conditions (Bond et al.Reference Bond, Heinrich, Broecker, Labeyrie, McManus, Andrews, Huon, Jantschik, Clasen, Simet, Tedesco, Klas, Bonani and Ivy1992); ii) the concentration of ice-rafted debris, which reflects episodes of icebergs reaching the Iberian margin; and iii) planktic δ18O, an indirect indicator of sea-surface temperatures. These proxies were compared with the high-resolution GISP2 timescale from Greenland (Dansgaard et al.Reference Dansgaard, Johnsen, Clausen, Dahl-Jensen, Gundestrup, Hammer, Hvidberg, Steffensen, Sveinbjörnsdottir, Jouzel and Bond1993; Blunier and Brook Reference Blunier and Brook2001), which is used here as a reference.
The sequences are compared in Figure 11.8. The general shape of the reindeer curve is very similar to that of the N. pachyderma and planktic δ18O curves, which confirms that the taxonomic representation of the former taxon was strongly influenced by climatic oscillations during the last glacial period. Correlations with Heinrich events H7–H1 point to a relationship between the episodes of strong reindeer dominance and millennial-scale cycles. Although there are some uncertainties concerning the exact position of the earliest events – particularly H7 – the interpolations link the reindeer peak in the recent Quina occupations of Combe-Grenal with H6, whereas the peak in the Typical Mousterian layers 8–6 appears to have been coeval with H5.
The placement of H4–H1 is better constrained because these events fall within the effective range of the radiocarbon method. The correlations indicate that H4 occurred during the Proto/Early Aurignacian. This is congruent with the associated 14C dates for this event (Table 11.3) and with the proposed stratigraphic position of the Laschamp excursion, an episode of change in the earth's magnetic field that slightly pre-dated H4, which has been documented in several archaeological sequences from Central and Eastern Europe (Fedele et al.Reference Fedele, Giaccio and Hajdas2008; Hoffecker et al.Reference Hoffecker, Holliday, Anikovich, Sinitsyn, Popov, Lisitsyn, Levkovskaya, Pospelova, Forman and Giaccio2008). Lastly, the H3, H2, and H1 events would have been contemporary with the Early Gravettian, Late Gravettian, and Middle Magdalenian, respectively.
In general, correlations with marine and ice core data suggest that the relative frequency with which ungulate species were transported to cave sites in southwestern France was directly or indirectly influenced by climatic fluctuations operating at the millennial to orbital scale. Yet it should be noted that these observations, which reinforce conclusions made earlier using micro-mammal samples, do not mean that ungulate species were procured in proportions that exactly match their natural abundances in the landscape. As argued in Chapter 3, a perfect match with natural proportions seems unlikely because some taxa were probably more difficult to locate or obtain than others due to differences in speed, strength, social behavior, and other factors. In addition, certain aspects of the correlations will require further analysis. For instance, it will be important in future work to determine what caused the reindeer peak recorded in the time series between H4 and H3.
The early Upper Paleolithic “Anomaly”
Correlations with several climatic proxies suggest that, in the study area, episodes of strong reindeer dominance were coeval with Heinrich events. This result is concordant with the current consensus in paleoclimatology that Heinrich events “coincided with the coldest periods of the last ice age” (Sachs and Anderson Reference Sachs and Anderson2005:1118). However, for human populations, the short episodes of dramatic warming that generally terminated the Heinrich events may have been as important as the severe cooling episodes:
Late Pleistocene Heinrich events…in the North Atlantic are identified by distinct ice-rafted-detritus (IRD) layers primarily derived from the Laurentide Ice Sheet…Eight such events coincided with the coldest, stadial phase of some Dansgaard-Oeschger (D/O) events in Greenland ice cores over the past ∼65,000 years. D/O events typically start with an abrupt 9 to 15°C…warming over a few decades or less, followed by gradual cooling over several millennia. (Rashid and Boyle Reference Rashid and Boyle2007:439)
The climate of the last glacial period was characterised by strong atmospheric temperature oscillations. Over a few years high latitude air temperatures could increase with more than 12 °C. However, the warmings were short and immediately followed by a stepwise return to cold conditions. The fluctuations are recorded in the Greenland ice core records (Dansgaard et al.,Reference Dansgaard, Johnsen, Clausen, Dahl-Jensen, Gundestrup, Hammer, Hvidberg, Steffensen, Sveinbjörnsdottir, Jouzel and Bond1993), and they are generally known as Dansgaard-Oeschger events. (Rasmussen and Thomsen Reference Rasmussen and Thomsen2004:101)
The impact of Dansgaard-Oeschger events has rarely been assessed in the archaeological record. In the time series, these warming events were probably involved in the sometimes strong resurgence of temperate species after Heinrich events (e.g., the, respectively, bovine- and red deer-dominated samples from stratigraphic units 71 and 78). Yet because the severity, duration, and pacing of Dansgaard-Oeschger and Heinrich events show some variation (Dansgaard et al.Reference Dansgaard, Johnsen, Clausen, Dahl-Jensen, Gundestrup, Hammer, Hvidberg, Steffensen, Sveinbjörnsdottir, Jouzel and Bond1993; Hemming Reference Hemming2004; Ahn and Brook Reference Ahn and Brook2008), the impact of these oscillations on ungulate communities might have varied as well. This problem was evaluated within the time series by examining percent change in reindeer representation. These values were obtained by subtracting the percentage of reindeer in a layer from the corresponding percentage in the underlying layer (the numbers are presented as absolute values, that is, without regard to the direction of change). This can mathematically be expressed as follows:

where x is a layer and y the layer that precedes it stratigraphically. The same equation was used to assess change in species diversity values between adjacent layers. As noted earlier, because diversity measures are particularly sensitive to sample size, assemblages with less than ≈50 specimens were excluded from the analysis. Unfortunately, this removes several data points from the Combe-Grenal sequence.
As shown in Figure 11.9, the extreme variations in reindeer representation and species diversity during the early Upper Paleolithic are somewhat anomalous and stand in sharp contrast to the more uniform values seen in the Mousterian and the later Upper Paleolithic. These trends suggest that the early Upper Paleolithic occupants of western France faced unusually high-amplitude cycles of faunal change marked by shifts from cold and species-poor to temperate and species-rich ungulate communities. The demographic implications of these changes will now be considered.
Demographic and Genetic Implications
Given the relationship between species diversity, economic dependence on reindeer, and historical hunter-gatherer densities (discussed earlier), the high-amplitude variations in ungulate communities observed during the early Upper Paleolithic likely had a marked impact on the demography of human populations. In western Europe, the Heinrich events probably substantially reduced environmental carrying capacity and caused concomitant declines in human densities. The effects of these cold episodes on human groups would have been particularly severe during H4 (Figure 11.10a), one of the harshest, if not the harshest, of the Heinrich events (Hemming Reference Hemming2004). The Dansgaard-Oeschger event that terminated this Heinrich event presumably had the opposite results: it would have increased environmental carrying capacity and coincidentally fostered marked rebounds in human densities (Figure 11.10b). This demographic cycle would have been repeated at least three times during the early Upper Paleolithic, as suggested by the time series (Figure 11.10c–f).
Another phenomenon requires attention in this discussion. Approximately at the time of the onset of H4, a massive volcanic eruption occurred north of the Bay of Naples (Phlegrean Fields, southern Italy), spreading ashes across the northeastern Mediterranean, the Balkans, and much of Eastern Europe (Fedele et al.Reference Fedele, Giaccio and Hajdas2008). This event, named the Campanian Ignimbrite (Y5) eruption, is significant because it was one of the largest eruptions of the late Quaternary (Self Reference Self2006). As pointed out by Zilhão (Reference Zilhão2006) and Fedele et al. (2008), this volcanic episode likely affected the local populations, perhaps by decreasing human densities. Although its overall effects on human genetic diversity might have been relatively limited, this eruption probably temporarily enhanced population subdivisions in Eastern Europe during the early phase of H4.
The data collected for southwestern France imply that the early Upper Paleolithic was characterized by a rapid succession of bottlenecks in human populations. These conditions likely favored micro- and macro-evolutionary change among the last Neandertals. The bottleneck events possibly contributed to reduce genetic diversity, and the subsequent episodes of demographic growth might have facilitated the spread of new adaptive features via the recolonization of habitats, including the northern plains. These issues are of interest because it has been pointed out that genetic drift may explain why mtDNA sequences from modern humans lack evidence for gene flow with Neandertals (Nordborg Reference Nordborg1998; Cox and Hammer Reference Cox and Hammer2010). Indeed, appreciable admixture might have occurred between the two groups, but unless the Neandertal contribution was high, random loss through genetic drift might have eliminated any evidence for it (Figure 11.11).
Indirect support for these propositions comes from the mtDNA sequence of the ≈5,200 year-old Tyrolean “iceman,” a naturally mummified corpse found on a glacier in the Alps near the Austro-Italian border. The analysis of this mummy led to the identification of a subhaplogroup (K1) that probably occurred in this population. Yet this subhaplogroup is unknown in current European populations, which may indicate that drift eliminated or nearly eliminated it (Ermini et al.Reference Ermini, Olivieri, Rizzi, Corti, Bonnal, Soares, Luciani, Marota, de Bellis, Richards and Rollo2008). These observations are consistent with other analyses that have concluded that the role of drift may be an important factor explaining genetic variation in ancient populations, including archaic sapiens (Orlando et al.Reference Orlando, Darlu, Toussaint, Bonjean, Otte and Hänni2006; Reich et al.Reference Reich, Green, Kircher, Krause, Patterson, Durand, Viola, Briggs, Stenzel, Johnson, Maricic, Good, Marques-Bonet, Alkan, Fu, Mallick, Li, Meyer, Eichler, Stoneking, Richards, Talamo, Shunkov, Derevianko, Hublin, Kelso, Slatkin and Paabo2010).
More generally, the severe contraction of the human niche in France during the beginning of the Aurignacian that has been argued for here conflicts with the conventional wisdom that early modern humans dispersed through western Europe during this period. This last view has received wide support from genetics, given that most molecular studies perceive a signal of an out-of-Africa population expansion around 50 ka (Tishkoff et al.Reference Tishkoff, Dietzsch, Speed, Pakstis, Kidd, Cheung, Bonné-Tamir, Santachiara-Benerecetti, Moral, Krings, Pääbo, Watson, Ritsch, Jenkins and Kidd1996; Excoffier Reference Excoffier2002; Serre et al.Reference Serre, Langaney, Chech, Teschler-Nicola, Paunovic, Mennecier, Hofreiter, Possnert and Pääbo2004; Ramachandran et al. 2005; Noonan et al.Reference Noonan, Coop, Kudaravalli, Smith, Krause, Alessi, Chen, Platt, Pääbo, Pritchard and Rubin2006; Tishkoff and Gonder Reference Tishkoff, Gonder and Crawford2007; Li et al.Reference Li, Absher, Tang, Southwick, Casto, Ramachandran, Cann, Barsh, Feldman, Cavalli-Sforza and Myers2008; DeGiorgio et al.Reference DeGiorgio, Jakobsson and Rosenberg2009; Shi et al.Reference Shi, Ayub, Vermeulen, Shao, Zuniga, van der Gaag, de Knijff, Kayser, Xue and Tyler-Smith2009; Xing et al.Reference Xing, Watkins, Shlien, Walker, Huff, Witherspoon, Zhang, Simonson, Weiss, Schiffman, Malkin, Woodward and Jorde2010). Although several anthropologists have interpreted this signal as indicating the replacement of one human species by another (e.g., Stringer and Andrews Reference Stringer and Andrews1988; Mellars Reference Mellars, Akazawa, Aoki and Bar-Yosef1998; Bar-Yosef Reference Bar-Yosef2002; Klein Reference Klein2003, Reference Klein2008), growing evidence for episodes of gene flow between archaic sapiens and early modern humans indicates that this scenario requires modifications (Harris and Hey Reference Harris and Hey1999; Templeton Reference Templeton2002; Yu et al. 2002b; Zietkiewicz et al.Reference Zietkiewicz, Yotova, Gehl, Wambach, Arrieta, Batzer, Cole, Hechtmann, Kaplan, Modiano, Moisan, Michalski and Labuda2003; Garrigan et al.Reference Garrigan, Mobasher, Kigan, Wilder and Hammer2005; Plagnol and Wall Reference Plagnol and Wall2006; Wall et al. Reference Wall, Cox, Mendez, Woerner, Severson and Hammer2008; Cox et al.Reference Cox, Morales, Woerner, Sozanski, Wall and Hammer2009; Green et al.Reference Green, Krause, Briggs, Maricic, Stenzel, Kircher, Patterson, Li, Zhai, Fritz, Hansen, Durand, Malaspinas, Jensen, Marques-Bonet, Alkan, Prüfer, Meyer, Burbano, Good, Schultz, Aximu-Petri, Butthof, Höber, Höffner, Siegemund, Weihmann, Nusbaum, Lander, Russ, Novod, Affourtit, Egholm, Verna, Rudan, Brajkovic, Kucan, Gusic, Doronichev, Golovanova, Lalueza-Fox, de la Rasilla, Fortea, Rosas, Schmitz, Johnson, Eichler, Falush, Birney, Mullikin, Slatkin, Nielsen, Kelso, Lachmann, Reich and Pääbo2010; Reich et al.Reference Reich, Green, Kircher, Krause, Patterson, Durand, Viola, Briggs, Stenzel, Johnson, Maricic, Good, Marques-Bonet, Alkan, Fu, Mallick, Li, Meyer, Eichler, Stoneking, Richards, Talamo, Shunkov, Derevianko, Hublin, Kelso, Slatkin and Paabo2010).
Overall, the faunal record of western Europe suggests that Neandertals and early modern humans shared a similar range of foraging behaviors. These similarities also seem to extend to the symbolic realm (Zilhão et al.Reference Zilhão, Angelucci, Badal-García, d’Errico, Daniel, Dayet, Douka, Higham, Martínez-Sánchez, Montes-Bernárdez, Murcia-Mascarós, Pérez-Sirvent, Roldán-García, Vanhaeren, Villaverde, Wood and Zapata2010; Peresani et al.Reference Peresani, Fiore, Gala, Romandini and Tagliacozzo2011). A major interpretive challenge in this context is to determine how archaic sapiens could have been partially replaced across a wide range of habitats by an expanding population with whom they occasionally exchanged genes, and possibly, information. Phrased otherwise, if genes or ideas were sometimes shared between these groups, then what prevented the spread of selectively advantageous traits between the same populations? Undoubtedly, considerable theoretical and empirical work will be required to solve this problem. What also becomes increasingly clear is that current replacement scenarios need to be substituted by more integrative models that address demographic and behavioral variation through time and across traditional taxonomic classifications of Late Pleistocene humans.
Table 11.1. Faunal assemblages from western France used in the analysis of reindeer dominance
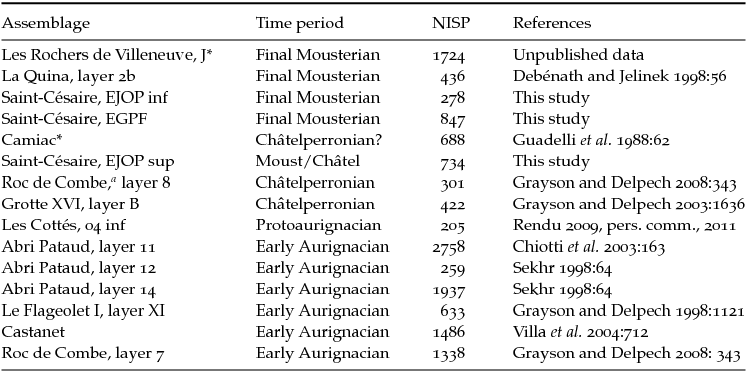
The NISP values only include red deer, bovines, horse, and reindeer. Assemblages with substantial evidence of carnivore occupation (bear excluded) are identified by an asterisk. These assemblages were included in the sample because they may yield information about climate change.
a Grayson's and Delpech's (Reference Grayson and Delpech2008) study excludes material derived from disturbed areas.
Table 11.2. Average time span for the 96 assemblages (“units”) represented in the faunal series (see Appendix 15 for a description of the assemblages)
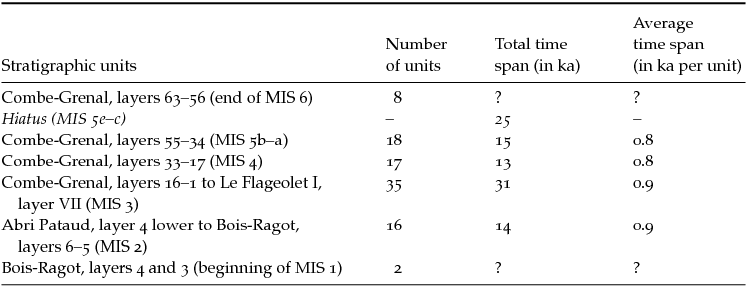
The average time span of the stratigraphic units was calculated by dividing the estimated time span of the MIS by the number of corresponding stratigraphic units within the faunal series. The chronology for Combe‐Grenal largely follows the arguments made by Delpech and Prat (Reference Delpech and Prat1995), Delpech (Reference Delpech1996), and Mellars (Reference Mellars1986, Reference Mellars1996), except for the position of the earliest Late Pleistocene occupations from that site, which are here placed during MIS 5b rather than MIS 5d/c.
Table 11.3. Marine and glacial dates for Heinrich events and coeval cultural periods in western France

The 14C (AMS) dates are average uncalibrated dates from marine cores provided by Chapman et al. (Reference Chapman, Shackleton and Duplessy2000:17, table 3). These authors applied a reservoir correction of 400 years to the dates. The dates for H7 and H6 are calendar dates from the GISP2 core, as presented in Salgueiro et al. (Reference Salgueiro, Voelker, de Abreu, Abrantes, Meggers and Wefer2010:686, figure 4). The cultural periods were identified based on 14C dates in the archaeological record and the patterns of reindeer dominance in Figure 11.8.
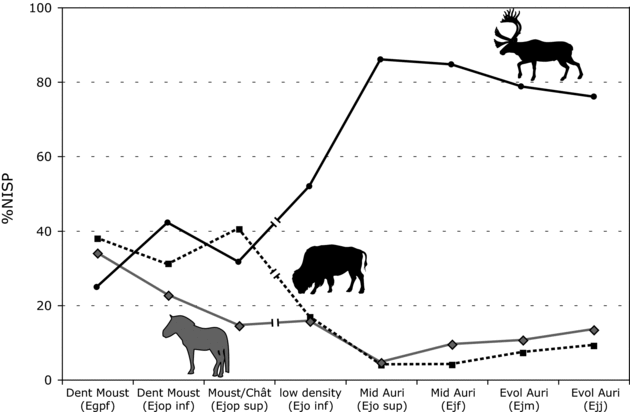
Figure 11.1. Taxonomic representation of reindeer, bison, and horse at Saint-Césaire. Data from Table 5.8.
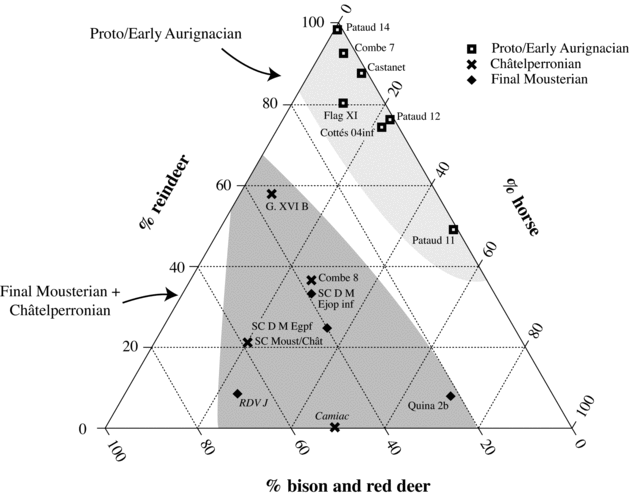
Figure 11.2. Ternary diagram showing variations in the relative abundances of reindeer, bison/red deer, and horse in final Mousterian, Châtelperronian, and Proto/Early Aurignacian assemblages from western France. Assemblages with substantial evidence of carnivore occupations are in italics. See Table 11.1 for data and references.
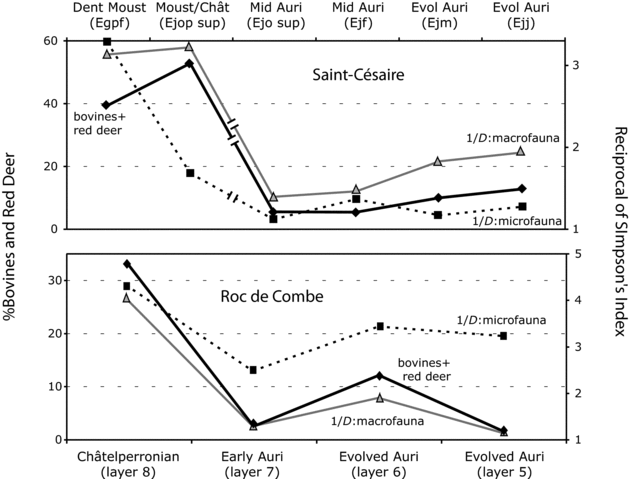
Figure 11.3. Percentages of bovines/red deer compared with variations in macro- and micro-mammal diversity at Saint-Césaire and Roc de Combe. Note the existence of a hiatus in the Saint-Césaire sequence. Species diversity is measured using the Reciprocal of Simpson's Index. Macro- and micro-mammal data for Roc de Combe are from Grayson and Delpech (Reference Grayson and Delpech2008:343–344, tables 2 and 3; carnivores included, mammoth tusk and indeterminate Equus specimens excluded) and Marquet (Reference Marquet1993:73, table 17), respectively. Macro- and micro-mammal data for Saint-Césaire are from Tables 5.8 and 5.11. At this last site, antlers, fish, unspecified foxes and leporids, and the probably intrusive Rattus specimen were excluded.
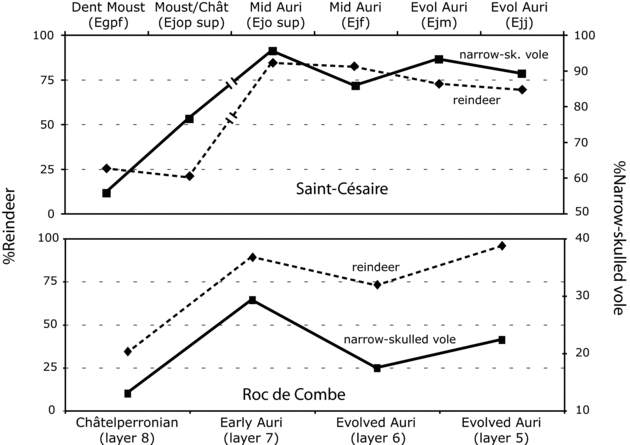
Figure 11.4. Relative abundances of reindeer and narrow-skulled vole at Saint-Césaire and Roc de Combe. Data are from the sources cited in Figure 11.3.
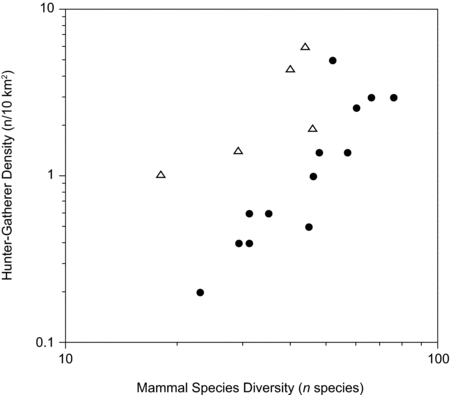
Figure 11.5. Relationship between current mammal species diversity and the historical population densities of 18 North American Arctic, Subarctic, and Plains forager groups. Triangles are cold open-country groups, whereas solid circles are northern forest and temperate grassland groups. Data shown are for the groups numbered 1, 2, 4, 5, 7, 11–13, 16, 19–27 in Morin (Reference Morin2008:49, table 1).
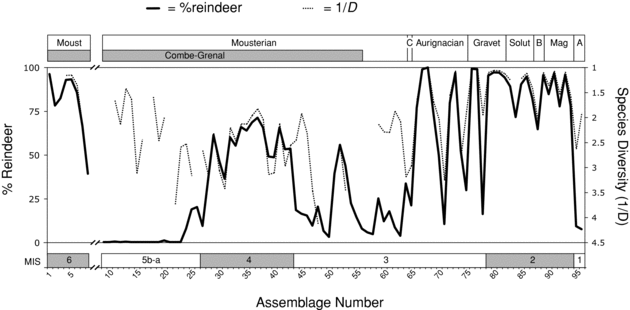
Figure 11.6. Composite series of faunal assemblages showing variations in the percentage of reindeer and in ungulate species diversity between the end of MIS 6 and the beginning of MIS 1. The numbers (from 1 to 96) in the time series correspond to the ungulate assemblages listed in Appendix 15. The diversity of ungulate species, shown here on an inverted scale, was assessed using the Reciprocal of Simpson's Index. A value of “1” on this scale means that all of the specimens belong to a single species. Conversely, a value of “5” means that species are all equally represented if the sample consists of five species. Note the hiatus between the MIS 6 and MIS 5 occupations. As discussed in the text, species diversity values are not provided for small assemblages, this statistic being particularly sensitive to sample size. NISP count for rhinocerotids, including Dicerorhinos and Coelodonta, were treated as a single taxon, as was respectively the case for Capra and bovine species. The taxa considered in the analysis of species diversity are: Sus scrofa, Cervus elaphus, Megaloceros giganteus, Capreolus capreolus, Rangifer tarandus, bovines, Rupicapra rupicapra, caprines, Equus ferus caballus, Equus hydruntinus, rhinocerotids, Dama dama, and Saiga tatarica.
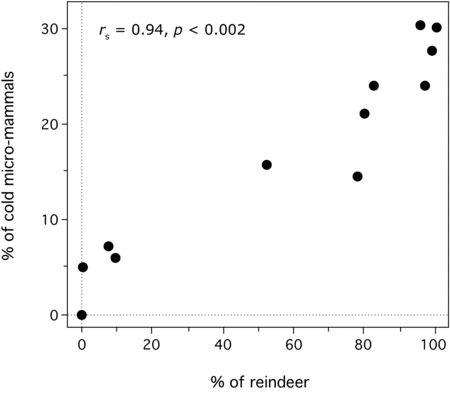
Figure 11.7. Correlation between the relative abundance of reindeer and the relative abundance of cold-adapted micro-mammals (Male/root vole, narrow-skulled vole, and the collared lemming) in the time series. Only the micro-mammal assemblages with MNI > 50 are shown in this graph. The data are from the sources cited in Appendix 15.
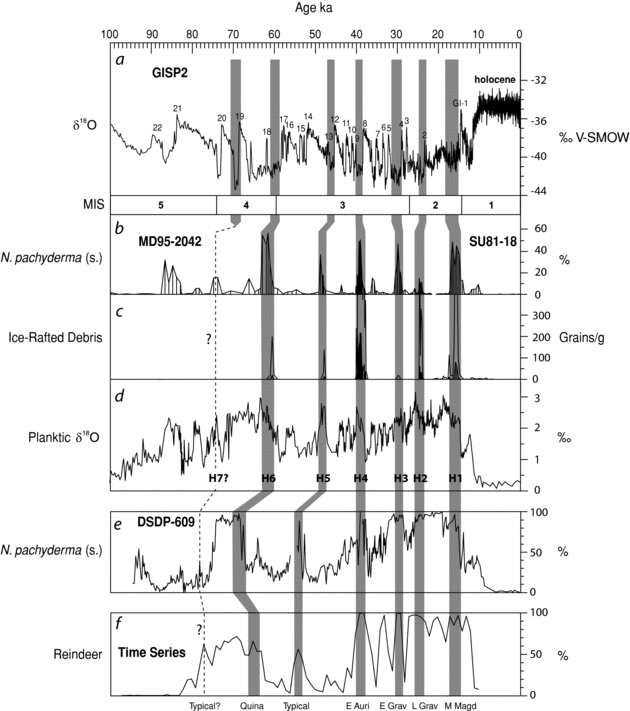
Figure 11.8. Correlations between the composite time series and various climatic proxies from the marine and glacial records: a) δ18O in the GISP2 ice core; b and e) the relative abundance of Neogloboquadrina pachyderma (left coiling) in the DSDP-609 (b) and the MD95–2042 and SU81–18 (e) cores; c) concentration of ice-rafted debris (IRD) in the MD95–2042 and SU81–18 cores; d) planktic δ18O in the MD95–2042 and SU81–18 marine cores; f) percentages of reindeer in the composite time series. H7–H1 are Heinrich events. Data for a are from Stuiver and Grootes (Reference Stuiver and Grootes2000), as reported by Salgueiro et al. (Reference Salgueiro, Voelker, de Abreu, Abrantes, Meggers and Wefer2010:688, figure 7), those for b–d are from Sánchez Goñi et al. (2008:1142, figure 3). The data for e are those published by Bond et al. (Reference Bond, Heinrich, Broecker, Labeyrie, McManus, Andrews, Huon, Jantschik, Clasen, Simet, Tedesco, Klas, Bonani and Ivy1992) and Bond and Lotti (Reference Bond and Lotti1995), as interpreted by Allen et al. (Reference Allen, Brandt, Brauer, Hubberten, Huntley, Keller, Kraml, Mackensen, Mingram, Negendank, Nowaczyk, Oberhänsli, Watts, Wulf and Zolitschka1999:742, figure 3), whereas the data for f are from Figure 11.6. In the GISP2 ice core (panel a), δ18O values in the samples correspond to the relative difference, given as per mil, in the abundance ratios of 18O/16O with respect to a standard (V-SMOW, the Vienna Standard Mean Ocean Water). In panel d, δ18O values were taken on Globigerina bulloides.
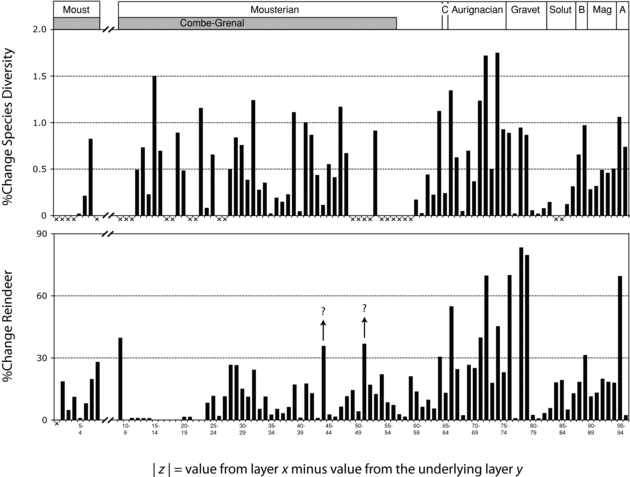
Figure 11.9. Absolute percent change in reindeer representation (lower diagram) and species diversity (upper diagram) between stratigraphically adjacent layers. The “×” symbols indicate that the data were unavailable due to small sample size or lack of underlying layer. Note the hiatus between the MIS 6 and MIS 5 occupations of Combe-Grenal. The arrows highlight the fact that other Mousterian assemblages suggest stronger reindeer dominance during these time periods than is indicated at Combe-Grenal.
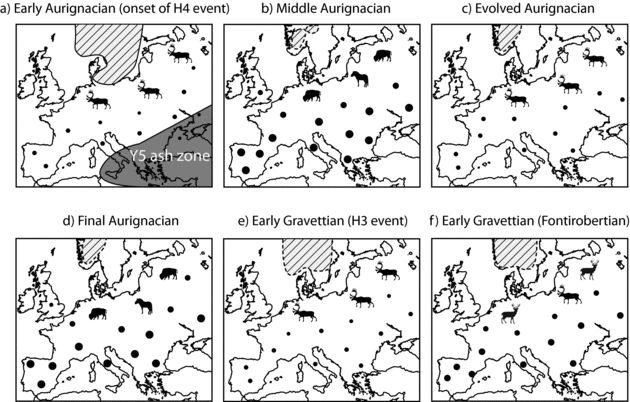
Figure 11.10. Demographic model for western Europe representing change in the distribution and density of human populations during the early Upper Paleolithic. Larger dots in the figure denote higher population densities. The shaded area indicates the ash zone associated with the Campanian Y5 Ignimbrite eruption. The dashed lines show the possible limits of glaciated zones (limits are extrapolated following Lambeck et al. 2010).
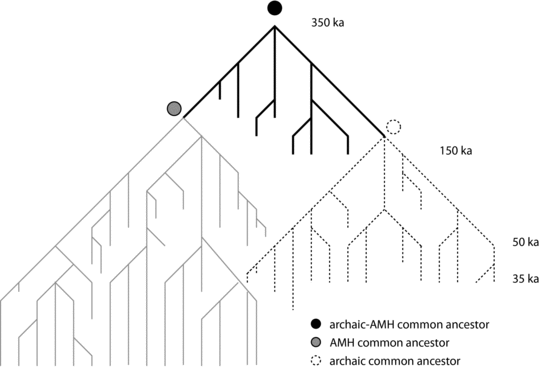
Figure 11.11. Possible effects of genetic drift on the genealogy of archaic sapiens and early modern humans. In this figure, archaic sapiens (“archaic”) and anatomically modern humans (“AMH”) diverge early. The example shows that most of the archaic lineages become extinct by 35 ka, with the exception of a few lineages (one of the left-most archaic lineages) that persist somewhat longer.
1 Murdoch's (Reference Murdoch1981) classification of hunters-gatherers focuses on three subsistence activities: i) wild plant and small land fauna collecting, ii) hunting, including trapping and fowling, and iii) fishing and shellfish collection. The values for the groups that were not included in his study were derived from the group with the most similar diet.
2 The help received from Alexandre Michel, Jean-Philippe Faivre, Damien Pesesse, Sylvain Ducasse, Catherine Cretin, André Morala, and Mathieu Langlais was invaluable in this respect.
3 Percentages were calculated using only ungulate remains. Elephantids, indeterminate cervids, and possible Megaloceros remains were excluded, as were samples with fewer than 30 specimens.
4 Few data are available on the composition of the lithic assemblage from layer 8 at Combe-Grenal.


