


Introduction
The study of pollen is important in paleoecology, paleontology, archeology, and forensics. The outer shell of a pollen grain bears characteristic features that help in determining the species or genus of origin. To view the pollen grain from several angles in a light microscope, the sample is usually mounted in glycerol and rolled on the microscopic slide by pushing the coverslip. For teaching, training, and also for establishing databases of pollen images, it is desirable to obtain three-dimensional datasets that allow rotation and viewing from any angle and reslicing in the computer.
Although the scanning electron microscopy provides sufficient depth of field and high resolution of surface features [Reference Jones and Bryant1], without tilting or rotating the specimen, images from the SEM show only one side of the pollen grain at a time (Figure 1). In contrast, confocal fluorescence microscopy permits optical sectioning and 3D reconstruction of a single pollen grain and allows imaging of not only the surface, but also the internal structure of the pollen grain, albeit at resolution limited by diffraction, that is, typically ~ 0.2 μm in XY and ~ 0.5μm in Z. To achieve this resolution, oil immersion objectives with high numerical aperture must be used. Oil immersion objectives achieve their nominal resolution only when used for specimens with a refractive index (RI) that is homogeneous and equal to that of the immersion oil, that is, η=1.515. An RI mismatch between the immersion oil and the specimen, or local differences in RI within the specimen, cause distortion and a loss of both resolution and fluorescence signal intensity.
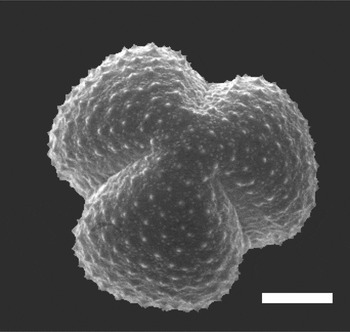
Figuer 1: Scanning electron micrograph of Artemisia tridentata pollen. Scale bar = 5 μm. Image courtesy of Gretchen D. Jones, USDA-ARS, APMRU.
Pollen grains are a challenging type of specimen because the cellular content of raw pollen is highly autofluorescent and optically inhomogeneous, which leads to light absorption, scattering, and spherical aberration. Typically, only the half of the pollen grain closest to the objective can be imaged at good resolution in single-photon fluorescence microscopy. We have employed sample preparation and mounting techniques that allow single-photon 3D confocal imaging of even relatively large grains (more than 50 μm in diameter) without excessive loss of resolution toward the bottom of the 3D dataset. Two key elements of our technique are pollen extraction and refractive index matching.
Preparation
Pollen extraction. Fresh or dried pollen was processed using a modified acetolysis method according to Erdtman [Reference Erdtman2] in order to remove the cellular contents and debris and to isolate exine, the acetolysis-resistant outer shell. The exine has sufficient autofluorescence to permit confocal microscopy. The step-by-step protocol is available on the MIC web site http://microscopy.tamu.edu/lab-protocols/light-microscopy-protocols.html
Refractive index matching. In order to achieve RI optimal for imaging with oil immersion objectives, the acetolysis-processed pollen suspended in glacial acetic acid was gradually rehydrated by adding increasing amounts of water. A total of 10 steps were performed. In order to accelerate the diffusion process, microwave irradiation in a Pelco Biowave (Ted Pella Inc., Redding, CA) laboratory microwave processor for 1 minute at 230W was used in each step. Pollen was then collected by centrifugation at 1000 × g for 1 minute, resuspended in phosphate buffered saline (PBS; 140 mM NaCl, 3 mM KCl, 10 mM Na2HPO4, 2 mM KH2PO4) and microwaved as above. Subsequently, the pollen was infiltrated with 2,2'-thiodiethanol (TDE), a mounting medium for high-resolution microscopy [Reference Staudt, Lang, Medda, Engelhardt and Hell3], using 10%, 25%, 50% v/v TDE/PBS mixture, and finally three times in 97% v/v TDE/PBS, using microwave irradiation in each step. The pollen was then spun down and the pellet resuspended and stored in 97% TDE/PBS in microcentrtifuge tubes. The RI of 97% TDE is 1.515, that is, the same as RI of immersion oil [Reference Staudt, Lang, Medda, Engelhardt and Hell3].
Confocal Microscopy
The Olympus FV1000 laser scanning confocal microscope with a UPLSAPO 100×/1.4 oil immersion objective was used in photon counting mode with the confocal aperture set to 0.75 Airy (120 μm on the FV1000 system). Excitation wavelength was 488 nm, and emission bandpass was set to 500–600 nm. The laser output was programmed to increase with imaging depth to maintain image brightness, typically from 7% to 12% of maximum output. The voxel size was set to 65 × 65 × 130 nm. The resolution of the objective under these conditions was previously estimated as 196 ± 12 nm in XY and 418 ± 43 nm in Z (FWHM; full width at half maximum) using 100 nm fluorescent beads. Deconvolution with Huygens Pro software (SVI, Hilversum, Netherlands) used 100 iteration of Classic Maximum Likelihood Estimation method. Surface rendering was performed using Osirix freeware (http://www.osirix-viewer.com).
Results and Discussion
The sample preparation protocol allowed confocal 3D imaging of the entire pollen grain, without substantial loss of resolution or signal intensity on the far side of the specimen. Deconvolution of the 3D image stacks provided noticeable enhancement in resolution (Figure 2). Confocal images allowed to assess the internal structure of the pollen grain wall (Figures 2 and 3A) and also enabled realistic visualization of the pollen grain surface (Figures 3B, C, D). The pollen grains shown in these figures are 25 to 30 μm in diameter. We have imaged pollen grains more than three times that size with similar results except that the datasets for the largest pollen grains, almost 2.5 GB in size, could not be deconvolved using our computers, because total memory requirements exceeded the limits of the 32-bit operating system. Further gain in resolution is possible by a slight increase in oversampling, because the current XY pixel size (65 nm) is somewhat larger than the sampling rate recommended by some calculations (for example, the Nyquist Calculator at http://support.svi.nl/wiki/NyquistCalculator suggests voxels 43 × 43 × 130 nm). Axial resolution could be increased by further closing the confocal aperture at the expense of signal intensity or imaging speed. With confocal aperture set to 50% Airy (80 μm), the axial resolution of the particular 100×/1.4 objective was previously measured as 330 nm (FWHM) using a mirror slide test specimen [Reference Zucker4].However, much slower scanning may be impractical because even now acquisition times are 30 minutes for Artemisia and Celtis and over four hours for very large pollen grains, for example for Pinus nigra.

Figuer 2: Confocal optical sections of Celtis laevigata pollen grain. Raw and deconvolved data are shown in the left and right panels, respectively. Top: XY view, a single optical section from the z-stack. Middle: XZ section through the z-stack. The dotted rectangle indicates an area shown enlarged in the bottom panels. Scale bars = 5 μm.

Figuer 3: Artemisia dracunculus pollen grain. A, a single optical section (XY plane) from a confocal microscope, showing the outer surface as well as the internal structure of the wall. B-D, three different surface rendering views generated from the same confocal dataset. Scale bar = 5 μm.


