


Introduction
Atom probe tomography (APT) (Miller, Reference Miller2000; Gault et al., Reference Gault, Moody, Cairney and Ringer2012; Larson et al., Reference Larson, Prosa, Ulfig, Geiser and Kelly2013; Lefebvre-Ulrikson et al., Reference Lefebvre-Ulrikson, Vurpillot and Sauvage2016) and field ion microscopy (FIM) (Reference MüllerMüller, Reference Müller1956a, Reference Müller1956b; Wagner, Reference Wagner1982) belong to a family of microscopy techniques named atom probe microscopy (APM). These techniques take advantage of the physics of field evaporation to remove ions from the surface of a needle-shaped specimen. Subsequent acceleration of these ions in an electric field towards a position-sensitive and time-of-flight-recording detector system enables measurements that can be used to reconstruct the atomic architecture of the specimen. This involves two computational steps. The first step is calibrating and translating the time-of-flight data into mass-to-charge-state ratios (Larson et al., Reference Larson, Prosa, Ulfig, Geiser and Kelly2013). This step is where the ratios are mapped to an element or molecular ion species (henceforth called atom species) (Ulfig et al., Reference Ulfig, Kelly and Gault2009). The second step is reconstructing the specimen atom-by-atom to form a three-dimensional image of the physical specimen (Bas et al., Reference Bas, Bostel, Deconihout and Blavette1995).
Sub-nanometer spatial and isotopic resolution, as well as the ability to measure millions of ions, makes APT a unique tool for characterizing the nanoscale composition of bulk material volume (Kelly & Miller, Reference Kelly and Miller2007; Vurpillot et al., Reference Vurpillot, Danoix, Gilbert, Koelling, Dagan and Seidman2017; Saxey et al., Reference Saxey, Moser, Piazolo, Reddy and Valley2018) or quantifying the chemical decoration of crystal defects with solute atoms (Leitner et al., Reference Leitner, Felfer, Holec, Cairney, Knabl, Lorich, Clemens and Primig2017; Stoffers et al., Reference Stoffers, Barthel, Liebscher, Gault, Cojocaru-Mirédin, Scheu and Raabe2017; Ghamarian & Marquis, Reference Ghamarian, Yu and Marquis2020; Zhou et al., Reference Zhou, Mianroodi, da Silva, Koenig, Thompson, Shanthraj, Ponge, Gault, Svendsen and Raabe2021). These capabilities, especially, when used in correlation with electron microscopy (Herbig et al., Reference Herbig, Choi and Raabe2015; Breen et al., Reference Breen, Babinsky, Day, Eder, Oakman, Trimby, Primig, Cairney and Ringer2017; Eder et al., Reference Eder, McCarroll, la Fontaine and Cairney2018; Fletcher et al., Reference Fletcher, Moody and Haley2020), substantiate that APT and FIM are useful techniques for quantitatively characterizing microstructure–material–property correlations.
Despite the significant strength of these methods, these have also limitations which must be considered to interpret the data correctly. For APM, there are three key limitations. First, the mass-resolving power is lower than for time-of-flight secondary ion mass spectrometry (ToF-SIMS) in organic chemistry (Gault et al., Reference Gault, Moody, Cairney and Ringer2012; De Bruycker et al., Reference De Bruycker, Welle, Hirth, Blanksby and Barner-Kowollik2020). Typical full-width at half maxima for mass spectrum peaks are m/Δm ≈ 1,000 for APT while >10,000 for ToF-SIMS leaving isobaric overlaps, and at times subjective interpretations. The second limitation is that the detector system does not capture every evaporated ion. Detection efficiencies range from ≈36 to 80% depending on the configuration. The third limitation is that the analysis of the results is based on a collection of reconstructed atom positions which are ideally the most plausible set of positions where the atoms were originally located in the evaporated specimen. This reconstruction process, though, has limited precision because of trajectory errors (Vurpillot et al., Reference Vurpillot, Gault, Geiser and Larson2013; Vurpillot & Oberdorfer, Reference Vurpillot and Oberdorfer2015) and the simplifying assumptions which are made during the reconstruction process in light of the trajectory errors (Bas et al., Reference Bas, Bostel, Deconihout and Blavette1995; Gault et al., Reference Gault, Haley, de Geuser, Moody, Marquis, Larson and Geiser2011).
There is, by now, a large collection of commercial or open-source software tools to assist microscopists with their analyses (for an overview of the tools, see Haley et al., Reference Haley, Ceguerra, Kühbach, London, Oberdorfer, Radiguet, Reinhard and Isheim2021b; Kühbach et al., Reference Kühbach, Bajaj, Zhao, Çelik, Jägle and Gault2021). Facing this variety, it is often the experimentalists’ responsibility to select the tools which offer the best quantitative compromise for a task. Key questions in this situation, from a data science perspective, are which tools and settings realize an accurate and precise compromise for the description of the reconstructed dataset; how can these tools assist us when facing the above-mentioned uncertainties; and how accurate and precise are analysis results when we compare between different implementations of the same algorithm for the same dataset.
Understanding an algorithm, the settings in which the algorithm is executed, and its parameters is a prerequisite for making informed tool choices and analyses. Therefore, the APM community has published a collection of papers which cover how the parameters, or the settings made when using an algorithm, affect the numerical results. Recent studies along these lines are, for instance, those of Stephenson et al. (Reference Stephenson, Moody, Liddicoat and Ringer2007), Dhara et al. (Reference Dhara, Marceau, Wood, Dorin, Timokhina and Hodgson2018), Wang et al. (Reference Wang, Schreiber, Bailey, Hosemann and Toloczko2019b), Hornbuckle et al. (Reference Hornbuckle, Kapoor and Thompson2015), and Barton et al. (Reference Barton, Hornbuckle, Darling and Thompson2019). Our work is a continuation of these activities. We advocate that in order to make past and especially future studies even more useful, authors should offer access to the datasets and supplement these with as rich metadata as it is practically possible. Realizing such a community-driven process of collecting datasets and test cases needs a discussion to identify which infrastructure tools the APM community would feel comfortable to work with and how these tools can offer the best practical compromise.
In fact, the APT literature documents cases where the detailed computational steps remain opaque. Examples are, for instance, the usage of default software settings without giving detailed pieces of information which software versions were used. Often more focus was placed on the science within the data than on transparent processing of the data itself. There are multiple likely reasons for this: whether it be because researchers used closed source code or scripts or because authors had to cut short on their method sections to sharpen the narratives for high-impact research, or because it was difficult to get funding for purely data-centric studies.
The recent push towards making research results FAIR, i.e. to analyze, document, and publish metadata and associated numerical data of a research study to meet the aims of the FAIR data stewardship principles (Wilkinson et al., Reference Wilkinson, Dumontier, Aalbersberg, Appleton, Axton, Baak, Blomberg, Boiten, da Silva Santos, Bourne, Bouwman, Brookes, Clark, Crosas, Dillo, Dumon, Edmunds, Evelo, Finkers, Gonzalez-Beltran, Gray, Groth, Goble, Grethe, Heringa, ’t Hoen, Hooft, Kuhn, Kok, Kok, Lusher, Martone, Mons, Packer, Persson, Rocca-Serra, Roos, van Schaik, Sansone, Schultes, Sengstag, Slater, Strawn, Swertz, Thompson, van der Lei, van Mulligen, Velterop, Waagmeester, Wittenburg, Wolstencroft, Zhao and Mons2016; Draxl & Scheffler, Reference Draxl and Scheffler2020; Crouzet et al., Reference Crouzet, Mons and Tochtermann2021), carries a potential for improvement. The acronym FAIR details that research (meta)data and workflows should be Findable, Accessible by researchers and digital tools, and further that these data should be Interoperable with digital tools. Combining this with a delivery of sufficiently detailed metadata has the potential to make research more Reproducible. Focusing on the advantage of having open research data, we can also reinterpret the R in the acronym FAIR as that (meta)data should be repurposable (Draxl & Scheffler, Reference Draxl and Scheffler2020) for different investigations as for what they were originally created, measured, or collected. Examples of repurposing are training for artificial intelligence (AI) methods and performing metastudies with FAIR, i.e. AI-ready, data.
The potential of FAIR is that it can bring together researchers from different disciplines to work together on improving computational tools and understanding the functioning of such tools in more detail. With the potential to serve as an additional research quality metric, making our research FAIR is going to be mandatory for publicly funded research. We are convinced sensitivity studies should be more frequently performed and communicated as openly as possible to motivate inter-laboratory and interdisciplinary verification and research activities (Rowenhorst et al., Reference Rowenhorst, Rollett, Rohrer, Groeber, Jackson, Konijnenberg and Graef2015; Marquis et al., Reference Marquis, Araullo-Peters, Dong, Etienne, Fedotova, Fujii, Fukuya, Kuleshova, Lopez, London, Lozano-Perez, Nagai, Nishida, Radiguet, Schreiber, Soneda, Thuvander, Toyama, Sefta and Chou2017; Kamachali et al., Reference Kamachali, Schwarze, Lin, Diehl, Shanthraj, Prahl, Steinbach and Raabe2018; Dong et al., Reference Dong, Etienne, Frolov, Fedotova, Fujii, Fukuya, Hatzoglou, Kuleshova, Lindgren, London, Lopez, Lozano-Perez, Miyahara, Nagai, Nishida, Radiguet, Schreiber, Soneda, Thuvander, Toyama, Wang, Sefta, Chou and Marquis2019; Thrun & Stier, Reference Thrun and Stier2021).
Successful interdisciplinary research requires that scientists familiarize themselves with the language of different disciplines. We understand that when reporting about the testing and verifying of software tools, this takes a learning curve and comes with own challenges. An important one is how, and under which conditions, a specific scientific community perceives research on verification and validation of software as a successful result or not.
This depends on multiple factors: Having access to analytical theory and openly shared ground truth data and open software code are important factors. Agreeing on the level of sophistication and the applied scientific rigor which the majority of a community is aiming at is another factor. Compared to condensed-matter physics, the APM community is at an earlier stage of implementing the FAIR data stewardship principles.
Figure 1 displays a typical scientific workflow with the main steps along which an APT/FIM specimen and associated dataset enters a publication. The workflow can be described as a graph with nodes which represent resources (materials, samples, specimens, datasets, instruments, hard- and software tools, and researchers). These nodes are linked, in most cases, in one direction, to indicate in which direction these resources flow through and how pieces of information are modified and transformed along the workflow. Noteworthy, modern cryo-preparation (Schreiber et al., Reference Schreiber, Perea, Ryan, Evans and Vienna2018; El-Zoka et al., Reference El-Zoka, Kim, Deville, Newman, Stephenson and Gault2020; McCarroll et al., Reference McCarroll, Bagot, Devaraj, Perea and Cairney2020) methods or involved correlative microscopy experiments add further nodes to such a workflow, as well as bidirectional or eventually even cyclic connections between nodes.

Fig. 1. To the left: Key steps of one type of scientific workflow via which many APT/FIM specimens find entry into publications. To the right, an associated (incomplete) list of exemplary (meta)data which experimentalists ideally need to keep track of during each step.
From the perspective of an individual scientist, we can identify two general types of phases how the steps of the data analyses in the above workflow are realized in daily practice; here phases are understood as steps within the process of studying a research question: on the one hand, scientists work in a more discovery (or exploratory) phase and on the other hand, often later in the workflow, scientists work in a more systematic phase.
The discovery phase is where the user has limited knowledge of which relevant nanostructural features were captured and thus are worth analyzing. Examples of users in the discovery phase are scientists who could be running their experiment on a material for the first time or they could be running a series of exploratory experiments to form their research hypotheses. Visualization is extremely helpful in the discovery phase, including three-dimensional renditions of the dataset or simple diagrams to explore values and correlations between possible descriptors. Descriptors, which is a commonly used term in the field of artificial intelligence (Ghiringhelli et al., Reference Ghiringhelli, Vybiral, Levchenko, Draxl and Scheffler2015), are in essence variables used for characterizing materials and processes. Examples could be volume fraction of second phase particles, dislocation density, or chemical composition, Voronoi volume of an atom, or combinations of such descriptors via mathematical operations. Having test cases available for the discovery phase is mainly important for verifying that the rendering of a visualization is reliable or why the rendering differs from expectations.
The discovery phase is where commercial software and graphical user interfaces (GUI) are the most practical tools because they offer intuitively a larger flexibility to perform analyses. The disadvantage is that this usage of visual tools can contribute to subjective bias which is why ideally each dataset should also be processed within the systematic phase.
The systematic phase is where we build on the knowledge gained from the discovery phase to make the workflows reproducible and more methodological to quantify uncertainties. As this creates more analysis time demands, this is where command line tools, automation, and high-throughput tools, are useful. Especially useful is when these tools can profit from scientific computing to process a variety of different or numerically costly analyses or artificial intelligence training steps in an overall shorter amount of time. The preparation of figures and supplementary results during the manuscript writing, the revision, and the publication process are also a part of the systematic phase. Evidently, in most of these steps, it is possible to define specific data processing pipelines whose main advantage is their reutilizability and customizability. Test cases are then mainly important for investigating and verifying how different algorithms along an analysis pipeline perform for specific or a collection of datasets. In both phases, the ability for a scientist to perform an action that they intended is important.
Documentation is the traditional way to detail the functioning of software including its numerical algorithms. We propose an additional method, which is to use test cases with datasets to help communicate how a tool works. Such test cases can also provide a frame of reference, so that the results of the analyses are easily verifiable across different software versions.
In this work, we focus on specific examples taken from the data analysis step (Fig. 1). We should clarify that calling an APM workflow compliant with the FAIR principles requires the documentation of (meta)data for all the above steps (Fig. 1). The challenges which come with such a task make it clear why a community-driven process is needed during which interdisciplinary researchers, instrument manufacturers, software developers, and funding agencies speak the same, ideally open, language of data exchange and work together to provide the resources to build infrastructure for achieving such an aim.
A similar community-driven process like we report for the data analysis step is especially necessary when it comes to the reconstruction and the ranging step. Clearly, all position differences introduced by using different reconstruction algorithms or different reconstruction parameters and detector system calibrations translate into quantitative differences for all downstream data analysis steps. Similarly, all differences introduced during ranging affect compositional analyses and characterization of nanostructural features. Often underestimated, all differences introduced during mapping reconstructed ion positions on a three-dimensional grid of composition or concentration values result in differences when performing a subsequent identification of microstructural objects and analyzing their spatial arrangement and geometry.
Apart from a few exceptions, APM experiments, though, rely on the proprietary software of a single instrument manufacturer for reconstructing a dataset. We may argue that such monopoly serves reproducibility: one would expect to obtain reproducible results if one processes a dataset which comes from a given instrument and processes this dataset always with the same specific instrument, the same hardware and software configuration, the same calibration, and the same parameterization.
However, the same reconstruction computation is neither reproducible with software other than the commercial one nor interoperable, and therefore such an approach for reconstructing APM results is not compliant with the FAIR principles. Noteworthy, such a barrier is a very effective one against implementing FAIR principles, not only in the field of APM but for microscopy communities and the experimental sciences in general.
To solve this challenge, the APM community and instrument manufacturers can aim at a compromise which enables companies to still be recompensed for developing software for their instruments but at the same time make their numerical methods and calibration procedures more transparent (Reinhard et al., Reference Reinhard, Payne, Strennen, Oltman, Geiser, Sobering and Mandt2019).
There are several strategies for testing software. These strategies can probe between two extremes. On the one hand, there are methods of formalized model checking (e.g., Keller, Reference Keller1976; Baier & Katoen, Reference Baier and Katoen2008; London, Reference London2019). Often these methods are paired with making exact comparisons between analytical or numerical results against ground truth data. On the other hand, there are more empirical strategies of software testing. Formalized strategies are frequently performed and advocated for in the field of computer science and mathematics (Fehr et al., Reference Fehr, Heiland, Himpe and Saak2016).
Often, though, the acceptance of such methods, and consequently getting the buy-in from experimentalists to use such methods is very low. One reason is the demand for specific computer science, programming logic, and applied mathematics expert knowledge. Facing this technical barrier is not exclusively a challenge when developing formally correct software. It can also be a reason for a lack of detailed technical understanding which itself can contribute to an unintentional proliferation of biased results or usage of unsubstantiated so claimed best practices in the literature. Another reason is factual challenges associated with model checking computer programs which by now often rely heavily on third-party code contributions to keep the software development process efficient.
The authors are convinced that the community should better start more pragmatically, i.e. collect test cases, assess these, and learn from these how specific methods work in detail and where inconsistencies exist. Thereafter, we should systematize and intensify such collection initiatives within a community-driven process. Specifically, test cases should be communicated openly and discussed for their shortcomings in an honest, rigorous, and transparent process.
This work adds a contribution in accordance with this strategy and identifies which future demands for a research data management infrastructure (RDM) are needed to support the APM community with the implementation of FAIR data stewardship principles. Specifically, we asked the following questions in the hope that these can guide us through the process:
1. What constitutes useful test cases? What are useful associated datasets?
2. How to define these datasets and document the test cases in a community-driven process?
3. How to understand and document best the limitations of these test cases and methods?
4. What do practitioners expect from a test case in experimental science communities?
5. How do views between domain experts differ in a scientific community or across such communities?
6. How to get a commitment of individuals from different research labs to use or contribute test cases?
With the test cases in this work, we propose answers to the first four questions. We expect that the value of having test cases and the motivation for using them differs within the course of a typical data processing workflow for APM. Our aim in this work is to motivate for using and developing reproducible analyses and sharing of the associated (meta)data openly. We will identify for which analyses these test cases are useful. We let the following questions guide our efforts:
• How do these test cases provide assistance to researchers?
• Which challenges are addressed and represented by the test case?
• How can we ensure the validity of these test cases themselves?
• What would be required if one wishes to reproduce the analysis results numerically?
Materials and Methods
We define a test case as a collection of metadata and associated numerical data(sets) for an analysis task. Our aim is to show how the test cases can be used for verifying software and for identifying how data analyses in APM can fulfill the FAIR research principles with more (meta)data content.
Test cases ideally challenge an algorithm. Challenges can be cases where, e.g. multiple solutions are possible. Challenges can also be cases for which analytical solutions are available and we want to compare how a computed analysis result matches the analytical solution. The dataset(s) to a test case need to hold either the results of a measured atom probe experiment or the results of a digitally synthesized specimen. Working with synthetic data is common practice when creating ground truth data for verifying algorithms.
A test case is not complete without its associated metadata, i.e. data which contextualizes and specifies how to interpret the numerical data. These metadata specify the investigated material (sample, specimen) or reconstructed dataset of a specimen. The metadata detail pieces of the workflow as a portion of which the analysis was executed (Fig. 1). Furthermore, metadata serve administrative purposes to detail who developed the case study or measured the specimen.
For collecting test cases from the APM community, we opted for a strategy where we first developed a template with common pieces of information. We sent this template to members of the atom probe community and invited them to fill in the template and contribute what they consider as useful test cases. All contributors agreed to share the test cases as open data.
The supplementary material includes the template, all submitted test cases, and describes which software tools were used. Individually, the authors could have submitted these papers as data-centric publications like exemplified by Dhara et al. (Reference Dhara, Marceau, Wood, Dorin, Timokhina and Hodgson2018). Our strategy of pooling them together, though, enables a discussion of the relation and differences between test cases. This offers a more comprehensive view of the status quo in the community.
We asked the participants to store datasets of either measured APT specimens or synthetic data in a file format which holds at least the reconstructed position and calibrated mass-to-charge-state ratio values for each detected ion. Common file formats of the community like POS (with the speaking file format name referring to ion position data) or EPOS (with the e standing for extended) meet this requirement. Details to the attributes of these file formats have been reported, e.g. in Gault et al. (Reference Gault, Moody, Cairney and Ringer2012). With their AP Suite commercial software, the instrument manufacturer introduced a new file format, the so-called new APT (APT6) file format (Reinhard et al., Reference Reinhard, Payne, Strennen, Oltman, Geiser, Sobering and Mandt2019). Compared to HITS and RHIT, i.e. raw file formats with fields that are only accessible via the proprietary software, APT6 is an openly accessible binary exchange file format. The format has advantages over POS and EPOS: The format is not only more descriptive in its metadata for each field but it is also capable of encoding additional numerical data arrays like raw detector hit, voltage, and pulse sequence data to name but a few. Details to the attributes and fields, which are called branches within AP Suite, of this file format are given in a Python/Matlab and C/C++ open-source reader for the file format (Kühbach, Reference Kühbach2020). This reader is part of the paraprobe-transcoder tool (Kühbach et al., Reference Kühbach, Bajaj, Zhao, Çelik, Jägle and Gault2021).
Furthermore, we asked the participants to deliver so-called ranging (meta)data with their test case. These metadata define how to map from mass-to-charge-state ratios to atom species. Common ranging file formats like RNG or RRNG qualify for communicating this mapping (Gault et al., Reference Gault, Moody, Cairney and Ringer2012; Larson et al., Reference Larson, Prosa, Ulfig, Geiser and Kelly2013).
We are convinced that the collection of test cases in this work offer a good cross-section of analysis tasks but the collection is not fully complete. Instead, collecting test cases should become a community effort worth significant attention. In fact, the APM software tool landscape has further tools, different in implementation, than those we have addressed here. For all of these tools, a more detailed discussion is useful. Specifically, we are convinced it is useful to assess in the future how specific numerical values differ between implementations of the same algorithm and to investigate how results compare between different algorithms when these are applied on the same dataset or collections of datasets. Herewith, we invite the APT/FIM community to submit, if there are further datasets and test cases worth sharing in this mentality to complement the present work.
In response to our call, we received test cases for examples of applied data analysis methods which are commonly reported in the APT literature. The test cases cover datasets from real experiments and digitally created data. Figure 2 summarizes the covered test case variety. After collecting, we assessed how completely the authors filled in their respective template. In the Results section, we summarize the submitted test cases. Different from the usual reporting of results in a research paper, though, we will assess which details the test cases pinpoint that are often deemed as irrelevant information in publications. We will then discuss for each test case why such pieces of information are relevant; and should therefore be always published at least as supplementary material or as data-centric small publications alongside a research study. Furthermore, we will address for which purposes the test cases are useful (uncertainty quantification, software testing, or improving reproducibility).
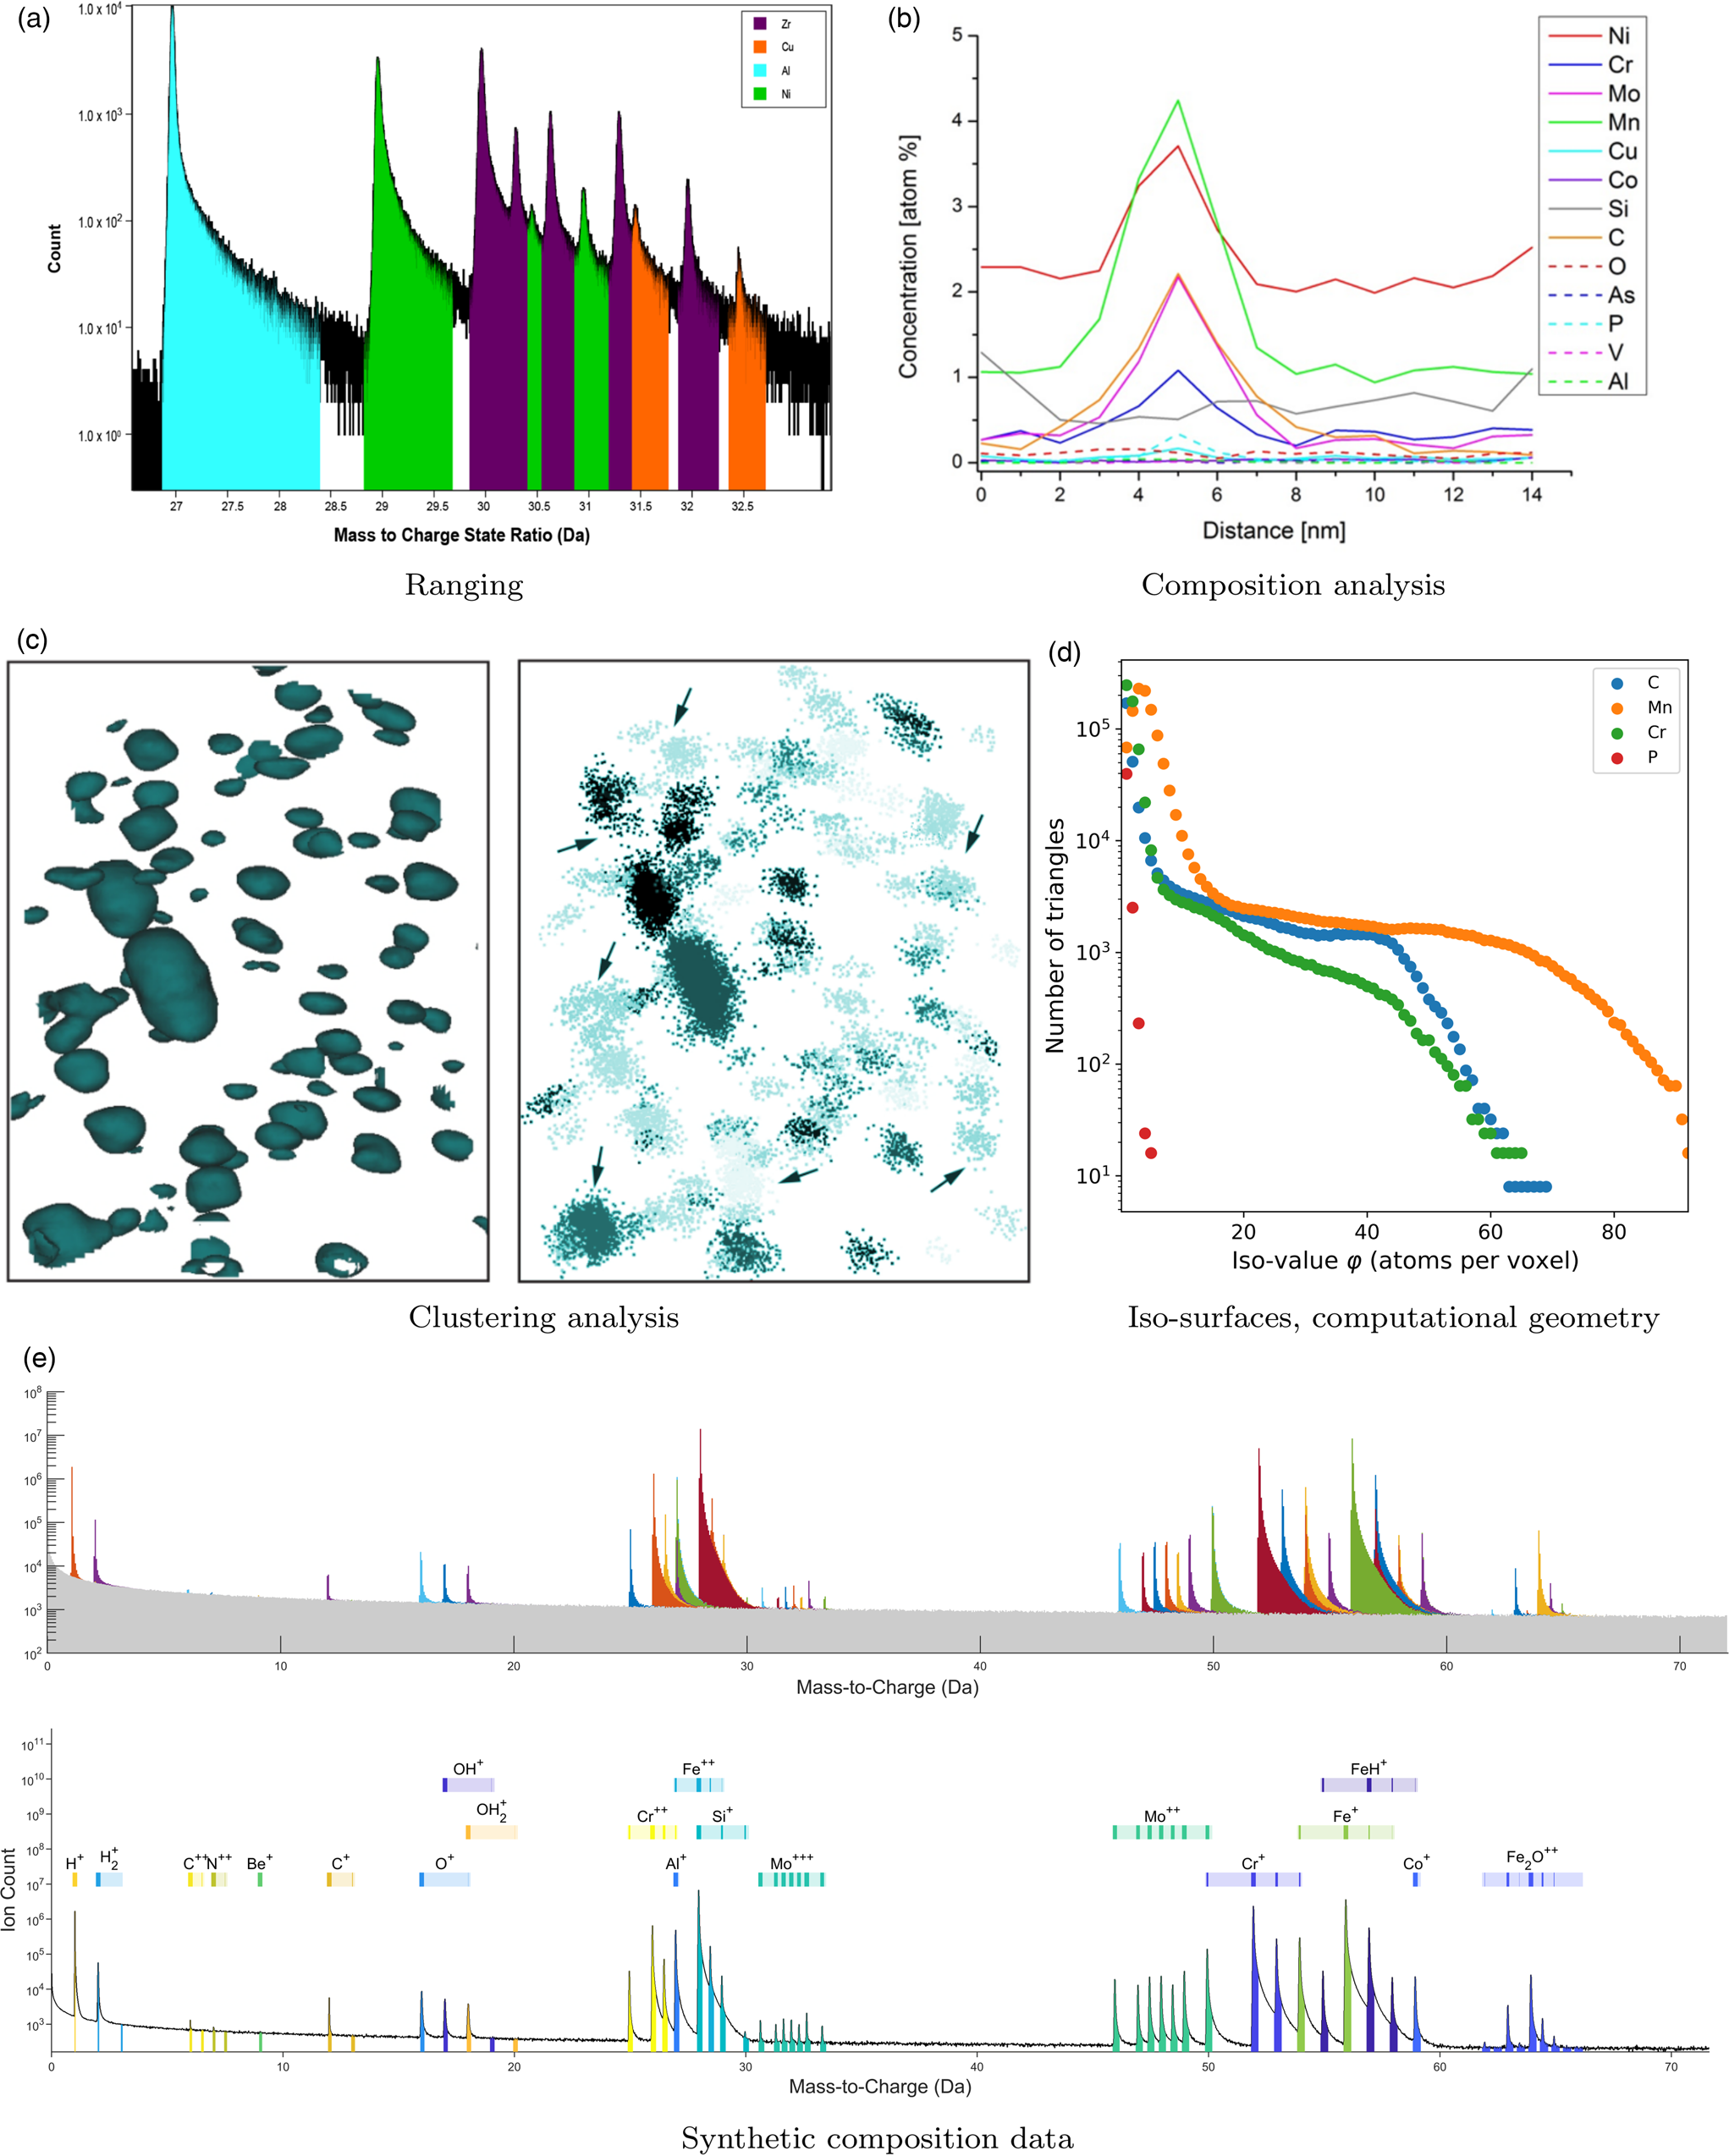
Fig. 2. Overview of the type of analyses for which test cases were submitted and are discussed in this work.
Results
The filled-in template and collection of open (meta)data for each test case are the results of this study. This material is available as supplementary material (Ceguerra, Reference Ceguerra2021) organized for each test case. Test cases are enumerated as follows:
1. Clustering PNNL (Pacific Northwest National Lab) contains one dataset for a ferritic MA957 oxide dispersion strengthened (ODS) alloy specimen with Ti–Y–O–rich clusters and three synthetic datasets. The test case addresses the accuracy of the clustering analysis package OPTICS-APT (Wang et al., Reference Wang, Schreiber, Bailey, Hosemann and Toloczko2019b), which is based on the OPTICS algorithm (Ankerst et al., Reference Ankerst, Breuning, Kriegel and Sander1999), via synthetic data. In addition, the real APT dataset is intended to test the algorithm's capability to detect clusters with varying effective atomic densities, where conventional single threshold-based methods are challenged. The test case is one example of recent efforts from the PNNL group to develop FAIR methods for analyzing solute clustering on APT dataset (Still et al., Reference Still, Schreiber, Wang and Hosemann2021).
2. Clustering UoM (University of Michigan) contains a synthetic dataset with compositional gradients and instantiated clusters. The test case addresses the accuracy of hierarchical density-based clustering (CHD) (Ghamarian & Marquis, Reference Ghamarian and Marquis2019) in comparison to the maximum separation method (MSM) (Hyde & English, Reference Hyde and English2000; Hyde et al., Reference Hyde, Marquis, Wilford and Williams2011). MSM is a specific DBScan variant (Ester et al., Reference Ester, Kriegel, Sander and Xu1996). The test case is based on Ghamarian & Marquis (Reference Ghamarian and Marquis2019).
3. Clustering USYD (University of Sydney) reports on how to execute two clustering algorithms reproducibly via a cloud-based analysis platform called Atom Probe Workbench (CVL) (Ceguerra et al., Reference Ceguerra, Stephenson, Apperley, Goscinski and Ringer2014). The test case exemplifies how to perform clustering methods from the literature (Stephenson et al., Reference Stephenson, Moody, Liddicoat and Ringer2007; Chen et al., Reference Chen, Wang, Shan, Ceguerra, Huang, Dong, Cao, Ringer and Liu2018).
4. Composition Z-score test USYD details, also within CVL, how to execute reproducibly a Z-score test. The test case is based on Stephenson et al. (Reference Stephenson, Ceguerra, Li, Rojhirunsakool, Nag, Banerjee, Cairney and Ringer2014).
5. Contingency table USYD details, also within CVL, how to reproducibly build a contingency table. The test case is based on Moody et al. (Reference Moody, Stephenson, Liddicoat and Ringer2007).
6. Composition quantification UKAEA (United Kingdom Atomic Energy Authority) presents a set of realistic-looking but synthetic data (ground truth known) to test any composition measurement techniques against. A method for replicating the synthetic data is also given to expand the test case in the future.
7. Composition quantification USYD is a test case which exemplifies how different ranging methods affect composition analyses. Results are exemplified for a dataset from a measured bulk metallic glass (BMG) specimen. The test case supplements research on bulk metallic glasses (Nomoto et al., Reference Nomoto, Ceguerra, Gammer, Li, Bilal, Hohenwarter, Gludovatz, Eckert, Ringer and Ruzic2021).
8. Composition analysis Leoben contains a measured dataset of a S690 steel specimen with a grain boundary segment and a precipitate as microstructural features. The test case exemplifies how one-dimensional composition profiling at a grain boundary is typically performed. The test case is based on Cerjak et al. (Reference Cerjak, Mendéz-Martín and Domakova2017).
9. High-throughput analyzing MPIE (Max-Planck-Institut für Eisenforschung) reports how the dataset of the Leoben test case was used to develop two new open-source tools for high-throughput analyses of APT datasets. Developed while drafting the present paper, these tools enable researchers to characterize nanoscale composition variations to compute iso-surfaces and to calculate the distance of an atom to geometric primitives using methods from computational geometry. The tools make accessible methods which have hitherto been available exclusively within commercial software as a conceptually similar implementation which builds entirely, though, on open-source code from various researchers and uses software parallelization. The test case adds tools to a recently developed software toolbox for processing point cloud data (Kühbach et al. Reference Kühbach, Bajaj, Zhao, Çelik, Jägle and Gault2021), the functionalities of which will be discussed in a forthcoming publication.
10. Proximity histogram UKAEA contains a synthetic dataset that is useful for verifying the implementation of algorithms computing so-called proximity histograms (Hellman et al. Reference Hellman, Vandenbroucke, Rüsing, Isheim and Seidman2000). Specifically, the test case addresses the difficulty of how to test the proximity histogram implementation within the Integrated Visualization and Analysis Suite (IVAS). This software is an earlier commercial one that is now officially replaced by AP Suite but has been still in use during the time of writing this paper by many atom probe groups worldwide. The test case supplements the recent efforts of the author towards proposing more accurate composition analysis methods (Keutgen et al. Reference Keutgen, London and Cojocaru-Mirédin2020).
Discussion
Case-by-Case Analyses of the Submitted Test Cases
Strategy and Guiding Questions
To discuss what we can learn from the individual test cases, we use the following questions as a guide to our assessment:
1. How completely did the authors fill in the template?
Is the provided template thorough and understandable by other APT experts?
2. What is the objective of the test case/analysis?
What is the main message of the test case?
What are the analysis challenges tackled in this test case?
3. How can we ensure the validity of the test case itself?
4. What would be required if one wishes to reproduce the analysis via e.g. running the same analysis using the same dataset (from the test case) or applying it on different datasets?
5. How does this test case provide assistance?
6. Which future work does the test case suggest to be of relevance to align better with the aims of the FAIR data stewardship principles?
First, we summarize key examples of how the test cases address these questions. This can raise awareness what, and foremost why, seemingly irrelevant settings and parameters are in fact very relevant when we wish to verify the analysis results of a particular software and want to offer a more complete documentation of metadata to our work in terms of the FAIR principles.
Thereafter, we will summarize the common points and conclude practical next steps how individual researchers and the community can improve together via inter-laboratory and interdisciplinary research towards building a community-driven FAIR data sharing and AI-ready analysis platform for APM.
Clustering PNNL (Test Case 1)
The authors filled in the template, delivered the associated datasets as POS and RRNG files, and made the OPTICS-APT source code public (Wang et al., Reference Wang, Schreiber, Bailey, Hosemann and Toloczko2019a). The template supplements Figures 5 and 9 of the original paper (Wang et al., Reference Wang, Schreiber, Bailey, Hosemann and Toloczko2019b). The authors characterized the location, shape, and chemical composition of clusters of varying atom-species-density with these clusters embedded in a point cloud of different atom species with each showing spatial density variations. The goal was to demonstrate the effectiveness of the OPTICS-APT package in detecting clusters with varying effective atomic densities of solutes and test the accuracy of the said algorithm. The test case supports the results of Hornbuckle et al. (Reference Hornbuckle, Kapoor and Thompson2015) and Barton et al. (Reference Barton, Hornbuckle, Darling and Thompson2019) showing that conventional iso-surfacing using a single, so-called global threshold, applied on the entire dataset, makes it difficult to detect clusters with different solute concentrations. The test case substantiates that for such a task using localized values and taking results from the OPTICS algorithm into consideration has advantages.
As APT is a destructive microscopy method whose objective lens is the specimen, the reconstructed atom positions are always only a model of the original atomic arrangement. Given that there is no hint that correlative microscopy methods were applied prior to or during the APT experiment, we can conclude that there is no ground truth validity for the experimental dataset. For the synthetic data, by contrast, the test case details the atomic positions and the synthesis recipe. This recipe, though, is only an implicit description of which atoms belong to which cluster. Given that OPTICS-APT is a collection of Python scripts which internally rely on in-build Python packages, one would only get the same atom positions and cluster labels if one uses the same source code, the same settings, and the same version for the relevant third-party software packages inside Python. Often it is required to compute random numbers for placing objects at quasi-random locations.
For this placing, at least one so-called pseudo-random number generator (PRNG) is used (Gentle, Reference Gentle2003). A PRNG creates random sequences via a deterministic algorithm. This requires an initialization with a seed value. There are two options to initialize the seed. Either the PRNG is initialized with the system clock or via setting an explicit value for the seed based on a reproducible deterministic algorithm. Documenting the seed is essential as otherwise the results are not reproducible even though one has the same source code and uses the same software packages. Whether missing documentation about which seed value was used is relevant or not does depend on the research question: Datasets which are created with different seeds are statistically similar realizations generated by sampling. Only with fixed seeds, we can assure that two datasets are reproducibly the same numerically, i.e. all atoms are at the same place and the clustering algorithm assigns each atom the same label in repeated analyses.
We learn from this example that test cases for clustering methods should ideally report not only atom positions but also the cluster label for each atom. Furthermore, authors need to document which randomization methods were used and how the seeds were defined. The same arguments also apply when we randomize labels prior to the computing of spatial statistics.
The authors delivered their source code but did not specify further the script or workflow how the software tools were then used to create the figures. We learn that authors should make use of services which document this workflow and the associated metadata of an analysis.
The authors stated they used IVAS and default settings for analyses within the GUI of this commercial software. This is a common situation especially in the discovery phase of analyzing. However, default settings between software versions (can) change and more subtle, implementation differences between software versions, can lead to a different interpretation of the default settings and thereby display different numerical results.
Therefore, we learn it is pointless to state that default settings were used or, equally pointless, to omit descriptions of used default settings and software versions in a research paper. Instead, reproducible research requires a documenting of settings and versions, ideally in a standardized form as supplementary material. If this is not possible in all details, for instance, because proprietary software was used, at least one needs to specify the software version and build number to put other researchers at least in a position where they can assure to work with the same software installation. Noteworthy, this carries still the potential that third-party software dependencies are not properly documented and hence numerical results can still be inconsistent when the same software is rolled out in different laboratories.
Here, software companies which deliver proprietary software can assist researchers in the future not only with delivering their customers a manual of the software but through implementing in addition continuous logging functionalities for the internal processing details. These logging functionalities can be supplemented by transparent interfaces, like advanced programming interfaces (APIs), to access and/or exchange data. Offering access to such metadata is a compromise if the source code of the tool itself is not open.
From a broader perspective, a change of culture among researchers and sponsors will be needed for not only simply sharing but also ensuring that software tools implement robust protocols and a documentation of these. For developers of open-source software who wish to assist researchers on their mission, it takes more than uploading of code and datasets to online repositories. Instead, developers should make sure that their code is version-controlled. Even better is to deliver ready-to-use versions of software through e.g. community-driven data sharing and analysis services. These services can offer containerization to present ready-to-use instances of specific versions of an analysis tool. Test cases are one resource which such a service should host to document a research study.
In Figures 1 and 2 of their test case (see Fig. 1c), the authors compare visually which atoms belong to which cluster. The comparison leads the authors to conclude that falsely connected clusters with nonphysical appearance exist. This example shows why a stronger formalization of visual analyses, like most often created in the discovery phase, is needed. Almost certainly some of the clusters identified by the authors are connected but this is difficult to ascertain exclusively based on a visual inspection of the figure in a publication, especially, when the data are higher-dimensional. Sharing the dataset and associated cluster labels openly would offer more detailed analyses such as spatially correlative analysis of the objects and their geometry and thereby to support the discovery phase. These limitations motivated the author of case study 9 to develop a tool for spatial correlation analyses of three-dimensional objects, which will be reported on in a follow-up paper.
We learn that more quantitative tools instead of exclusively relying on the convincing appearance of visual inspections have to be developed to compute spatial correlations between clusters or to compute which clusters delivered by method A match how close to neighboring clusters of method B. Thereby, one could identify the geometry of the clusters and detect eventual percolation events or differing label assignments. For this task, documented cluster labels for each atom are needed. The test case is of interest for researchers to understand the capabilities and limitations of the OPTICS-APT clustering method and give developers access to verification data for comparing different clustering methods.
The test case should be made available in an online encyclopedia of experimental material science data, and ideally be compared to results obtained from other clustering algorithms. If performed manually, these studies are very tedious because one needs to set up an infrastructure where different analyses can run in a controlled and reproducible environment. The development of online services could help in this regard with democratizing such studies to a much broader audience, coming not only from APM.
Clustering UoM (Test Case 2)
The authors instantiated a synthetic dataset with clusters of varying atom-species density embedded in a point cloud of atoms. The composite has multiple regions with different density for the species. Taking this dataset as the ground truth data, the authors compared how the CHD-detected clusters compare with the MSM-detected clusters and the ground truth. The results substantiate the CHD method recovers clusters closer to the ground truth data than does MSM.
The authors submitted a test case with POS and RRNG files, the source code of the Matlab scripts, and the original intermediate files, which the authors created with their scripts. The intermediate files resolve a cluster label for each atom and can thus be taken as ground truth data. In this format, the test case communicates detailed metadata. We learn that publishing software and (meta)data files as they accrue in either analysis phases (discovery phase, exploratory phase) improves the (meta)data coverage.
We know of cases from our colleagues who store cluster labels in fields, which should by definition, hold a different quantity. The column for mass-to-charge-state ratios within POS files is one example. Such hijacking of data columns is not only dangerous in terms of data consistency but also inefficient in practice because cluster labels could more efficiently be stored. A more efficient approach is to store key-value mappings where each key names a disjoint cluster label (ID) and the respective values for the same key the ion evaporation sequence IDs. This would avoid storing duplicated labels. Examples for atom-species labels in paraprobe have already shown that such storing of atom-to-cluster labels is more efficient (Kühbach et al., Reference Kühbach, Bajaj, Zhao, Çelik, Jägle and Gault2021).
We suggest that standardization can help and software libraries be used for these parsing and transcoding tasks. Libraries such as libatomprobe (Haley & London, Reference Haley and London2020a, Reference Haley and London2020b) or paraprobe (Kühbach et al., Reference Kühbach, Bajaj, Zhao, Çelik, Jägle and Gault2021) could assist users with this task. Ideally, both of these tools should be interfaced with web-based services. For experimentalists, this would have the advantage of getting simplified access to these tools, a removal of error-prone setup procedures where software has to be compiled, and improved reproducibility because of a consistent deployment of versioned software tools.
Clustering & Contingency Table & Composition USYD (Test Cases 3, 4, 5)
For all three test cases, the authors did not fill in the template but instead submitted step-by-step manuals with screenshots. These manuals describe how to execute specific clustering algorithms (Stephenson et al., Reference Stephenson, Moody, Liddicoat and Ringer2007; Marceau et al., Reference Marceau, Stephenson, Hutchinson and Ringer2011), binomial-style composition analyses, and Z-score tests. All test cases are hosted on the CVL, a cloud-based service for atom-probe-microscopy-specific data analysis (Ceguerra et al., Reference Ceguerra, Stephenson, Apperley, Goscinski and Ringer2014) maintained by the Sydney APT group.
Like the previous clustering test cases, the present test cases are relevant for researchers who wish to characterize the location, shape, and chemical composition of clusters. Specifically, the test cases cover the situation where clusters have varying species-density and are embedded in a point cloud of different atom species with each species showing spatial density variations.
Test cases on a cloud-based service have the advantage that analyses are reproducible as long as the underlying computing system keeps track of the hardware configuration and the software packages. Researchers should expect from such a cloud-based service an internal bookkeeping system with transparent interfaces to offer the users metadata management and tools. Otherwise, a cloud-based service is not more transparent than an opaque commercial software tool.
We learn from the CVL-based test cases that cloud-based services can offer a level of reproducibility difficult to achieve with individual installations of software and scripts running on local computers of individual researchers. However, this holds only as long as certain boundary conditions are maintained: The service is available ideally 24/7 and the service is accessible to as many experimentalists as possible. The service internally needs to implement analysis steps with logging and code versioning and communicate the metadata transparently to users.
Offering a service with such sophistication plus provisioning of computing time, while all is hosted and maintained by a single laboratory face challenges: One is that the infrastructure has to be financed which becomes more problematic the more computing time and storage demands the users request, i.e. how frequently and useful the service is for a broader community. Another challenge is knowledge drain and knowledge transfer gaps associated with building and maintaining such services, given that these tasks are often delegated to (PhD) students or postdocs. They have to work often at the same time on challenging scientific tasks for their career building. Instead, these tasks demand a portion of expert knowledge and capability to take on system administrator or software developer roles. This requests for different sets of skills than what many microscopists are used to and trained for. This is an observation we made also for other microscopy communities. However, in contrast to larger communities like those in the life sciences, it is eventually more difficult for small communities to get the chance to allocate funding to enable them a focused outsourcing of such key infrastructure tasks to software engineers. We are convinced here it requires international inter-laboratory and interdisciplinary research activities surplus an adjustment of research funding schemes.
As FAIR data management demands becoming stricter, we need a re-evaluation and commitment of the atom probe community: The community should decide whether to build and offer these services themselves or should they team up with and contribute in multi-disciplinary research data management activities? The here presented status quo of use cases supports why participating in multi-disciplinary activities rather than staying isolated or relying on solutions by the instrument manufacturers alone is in our opinion the wiser next step to take.
The three USYD test cases (3, 4, 5) teach us another lesson. There are still many manual procedures in place where data are copied between spreadsheets. This is an error-prone task. We learn that this is where individual researchers can make a contribution and improve their programming skills, by developing open-source scripts, for instance, in Python, and share these with the community, ideally deployed as tools inside research data infrastructure services.
Composition Quantification UKAEA (Test Case 6)
The authors submitted the template filled in with a brief description of their method and added a supplementary presentation for the details.
The motivation of the test case is that the accurate measuring of the composition based on atom probe data is critical for further analysis. While it is generally accepted the time-of-flight mass spectrometry method has universal sensitivity to all elements equally (owing to the use of microchannel plates with sufficient ion energies Fraser, Reference Fraser2002), in any atom probe experiment, there are many factors which can affect the compositional accuracy. Some factors affecting the composition measurement depend on the nature of the specimen and its geometry and these are neither well known nor controlled—rendering independent specimen calibration difficult. Analyzing composition appears simple: First, we identify the (molecular) ions and isotopes. Second, we extract the counts from the time-of-flight peak. Third, we quantify the composition as the count of each element divided by the total number of counted ions. But in each of these steps, there are complications: peak identity may be uncertain or there can be peak overlaps. There are many methods of extracting peak counts (local background subtraction and ranging, peak fitting models, windowing) each with their own considerations, metadata, and error propagation. Quantification is also complicated by molecular species and peak overlaps.
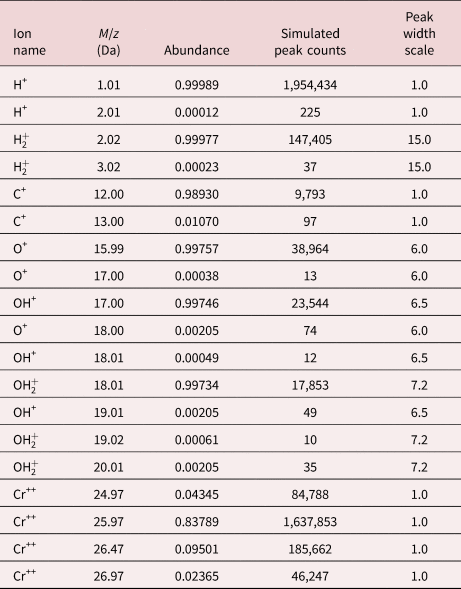
The objective of the test case is to present a set of realistic-looking but synthetic data (ground truth known) to test any composition measurement techniques against. Table 1 summarizes the contributions to the synthetic mass spectrum.
Table 1. Selection of Ground-Truth Simulated Data Detailing the Position, Expected Abundance, Exact Counts of Each Isotopic Peak, and the Relative Width (in Time-of-Flight Space) of the Peak.
Mass spectra are given where the test-specific issues are observed like those in real data:
• Global background subtraction
• Peak identification (range of signal-to-noise)
• Elemental and molecular ions
• Direct peak overlaps
• Local background subtraction or peak shape (fitting)
• Different peak shapes between mass spectra
• Varying peak shapes for different ions within one spectrum
Additionally, the user may wish to match expected uncertainty, arising from counting error, with measured estimated uncertainty. In this case, the peaks with low intensity and which background subtraction model is used for low signal-to-noise peaks becomes important.
The author of the test case suggests it is useful to set a precedent for checking the accuracy of composition quantification algorithms via running a composition quantification algorithm against a synthetic mass spectrum. We can learn from the author's arguments in favor for such a precedent: when there is a number of composition quantification methods in the community and the source code to all of these is not open, it would at least be useful to have a tool with which the implementations can be tested against the precedent. While this is empirical testing rather than formal verification, it could be possible to identify shortcomings of an algorithm as we know what the result should be for ground truth data.
The test case delivers a detailed accounting of challenges associated with ranging. The author makes detailed suggestions on which metadata should be stored with every composition measurement to improve reproducibility. In particular, we should:
• Store the mapping between time-of-flight data and mass-to-charge-state ratios.
• Store the multiplicity of the ions and detail eventual filters acting on which multiples are composed into a mass spectrum.
• Store how we are binning the mass-to-charge-state ratio array to a histogram.
• Store the background quantification model, i.e. which algorithm was used, what were the parameters of this algorithm, and document how many iterations were performed with which parameters in each step if the algorithm is an iterative one.
• Store the peak search algorithm (which algorithm, which parameters).
• Detail signal smoothing steps including kernel type, kernel size, offsets, strides, smoothing model, and store these values for each iteration.
• Store all identified peaks and document their identity. Often peaks of elemental ions are labeled with the names or symbol of the respective element. For molecular ions there are multiple choices: Combinations of element names and isotope specifications are useful (e.g., $[ {}^{2}{\rm H}_{2}^{16}{\rm O}] ^{ + }$). Internally though, ion identities should be better encoded as a vector of hash values because it is possible to represent every known isotope by a pair of proton Z and neutron N number. The nuclid table identifies that Z and N are smaller than 256. This allows each isotope to be identified with the following hash value Z + 256 · N. From such an efficient representation of every known isotope (stable and radioactive ones), it is possible to unambiguously recover Z and N. Thus, a sorted array of (unsigned) integers plus an additional (unsigned) integer for the charge state is a viable option to store a hash vector representing arbitrary ions. For the above example of a deuterated water ion, we obtain [8 + 256 · 8, 1 + 256 · 1, 1 + 256 · 1, + 1]. N should be 0 in cases when we want to specify the elements only.
• Store for all identified peaks the left and right bound of the mass-to-charge-state-ratio interval within which we label all ions with this peak label.
• Finally, we should store the normalization procedure to document whether we refer to composition or concentration values.

We learn from this list which metadata a reproducible composition analysis should ideally include. Comparing to existent range file formats (RNG, RRNG, or ENV) reveals these store insufficient details. Here, standardization efforts are needed involving the instrument manufacturers, and foremost the APM community. The above list can assist the search for a more covering range file format. An example of storing ions using hash values inside the Hierarchical Data Format (version 5) (HDF5) files has been proposed (Kühbach et al., Reference Kühbach, Bajaj, Zhao, Çelik, Jägle and Gault2021). We learn from the test case that this proposal, though, needs extension in light of the above-detailed metadata.
Test cases such as this one provide assistance because they highlight there are issues with present composition analysis techniques when using and comparing multiple algorithms against ground truth data. The author suggests that sharing synthetic mass spectra as test cases (or standards) openly enables the community to host them on a public repository. In combination with a user management system plus a collection of web-based services for performing such composition analyses on datasets inside the repository, experimentalists could pit their method against these test cases, and profit from a much larger pool of training data than available to individual laboratories.
Such a service can assist experimentalists with the documentation of their analyses. Even more important is that the results could be shared with other communities to help these communities to find more accurately and more precisely performing algorithms. This would open the possibility for Kaggle-type benchmarks, in the spirit of Sutton et al. (Reference Sutton, Ghiringhelli, Yamamoto, Lysogorskiy, Blumenthal, Hammerschmidt, Golebiowski, Liu, Ziletti and Scheffler2019), for APM. Such online benchmark collecting is common in machine learning and data science communities and has helped these communities to advance and speed up the development of algorithms and methods in a FAIR manner using AI-ready tools. We are convinced this can be a promising strategy as well for atom probe microscopists.
Composition Quantification USYD (Test Case 7)
The authors filled in the template. They delivered the POS file of the dataset plus a RRNG file for each of their three ranging results. Within the research study from which this test case was taken, the authors investigated how composition is affected by different ranging methods. Specifically, three methods were compared for the same dataset—full-width-at-half-maximum, background-to-background, and peak-based ranging. The findings support the conclusions from the UKAEA test case 6. We cannot independently verify the validity of the results because the test case works with a measured dataset rather than a synthetic ground truth. We learn that not only the fraction of ions differs substantially between ranging methods but also the compositions as computed from decompositing ions into their elemental contributions. Therefore, it should not only be common practice to compare different ranging methods on each dataset routinely as a part of the exploratory phase of a study but especially to report these results as well. One way of reporting is via supplementary material using standardized forms. In reality, though, an inspection of the APM literature reveals that often studies report one composition and leave it with statements that default methods were used for ranging.
The test case details another problem with reported ranging definitions: Often authors do not detail their reasoning for labeling the peaks in the manner reported. We learn that applying FAIR principles to APM demands a detailed specification of the assumptions why certain peaks are identified. Especially in cases where the theoretical positions of the peaks are within the mass-resolving limitations of the technique these are critical assumptions worth to be included in our opinion in every supplementary material at least.
Here is where open data analysis platforms, which could implement existent AI tools for ranging mass spectra from atom probe experiments (Vurpillot et al., Reference Vurpillot, Hatzoglou, Radiguet, da Costa, Delaroche and Danoix2019; Mikhalychev et al., Reference Mikhalychev, Vlasenko, Payne, Reinhard and Ulyanenkov2020; Wei et al., Reference Wei, Varanasi, Schwarz, Gomell, Zhao, Larson, Sun, Liu, Chen, Raabe and Gault2021), plus integration of tools for enumerating all possible labels (Haley et al., Reference Haley, Choi and Raabe2015), can assist users. This would support which label is more likely biased by trained-in bias of the AI method or by subjective bias of a human operator who ranged manually.
Pitting the documentation against the list of ranging metadata from test case 6, we learn that authors need to specify more details in order to document a reproducible ranging process. For this aim, the recommendations made in test case 6 could serve as a guide for improving best practices. The authors of the test case 7 performed their investigation using IVAS and AP Suite. However, as it was mentioned already for the clustering test cases (1, 2, and 3), this is not informative enough.
Composition Analysis Leoben (Test Case 8)
The authors filled in the template and added an exemplar analysis to one of their specimens from the Cerjak et al. (Reference Cerjak, Mendéz-Martín and Domakova2017) study. The authors submitted the associated original datasets as POS and RRNG files, respectively. The test case is a typical example of the use cases with which atom probe microscopists characterize nanoscale composition variation at crystal defects. In fact, solute segregation and build-up of solute composition gradients at dislocations, stacking faults, or grain and phase boundaries, have multiple implications on static and dynamic properties of the defects and thus on material properties.
A standard workflow is to use commercial software and manually place a collection of regions-of-interest (ROIs), such as cylinders, cuboids, or spheres, at or across the defects and characterize how the composition, or concentration respectively, of specific atom-species changes as a function of distance to a reference position in the defect. This was also the case here, with a reconstruction built from a real measurement. The authors mentioned they performed transmission Kikuchi diffraction measurements in a scanning electron microscope but submitted no associated results with the test case which could additionally validate their reconstruction.
We learn from an inspection of the test case that limitations exist with respect to how comprehensive a description of GUI-based composition analyses using ROIs in APM can be. Reflecting the test case with the author team enabled to recover most of the steps which the authors performed: Using IVAS v3.6.6, they first rendered point clouds of the species they were interested in (C, Mn, Cr, and P) and placed cylindrical ROIs using default settings. Key settings of this GUI interaction (barycenter, height, radius, and orientation of the cylinder axis) were displayed in the GUI during the discovery stage. Faced with this manual process, though, the above metadata were not exported individually. Writing a script to parse out content from the commercial software can be a more efficient and accurate solution than documenting such settings manually as it was shown recently by Rielli et al. (Reference Rielli, Theska, Godor, Stanojevic, Oberwinkler and Primig2020). Given that these scripts work at the operating system level, though, such a solution has a similar dependence on system configuration like faced by scripts or compiled software.
We learn that limited ease and coverage for exporting metadata and associated numerical data when using GUI-based analysis tools is an effective barrier to the implementation of the FAIR principles. Realizing, though, that most of these metadata are tracked by commercial software, extending the sophistication of these logging functionalities and offering export functions, ideally through APIs, can help to remove this unnecessary roadblock for collecting metadata.
With their test case, the authors deliver also the results of interfacial excess computations. These were computed with a procedure where data were manually copied between tools (IVAS, Origin, or Excel). We can only repeat our suggestion to replace such spreadsheet-based procedures in the future with scripts for adding more transparency and easier reproducibility.
Solute segregation is a three-dimensional process, thus can lead to three-dimensional composition patterns. It is possible to characterize these patterns using differently oriented one-dimensional composition profiles. We learn from the test case that software development and automation would simplify the workflow when taking such profiles and thus serve uncertainty quantification. The next test case takes a step in this direction.
High-throughput Analyzing MPIE (Test Case 9)
The author filled in the template and contributed data files with the computational geometry results and associated metadata. The author used the dataset of test case 8 for developing software for high-throughput uncertainty quantification of iso-surface-based methods and spatially analyzing the point cloud data. Specifically, two open-source tools were developed to supplement the paraprobe toolbox (Kühbach et al., Reference Kühbach, Bajaj, Zhao, Çelik, Jägle and Gault2021). One tool enables the computation of iso-surfaces from point clouds resulting in a collection of triangles representing a discrete approximation of the iso-surface. This tool enables an exporting of the triangles and subsequent computational geometry analyses such as a clustering of the triangles based on their connectivity to identify interfaces in the interior of the dataset. Furthermore, this tool implements functionality for meshing and automated placing and orienting of ROIs at triangles of meshed objects inside the dataset or placing of optimal bounding boxes about these objects in the spirit of Rielli et al. (Reference Rielli, Theska, Godor, Stanojevic, Oberwinkler and Primig2020). Another tool enables efficient parallelized computations of exact distances between all atoms to arbitrary triangle collections. These tools were used to characterize the sensitivity of iso-surfaces for specific atom species as a function of the iso-value. The test case exemplifies how researchers can study which geometrical implications the sensitivity of the iso-surface on the iso-value has for the identification of objects inside the dataset. These objects with eventual significance for microstructure-property relationships can then be meshed. Furthermore, the work exemplifies how ROIs can be placed using automated methods.
For the dataset of test case 8, the test case delivers a refined analysis which quantifies which challenges composition analyses can face: These are a low number of a certain atom species locally, i.e. finite counting effects. We learn that these effects need to be reported with every study. We also learn that automation can support researchers in the exploratory phase to track local composition variations.
The newly implemented software tools track metadata internally and report these automatically. Examples include where ROIs are placed, how large these are chosen, how the ROIs are oriented, and which composition profile each ROI has. An open-source implementation makes the algorithms transparent and customizable. We understand the potential and efficiency of such compiled software tools but would also like to address their limitations.
Software which takes advantage of advanced scientific computing methods, especially when the source code has to be compiled, as it is the case for instance with C/C++ or Fortran, faces a higher entry barrier than do (Python) scripts. Even if individuals equip advanced tools with methods for tracking metadata, the perceived barrier can be too high to use these methods. The test case teaches us that these tools could better find their place as components of the back-end of web-based data analytics platforms. This would democratize the usage of such tools because users then no longer have to perform compilation or installation processes, could profit from performant best practice tools, but use at the same time a toolkit with openly accessible source code.
We learn that barriers towards FAIR APM are often rather psychological ones than technical ones where ease of use beats robustness. On the one hand, developers of software should take the desire of having low entry barriers seriously. On the other hand, our experiences with high-throughput methods like this test case 9, or the methods reported in Kühbach et al. (Reference Kühbach, Bajaj, Zhao, Çelik, Jägle and Gault2021), support that critically reflecting ones established manual data postprocessing methods offers the chance to make the research process more reproducible and for some parts substantially more efficient.
Proximity Histogram UKAEA (Test Case 10)
The authors filled in the template to a level that the steps of the analysis were summarized and references to the dataset and results made. The authors used IVAS v3.6.6. The objective of the test case was to test the accuracy of the proximity histogram method for a configuration of atoms where one knows an analytical solution for the problem. Proximity diagrams, also called proximity histograms, Hellman et al. (Reference Hellman, Vandenbroucke, Rüsing, Isheim and Seidman2000) report typically one-dimensional profiles across an interface as a function of the signed distance to an interface. Proximity diagrams are frequently used in the APM literature and especially frequently used in the exploratory phase.
The computation of proximity diagrams is problematic, especially when using black-box algorithms, because it is necessary to specify how the sign of each distance is computed. One case where this is robustly possible are profiles which cut through surfaces of closed objects so there is for each point on the interface, or surface of the object respectively, a defined signed surface normal vector. Examples are spheres and ellipsoids or convex polyhedra. However, the supplementary material to test case 9 substantiates that when objects are built from local sub-sets of iso-surfaces, it is possible that the surface contains holes or tunnels.
In such cases where consistently oriented, i.e. signed, surface normal vectors were (or can) not be recovered, it is necessary to evaluate the directions of gradients of the underlying scalar composition or concentration field from the discretization, while taking into account the delocalization, of the point cloud. Given that a scalar field can have point sources or saddle-point configurations, though, it might not be possible in all cases to define consistently oriented normal vectors. In effect, projecting normals on gradient vectors of the field can be an ill-posed task; and therefore the computation of proximity histograms becomes at least locally an ill-posed task.
We learn that there comes no guarantee with computing a proximity histogram with consistent distances for arbitrary datasets with arbitrary variations of compositions for specific atom species. For this reason, atom probe software tools should be equipped at least with export functionalities which enable users to retrieve the geometry and the location of the surface meshes, or triangle soups respectively, based on which the normals and distances were computed. Also, it should be possible to export the scalar fields of elemental or molecular ion composition (or concentration) to perform additional validation.
The author of this test case reported a key challenge for improving the test case was missing functionality for importing a given configuration into e.g. IVAS or AP Suite. Specifically, an option for loading mesh data into commercial software would be useful to offer a chance for comparing how analytical expectation and computed result match. We want to stress here that this test case substantiates that empirical testing of software has challenges. All users of proximity histograms should be aware of these challenges. One should use proximity histograms only, if users can reproducibly assure (for instance via using robust algorithms from computational geometry) that normals are consistent.
These findings support previously reported empirical suggestions by Martin et al. (Reference Martin, Radecka, Sun, Simm, Dye, Perkins, Gault, Moody and Bagot2015), Hornbuckle et al. (Reference Hornbuckle, Kapoor and Thompson2015), Barton et al. (Reference Barton, Hornbuckle, Darling and Thompson2019), and Larson et al. (Reference Larson, Prosa, Ulfig, Geiser and Kelly2013) stating that iso-surface-based methods and proximity diagrams have to be used carefully and inspected in detail if using a single (global) iso-value for a dataset is suited for the research question.
The high-throughput tools developed within the course of test case 9 implement a workflow for transforming iso-surfaces for a complete dataset in such a way into clusters of iso-surfaces that one can identify which clusters of triangles are closed polyhedra and which clusters of triangles result in self-intersecting meshes or objects with holes or tunnels in the surface mesh. Thereby, the tools can at least help with identifying for which objects a computation of proximity histograms is substantiated and for which it is problematic. Software developers of commercial or open-source tools for atom probe can learn from the computational geometry test cases 9 and 10 inasmuch as they should transparently document the details of computational geometry methods, including details how signs and distances were computed, and which metrics were used. The tools of this use case are currently being extended to enable spatial geometry analyses of objects using computational geometry methods. This will be a topic of a follow-up paper.
Additionally Relevant Metadata when Defining Test Cases
Implicit Reporting of ROIs
There are cases in the APM literature where the authors remain vague with respect to the regions-of-interest investigated. We suggest to always store which atoms were included in a region-of-interest. If the ROI is the entire dataset—a common default—a short comment is needed and sufficient clarification. For arbitrarily shaped regions-of-interest of arbitrary dimensions, boolean masks are a particularly efficient solution as these can be implemented as fields of bits and for typical ROIs are highly compressible. Again this substantiates why standardized libraries are useful for APM.
Limitations of Unorganized Collections of Supplementary Material
Unorganized collections of analysis results such as a folder structure with open files and scripts but without detailed annotations face the challenge that users need to familiarize themselves with the folder structure and the scripts of others before they can productively use the test case. Interpreting individualized folder structures and naming schemes is difficult for machines; and thus an effective barrier against meeting the FAIR principles, despite the fact that the test case is open source. In addition, a numerical reproduction of these results is hampered by the fact that especially when scripting languages like Python or Matlab are used, researchers often heavily rely on in-built functions. Therefore, either a more standardized way of storing or a parsing of the individual content in dataset collections into a stronger formalized form are possible strategies to make test cases reproducible and more useful.
We learn that other than dumping a collection of open-source datasets into community- and method-agnostic online repositories like Zenodo (Wilkinson et al., Reference Wilkinson, Dumontier, Aalbersberg, Appleton, Axton, Baak, Blomberg, Boiten, da Silva Santos, Bourne, Bouwman, Brookes, Clark, Crosas, Dillo, Dumon, Edmunds, Evelo, Finkers, Gonzalez-Beltran, Gray, Groth, Goble, Grethe, Heringa, ’t Hoen, Hooft, Kuhn, Kok, Kok, Lusher, Martone, Mons, Packer, Persson, Rocca-Serra, Roos, van Schaik, Sansone, Schultes, Sengstag, Slater, Strawn, Swertz, Thompson, van der Lei, van Mulligen, Velterop, Waagmeester, Wittenburg, Wolstencroft, Zhao and Mons2016), preference should be given to the development of easily accessible encyclopedia formats. These should be eventually supplemented with an automatic parsing process plus tracking of the data provenance graph to simplify knowledge transfer and increase the value of a test case beyond the original study. Such tools can assist scientists with organizing their data and help them in turn to better understand the workflows of others. Given that building such infrastructure is more difficult than uploading data, it becomes clear why inter-laboratory action and community-driven development is needed and can be rewarding.
Suggestions for Reducing Individual Efforts through Community Efforts
We discussed specific examples of the status quo on the reproducibility of software tools and analyses via test cases within the APT literature. We identified that a more complete recording and motivation to report and share metadata is needed. Collecting these metadata binds time of individual researchers as does the writing of documentations for software. Overall, it is a tedious process. This makes the necessity to invest time a strong barrier against delivering test cases and FAIR APM.
To reduce these expenditures for individual researchers, a combined and more frequent usage of web-based documentation tools (e.g., Holscher et al., Reference Holscher, Johnson and Robenolt2021), source-code annotation tools (e.g., van Heesch, Reference van Heesch2021), notebook-based documentations of workflows, and usage of electronic lab notebooks (e.g., Carpi et al., Reference Carpi, Minges and Piel2017) can help. These tools come with a learning curve so additional strategies are needed to reduce the individual efforts which scientists have to invest.
Another strategy to reduce documentation effort is to focus on and eventually maintain a smaller number of software tools within the APM community. These tools should be developed cooperatively rather than in competition to share the documentation and implementation efforts. An additional, and eventually even more effective, reduction of the documentation workload for individual researchers could come from building a community-driven, and web-based, service.
A noteworthy point is that open sharing of datasets faces challenges when sensitive results accrue, for instance, in industry collaborations. In such case, agreeing on data embargo periods can be a win–win solution for both parties. From an infrastructure point of view, a hashing of files is another opportunity to increase credibility and reproducibility even though the actual datasets are not shared. The International Field Emission Society's (IFES) Atom Probe Technical Committee (APT TC) (Haley et al., Reference Haley, Ceguerra, Kühbach, London, Oberdorfer, Radiguet, Reinhard and Isheim2021a) is a partner where atom probe microscopists can find assistance on such technical questions.
We learn that the case of opaque methods in commercial software needs specific action which is beyond the capabilities of individual authors or even individual research groups. We are convinced an inclusive approach is needed: Instrument manufacturers need to understand and respect which increased level of data and method openness the funding agencies expect nowadays; and thus which level of FAIR-readiness researchers have to deliver with their publications. Equally, it needs discussions at a political level which financial compensations could be offered to instrument manufacturers and software companies in exchange for opening up opaque tools as part of business models to remove barriers to FAIR research data management.
The results of the inter-laboratory call for test cases enabled us to identify a collection of specific tasks which the APM community can address in the future to make their computational methods more rigorous, more accessible to colleagues, and to support a community-driven process towards becoming more descriptive with respect to FAIR and with sharing resources for a FAIR data infrastructure. There is likely more value in these suggestions to the individual test cases than having the test cases as they are open right now.
We expect that a significant step forward to meet more comprehensively the aims of the FAIR data stewardship principles is to support inter-laboratory and interdisciplinary research data management services. Examples exist (Jain et al., Reference Jain, Ong, Hautier, Chen, Richards, Dacek, Cholia, Gunter, Skinner, Ceder and Persson2013; Draxl & Scheffler, Reference Draxl and Scheffler2019; Campbell et al., Reference Campbell, Hume, Reid and Warren2021) but need to be modified in the future to support microscopy communities in this matter. For APM, there exist examples of documented efforts to build online repositories (Diercks et al., Reference Diercks, Gorman and Gerstl2017; Ward & Blaiszik, Reference Ward and Blaiszik2021). The value of these can be improved: A substantial larger number of datasets should be added. Each should be supplemented with a variety of additional metadata. Search functionalities and web-based analytics should be added for data repurposing.
Conclusions
We document the results of a recent inter-laboratory call in which we invited members of the atom probe microscopy (APM) community to collect and discuss what could be useful test cases for developing data analysis software. We also asked the participants in this call for a documentation of metadata to understand how the community currently handles metadata and which steps are necessary to meet more comprehensively the FAIR data stewardship principles. As a first step of community efforts towards finding a more reproducible approach for sharing and discussing test cases, we publish a collection of ten test cases with open-source datasets, metadata, and associated analyses. These test cases cover questions of metadata for ranging, composition analyzing, clustering, and computational geometry methods. Assessing these test cases taught us the following take-home messages.
Individual commitment makes a difference:
• Functionally correct metadata- and workflow-documenting software tools are equally essential for writing APM research stories as are carefully executed lab experiments: Data analysis methods follow assumptions and have settings which should be reported as completely as possible. The test cases offer specific examples which metadata should be reported and document common pitfalls.
• Uncertainty quantification is an asset of high-quality research: The test cases document examples how substantially the settings and parameters affect the results of specific data analysis methods. We identify potential for improvements in terms of which documentation is necessary to make more rigorous uncertainty quantification at all possible. Atom probers should aim at defining best practices how metadata and numerical data should be reported in papers and document these when implementing software as best and as completely as possible. We suggest improvements how current and to be developed software tools can help with uncertainty quantification.
• Uncertainty quantification profits from strongly automated tools to reduce the time which experimentalists have to spent on documentation and manual procedures: The test cases document that further software development is required to support scientists with uncertainty quantification. Specifically needed are transparently accessible logging functionality and automated report writing tools, especially for commercial software, and with analyses dependent on GUIs. Whether it be the steps performed with a GUI or via a customized script: All analysis steps should be exactly reproducible and capable of more automated parameter sweeping.
• Software development with more accessible programming languages like Python or Matlab should be preferred: Where using compiled scientific computing software delivers substantially better performance and more transparent results, these tools should be supplemented with easier accessible interfaces or bindings. Training of individuals on versioning tools for software and writing documentations is needed.
Community-driven and interdisciplinary action is needed:
• The community should contribute and profit from having an organized mechanism of sharing datasets with associated workflows and software tools which implement the FAIR principles. Such a platform could serve as a documentation system complementing classical publications with supplementary material that is more descriptive and detailed, and easier reusable than are present publication formats. This platform can support research projects when data sharing requirements by funding agencies and publishers become stricter. The test cases document how solutions hosted by a single lab face challenges. We conclude that sharing data can profit from inter-laboratory and interdisciplinary cooperation. The APM community can learn and participate, for example, in infrastructure building activities by the condensed-matter physics or engineering communities. Before these services will be accepted by microscopists, though, it is necessary to support microscopy-community-specific methods as well as integrate the associated software tools to yield additional value than data sharing.
• There are additional multiplicator effects above gaining citations from sharing datasets openly: Open datasets help with the verification and communication of efficient processing methods. Open datasets also help with the documentation of scientific results and the identification of analysis cases where existing processing methods are challenged if not even these can be shown to produce nonreproducible, unreliable, or incorrect results. Furthermore, open datasets are a resource for making possible detailed comparisons between datasets and/or algorithms (round robin tests). Currently, such research stories are difficult to design if not impossible to perform with commercial software because these require tedious efforts by individuals of the community.
Availability of data and materials
The metadata and data for all test cases are shared openly (Ceguerra, Reference Ceguerra2021) as the supplementary material of this paper. Interested individuals should contact the corresponding authors of the respective case studies to ask for further details and codes. We invite and would like to encourage all members of the APM community to check if they can contribute further test cases and participate in the discussion how a FAIR infrastructure for our community should look like and which features it should contain. Feel free to contact the corresponding authors of the manuscript.
Acknowledgments
The authors acknowledge the instruments and scientific and technical assistance of Microscopy Australia at Sydney Microscopy & Microanalysis, The University of Sydney, a facility that is funded by the University, and State and Federal Governments. This research was supported by the Characterisation Virtual Laboratory, a collaborative Australian research platform supported by the National Collaborative Research Infrastructure Strategy (NCRIS) through the Australian Research Data Commons (ARDC). M.K. acknowledges the funding within BiGmax, the Max Planck Research Network on Big-Data-Driven Materials Science and computing time grants of the Max-Planck-Institut für Eisenforschung GmbH. A.J.L. acknowledges support from EPSRC Grant [EP/T012250/1]. J.W. and D.K.S. acknowledge funding from the U.S. Department of Energy, Office of Science, Basic Energy Sciences Materials Science and Engineering Division for participating in this work. The test data and OPTICS-APT package were developed at PNNL under funding from the Nuclear Technology R&D Program Core Materials research area sponsored by the US Department of Energy, Office of Nuclear Energy. Pacific Northwest National Laboratory is a multi-program national laboratory operated by Battelle for the U.S. DOE under Contract DE-AC05-79RL01830. I.G. appreciates the funding support by the Air Force Office of Scientific Research under Awards FA9550-14-1-0249 and FA9550-19-1-0378. H.B. acknowledges the facilities, scientific and technical assistance of Sydney Microscopy and Microanalysis, a core research facility of the University of Sydney, and the University's node of Microscopy Australia. H.B. thanks Jamie J. Kruzic from UNSW for providing the BMG material, and Bosong Li from UNSW for helping to prepare the ICP-AES samples. Partial funding for this work from the ARC (DP180101393) grant is gratefully acknowledged.
Author contributions statement
A.V.C. started the initiative on test cases and conceptualized the paper with M.K. M.K. wrote the majority of the manuscript. A.V.C. contributed with A.J.L. to the manuscript writing of the introduction and the discussion of their respective test cases. M.K. developed and implemented tools for test case 9. A.J.L. delivered test cases 10 and 6. J.W. and D.K.S. contributed test case 1. F.M.M. contributed test case 8. I.G. shared test case 2. H.B. submitted test case 7. A.V.C. contributed test cases 3, 5, and 4. All authors contributed to the reviewing of the manuscript.
Conflict of interest
The authors declare to have no conflict of interest.


 Open access