
Introduction: Conflict Lines in the Shadow of the Transnational Cleavage
In the previous chapter, we shed light on the variety of policy responses to the refugee crisis starting in the spring of 2015 when the European Commission put forward the European Agenda on Migration. We have shown that in the shadow of joint solutions, including external rebordering, efforts toward burden sharing, and overhauling the largely dysfunctional Dublin regulation, significant conflict lines opened up between groups of member states on the one hand and between member states and European institutions on the other. This chapter zooms in on the role of domestic interests and the way they are articulated in national policy debates. Issues of migration and asylum are part and parcel of political actors’ conception of national and group identities, which, as we know from postfunctionalist integration theory (Hooghe and Marks Reference Hooghe, Marks, Jones, Menon and Weatherill2009), serve as powerful battle cries in the hands of politicians to rally public opinion on their side either to politicize the European Union’s role in crisis management or to oppose national governments’ efforts to come to terms with the refugee crisis on their soil.
This self-conception of national- and group-based identities, however, matters politically only to the extent that they are activated by politicians and organized interests, leading to enduring cleavages that structure political competition (Bartolini Reference Bartels2005). Over recent decades, the cleavage structure that well described the “frozen” party systems of the postwar period in western Europe (Lipset and Rokkan Reference Lorimer1967) gave way to a national cleavage pitting the winners of globalization and European integration against its losers (Kriesi et al. 2008, Reference Kriesi2012; Hooghe and Marks Reference Hooghe, Marks, Jones, Menon and Weatherill2018). Within this integration-demarcation divide that manifests itself both in public attitudes and in political competition, immigration, rendered highly salient by the refugee crisis, can be regarded as a sort of “super-issue” with a potential to activate cultural and economic grievances simultaneously (Odmalm and Super Reference Oesch2014).
The key venue for political conflict around immigration is thus likely to play out in the partisan-electoral arena where radical right parties (RRPs), having made their first electoral breakthroughs in the 1980s, are well positioned to capitalize on their ownership of the issue, as their primary appeal lies in a nativist defense of the nation state against cultural threats from immigration (Bornschier Reference Bornschier2010; Mudde Reference Mudde2013). However, the electoral success of these RRPs has prompted mainstream parties to engage in strategic responses to fend off this electoral threat, often by shifting their own programmatic position toward a more restrictive stance on immigration (Abou-Chadi and Krause Reference Abou-Chadi and Krause2020; Abou-Chadi, Green-Pedersen, and Mortensen Reference Abou-Chadi, Green-Pedersen and Mortensen2020). In the extreme, such strategic positioning can play out within the government itself in the case of coalitions, and especially grand coalitions (Engler, Bauer-Blaschkowski, and Zohlnhöfer Reference Engler, Bauer-Blaschkowski and Zohlnhöfer2019; Höhmann and Sieberer Reference Hooghe and Marks2020), where coalition partners not only compete with the radical right but also with each other in an effort to send credible signals to voters that their concerns are heard. These considerations together lead us to expect that the most common conflict line in the refugee crisis will play out in the partisan-electoral arena between political parties, with the government (and senior government parties) on one end of the conflict line and radical challenger parties, the mainstream opposition, and occasionally coalition partners – in the case of grand coalitions – on the other end.
However, the political representation offered by political parties is likely to be highly imperfect, ridden with conflicting pressures on parties in a multidimensional political competition (Odmalm and Super Reference Oesch2014). Especially center-left parties are expected to feel the pinch (Hinnfors, Spehar, and Bucken-Knapp Reference Hirschman2012; Abou-Chadi and Krause Reference Abou-Chadi and Krause2020), as they are trapped between the principle-based expectations of a left-liberal electorate and the threat of an exodus to RRPs of their traditional working-class voters. As center-left parties navigate this trade-off and other actors in the party-political space, such as radical left-wing competitors, can offer only limited representation for the pro-refugee electorate (or for refugees themselves for that matter), nonpartisan actors are likely to enter to fill the void. The most likely candidates for such a role are political actors that are driven less by electoral considerations than by humanitarian and legal principles, such as NGO groups, intellectuals, church actors, and more broadly speaking, civil society actors. While the mobilization of such actors in the context of the refugee crisis has already been documented in a number of countries that we study (see Majtényi, Kopper, and Susánszky Reference Manin2019 for Hungary; Kalogeraki Reference Kammermann and Dermont2020 for Greece; and Durán Mogollón, Eisele, and Paschou Reference Durán Mogollón, Eisele and Paschou2021 for Greece and Germany), we expect a more general conflict line to emerge between governments and such civil society actors as a result of the parties’ turn to more restrictive policy positions on immigration.
Furthermore, the national cleavage that we regard as the driving force behind conflicts related to the refugee crisis has an important international component, especially in the context of policy episodes with an inherently international dimension. In addition to domestic conflict lines, governments are thus likely to engage in conflict with international actors in line with the liberal intergovernmental perspective (Moravcsik Reference Moravcsik1998; Hosli and Arnold Reference Hutter and Porta2010) that predicts an interstate cleavage will emerge as national governments seek to bring a unified “national position” to the negotiating table. In these debates, far from acting alone, member states are likely to seek transnational alliances to challenge EU initiatives, such as the V4 grouping’s steadfast opposition to the EU’s relocation scheme in the refugee crisis (Koß and Séville Reference Baumgartner, Green-Pedersen and Jones2020). Moreover, bilateral conflicts between individual member states are likely to arise as unilateral decisions of member states, such as rebordering efforts and waiving through asylum seekers, impose an additional burden on neighboring states in the form of redirected migrant flows and/or secondary movements (Kriesi et al. Reference Kriesi, Ferrera and Schelkle2021). Therefore, we expect two types of international conflicts to emerge: one between national governments and EU institutions and another between national governments of different member states.
Based on these theoretical considerations, we derive the following expectations for this chapter. As the foregoing discussion suggests, different types of policy episodes are likely to trigger different kinds of conflicts. In particular, we expect episodes revolving around border control measures to draw in international audiences and trigger international conflicts, whereas asylum-related episodes are more likely to be dominated by conflicts between the national government and its domestic opponents. Second, the structural position that countries found themselves in during the refugee crisis is also likely to be systematically linked to the emerging conflict lines. Those member states whose policy decisions are likely to impose negative externalities on other countries – namely frontline states and to some extent transit states – are more likely to trigger international conflicts than domestic ones. Third, within domestic conflicts, the underlying problem and political pressures that the national governments are confronted with are expected to be linked to the type of opponents of government policies. While the party-political opposition and civil society actors are “natural” opponents of governments – albeit for different reasons – the less common intragovernmental conflicts are more likely to emerge under conditions of intense problem and political pressures because only under such extreme scenarios may coalition partners risk a government breakdown for anticipated electoral gains, or at least for damage control. Lastly, different conflict lines are expected to imply different levels of politicization and levels of support behind the governments’ policies. On one end, international conflicts are likely to imply relatively high levels of politicization due to the wider range of actors involved in the debate, and relatively high levels of support behind government policies because domestic opponents may feel pressured to mute their opposition in the face of an international challenge. On the other end, societal conflicts are expected to be little politicized because nonpartisan actors face higher hurdles to keep the issue on the agenda compared to the party-political opposition. At the same time, intragovernmental conflicts are likely to imply the lowest level of average support behind governments because in addition to the usual sources of opposition, governments also need to confront criticism within their own ranks in these conflicts.
In this chapter, we build on these theoretical expectations to describe the main conflict lines that emerged in the national debates in the refugee crisis. To do so, we return to the forty policy episodes that we introduced and described in detail in Chapters 3 and 5. In the following section, we describe the broad actor types that we expect to act as protagonists in the conflicts. In the third section of this chapter, we introduce our conflict intensity indicator based on our PPA dataset and describe the episodes in terms of the average intensity of their conflict. In the fourth section, we first propose a simple and transparent measurement to allocate episodes to one of the conflict types that we introduced above: partisan conflicts, societal conflicts, international conflicts, and intragovernmental conflicts. We then proceed to provide a rough empirical test for the expectations that we derived, relying on descriptive comparisons only due to the limited number of cases, ruling out more rigorous statistical tests. The fifth section provides illustrations of these conflict lines from four selected episodes. The sixth concludes the discussion.
Governments and Their Opponents
In the original scheme of our PPA dataset, the national government is understood in a narrow sense. It comprises the heads of governments (premiers and the president in the semipresidential regime of France), the ministers, and other cabinet officials who are not affiliated with any particular ministry (e.g., spokespeople for the entire cabinet). By contrast, state institutions, local and regional authorities, and government parties are considered to be distinct actor types. For operationalizing conflict lines between actors, we partly relax this assumption by including government parties under the national government category. When a government MP in parliament criticizes the opposition, we would consider this a manifestation of a government–opposition conflict. Conversely, if a politician from the government party is addressed individually by civil society actors in a negative light, this would be counted as a manifestation of a government–civil society conflict.
Operationalizing the party-political opposition is comparatively straightforward. All actions undertaken by opposition parties regardless of their parliamentary presence or strength are considered as opposition actions and to the extent that they carry an element of criticism of the government, they contribute to partisan conflict. These actions can take the form of a statement by an individual politician from an opposition party or an action undertaken by the party as a whole (e.g., a motion in parliament). An important distinction we make, however, is between mainstream parties and challengers, following Hobolt and Tilley (Reference Hoeglinger2016). Within partisan conflicts, we thus further distinguish between conflicts dominated by government–mainstream opposition exchanges and those dominated by government-challenger opposition exchanges.
Civil society actors comprise a diverse group of organizations. The most common actor to enter the policy debates are NGO groups, such as Amnesty International and Médecins Sans Frontières, via either their international representatives or their local branches. In addition to these NGO groups, various expert groups, such as think tanks, academics, public intellectuals, and media representatives were also important opponents of government policies if not by virtue of their institutional powers, then by the moral weight of their words. Compared to these two broad groups, a relatively marginal role was played by business actors; churches; unions; and on occasions, migrants themselves who engaged in numerous protests and other confrontative actions involving policy demands, especially in Greece.
Opposition from international actors came from two main sources. On the one hand, EU institutions frequently intervened in domestic debates, especially when these debates were closely linked to EU-level policies, such as the Hungarian quota referendum that explicitly opposed the policy initiative of the European Commission. Even more prominently, foreign governments played an important role in some of the debates, especially in the case of border conflicts between neighboring countries, such as the stand-off at the French–Italian border (Ventimiglia), the French–British border (Calais), and the Austrian–Italian border (the Brenner Pass). In addition to these two main sources of international actors’ intervention, a smaller third group comprises other supranational institutions, such as the UN (UNHCR), the Council of Europe, and NATO.
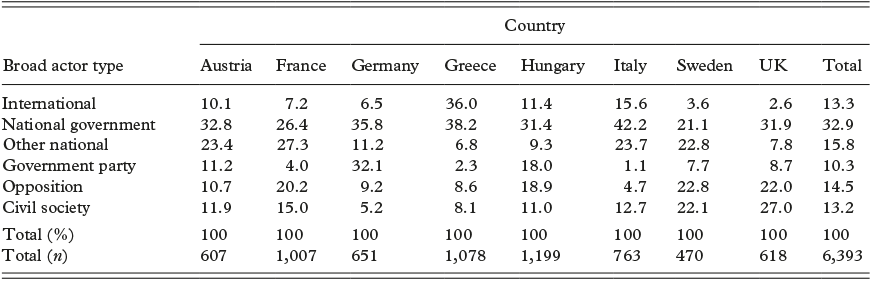
Table 6.1 confirms the central role of the national government. In six of the eight countries (the two exceptions are France and Sweden), the national government was responsible for the largest share of the coded actions in the policy debates. When subsuming government parties under national governments, even these two exceptions fit the general pattern. As for the three potential opponents of governments, they have a roughly equal average share, with important cross-country variation, however. In France, Sweden, and the UK, the party-political opposition accounts for more than 20 percent of the actions. International actors are particularly prominent in the frontline states (Greece and Italy), and to some extent Austria and Hungary. Civil society actors are the most active in the UK and Sweden (and to a lesser extent in France). Germany stands out for the prominent role of government parties, suggesting that debates within the government, as we shall subsequently see, accounted for the lion’s share of the conflict.
Considering the actors themselves, however, is only part of the story. Conflicts, by definition, have at least two actors involved, and our PPA dataset is well suited to pick up this link. In addition to the actors undertaking the actions, we thus also consider the actors who were most frequently targeted in the debates. Targeting can take place in multiple forms, but the most common form is an actor explicitly addressing another actor in their statements. Such targeting may not necessarily imply conflict, but in the empirical distribution of these targeted actions, only 15.6 percent are assigned a positive actor direction code, and the rest are either neutral (36.3 percent) or negative (48.1 percent). Therefore, to the extent that interaction takes place between actors, these interactions tend to have a conflictual bent.
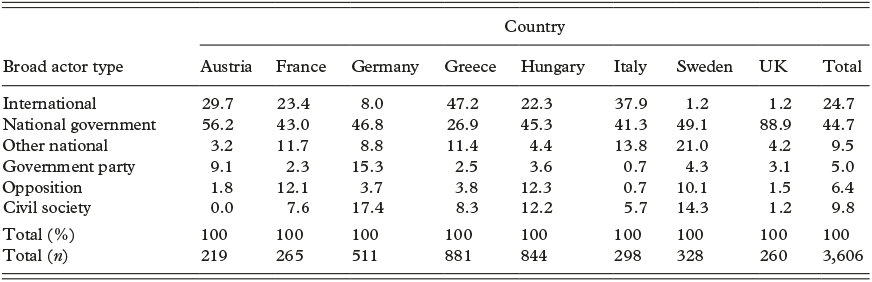
When evaluating the importance of the actor types on the targeted end of the conflict lines (Table 6.2), the prominence of the national government is even more pronounced, accounting for an average of almost half of all targeted actions. Compared to the distribution of the actors undertaking the actions, international actors also appear to have a more pronounced role on the targeted end, suggesting that foreign actors – EU actors and other governments – were popular scapegoats in the policy debates (except for Germany, the UK, and Sweden, where their role was rather negligible). This is particularly the case in the two frontline states, where international actors appear between one third and half of the time among the target actors. Comparatively speaking, the other two broad actor types are less commonly targeted with a few exceptions, however. Opposition parties are targeted on numerous occasions in France, Hungary, and Sweden, whereas civil society organizations are the most commonly targeted in Germany and Sweden. Overall, however, the bulk of the attention is focused on the government, with the UK being an extreme case to illustrate this pattern: No less than 88.9 percent of all targeted actions are addressed at the national government.
The Intensity of the Conflict
The actors involved in the policy debate, either as initiators (actors undertaking the actions) or as targets (actors addressed by the actions of other actors), reveal only one aspect of the conflict. To fully understand the nature of the conflict in a given policy episode, we need to make refinements both conceptually and in operational terms. First, a relatively small, but nontrivial share of the targeted actions are positive vis-à-vis the target actor, for instance, when actors praise other actors’ efforts toward finding a solution to the refugee crisis. Such positively targeted actions reduce the overall level of conflict in a given episode. Second, a large share of targeted actions are coded as “neutral,” such as when an actor calls upon another actor to act in a certain way without expressing explicit criticism of them. Third, even those actions that carry a negative attitude toward the target are assigned a negative actor direction code and as such vastly differ in the tone and the substance of the critique vis-à-vis the target. Fourth, among the nontargeted actions, some imply an escalation of the conflict, such as actions to veto or sabotage the policy and its implementation. These considerations taken together point to the need for an indicator that captures both the directionality of actors’ action vis-à-vis their targets (positive, negative, or neutral) and the type of actions they undertake.
We utilize our conflict intensity indicator for this purpose. For the present purposes, it suffices to say that conflict intensity is a composite indicator of actor direction (whether actors express a positive, a neutral, or a negative attitude vis-à-vis the target) and the policy action codes (the type of action that the actor undertakes). To illustrate the logic behind combining these two variables, for a given direction code vis-à-vis the target (let’s say negative), compare a personal attack to a policy demand: The level of conflict is expected to be higher when an actor launches a personal attack against the target (criticizes, accuses, or denigrates it) than when they merely demand a policy change.
Taking the average level of conflict intensity by episodes reveals that the episodes are broadly comparable, with the indicator in most of the episodes moving within a relatively narrow range between 0.4 and 0.6 on the 0–1 conflict intensity scale. A notable exception is Hungary, with four of the five episodes registering an average conflict intensity score of above 0.6. The Civil Law episode especially stands out for its high level of conflict (0.8). Ironically, the highest level of conflict intensity in the Civil Law episode (as well as in the very similar “Stop Soros” episode) occurred in a context where the debate had very little to do with the rules regulating the border and the asylum process. On the other end of the spectrum, cases of low conflict intensity cover a group of diverse episodes, such as the Summer of 2015 in Greece, the first Immigration Act in the UK, and two Border Control episodes in France (Ventimiglia and the General Border Closures).
Since our conflict intensity indicator is action-specific, we can calculate the average conflict intensity scores by the initiating actors and the target actors. We illustrate this in Figure 6.1, with darker shades indicating higher average levels of conflict. Note that the color scales on the two heatmaps are not identical because when we restrict observations to targeted actions (Figure 6.1b), the average level of conflict intensity is likely to be higher.
Average level of conflict intensity by country and broad actor types as instigators (a) and targets (b)
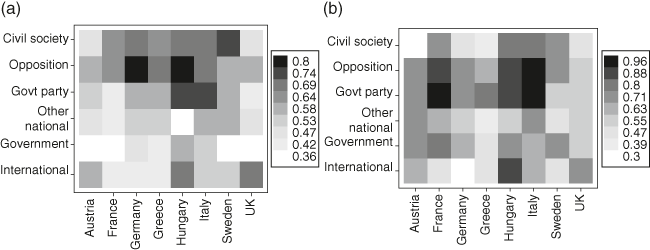
Among the instigators, opposition parties and to a lesser extent civil society groups stand out from the rest, though the cross-country variation is substantial. Opposition parties instigate, on average, the most intense conflicts in Germany and Hungary, while civil society is the most conflictual in Sweden. Among the third broad type of opponents of government policies that we identified above, international actors are comparatively restrained, with the partial exception of Hungary (the relatively high average conflict intensity score for international actors involved in British debates results from very few corresponding observations). The most noteworthy result from this heatmap is the limited role of governments as instigators, arguably because the majority of government actions in the overall sample (58.6 percent) are nontargeted, as governments typically focus on the policies rather than on their opponents in their actions. Again, the partial exception is Hungary, where the government very often made critical remarks to their opponents. The restraint shown by most governments, however, needs to be somewhat nuanced when we include government parties, which often engaged in conflictual actions not only in Hungary but also in Italy and to a lesser extent Germany, Greece, and Sweden.
Government parties, therefore, often acted as the more militant arm of governments in the debates, as evidenced by the considerably higher average conflict intensity score in the parliamentary arena (0.54), the natural venue for these government party actors, compared to the governmental arena (0.41).
This difference between government parties and national governments is mirrored in the conflict intensity patterns by target actors. Though the average conflict intensity score among actions aimed at governments is considerably higher compared to actions instigated by governments, when government parties are targeted by their opponents, the average level of conflict tends to be even higher. Most importantly, however, actions aimed at opposition parties proved to be, yet again, the center of the conflict, with average conflict intensity scores above 0.8 in France, Italy, and Hungary. Civil society actors, by contrast, are largely spared as targets; their contributions to the overall level of conflict reside rather in their role as instigators. A partial exception from this pattern are Hungary and Italy, where civil society groups provided popular scapegoats for right-wing government officials because of their alleged role in helping asylum seekers reach the national territory. Finally, both as instigators and as targets, international actors tend to elicit relatively limited conflict intensity. The notable exception, yet again, is Hungary, where EU institutions – or in the case of the Fence Building episode, neighboring governments – often served as the prime target in the debates.
Conflict Lines and Their Correlates
Having outlined the main actors involved in the policy debate across the forty episodes as well as the average intensity of the conflict in each episode corresponding to our broad actor categories, we now return to the task set out in the introduction and identify the main conflict lines that prevail in each episode. To speak of conflict lines, it is imperative to restrict our PPA dataset to the subset of observations where target actors can be identified. As a first step, we rely on the same broad actor categories that we used up to this point – international actors, national governments, government parties, opposition parties, and civil society actors both on the initiator and on the target sides. We exclude other national actors (state institutions and local/regional authorities) from our analysis because of their relatively marginal role in the conflict, as evidenced by Figure 6.1. Theoretically, there are ten actor pairs involving two of the five actor types. However, we consider only the subset of conflict lines where the government is one of the actors. Moreover, we treat governments and government parties as the same actor at first – a restriction we drop later on in order to identify specific subtypes of intragovernmental conflicts.
The first step toward identifying conflict lines consists of calculating the share of targeted actions for each relevant pair. For example, we can calculate the share of all targeted actions in an episode involving the government and opposition parties. The measurement is symmetrical in the sense that governments targeting the opposition and the opposition targeting the government contribute equally to the strength of this conflict line. The second step in the measurement concerns the intensity of the actor pair–specific conflict, which we measure by the average conflict intensity score among the actions that involve a given actor pair. For each relevant actor pair, we then take the product of these two elements – the share of actor pair–specific targeted actions in all targeted actions and the average conflict intensity score of these actor pair–specific targeted actions. The product ranges from 0 (when either no actor pair–specific targeted action occurs in the episode or all the actor pair–specific targeted actions are of minimum conflict intensity) to 1 (when all the targeted actions are undertaken by the same actor pair and all these targeted actions are of maximum conflict intensity). We call this product the actor pair–specific conflict score.
Below, we concentrate on those pairs where one of the actors is the government. We also calculated the conflict scores for pairs not including the government, but these scores turned out to be considerably lower compared to the pairs involving the government. This is hardly surprising, given that targeted actions between civil society, opposition, international actors, and state and regional institutions are quite rare compared to actions where one of the actors is the government.
A quick look at Figure 6.2 reveals that the average strength of the four conflict lines differs considerably. Whereas the partisan and the societal conflict lines are present in almost all of the episodes, this cannot be said for the other two types of conflicts: intragovernmental and international. Especially intragovernmental conflicts appear to be the exception rather than the rule: Only in a quarter of the episodes does their strength exceed 0.1, and in another quarter of the episodes, there is no such conflict to speak of whatsoever. By contrast, only two of the forty episodes register a zero score for the partisan conflict line, and three of the forty episodes register a zero score for the societal conflict line. The average strength of the four conflict lines corroborates these differences. The average scores are 0.14 for partisan, 0.12 for international, 0.10 for societal, and 0.08 for intragovernmental conflicts. This provides some tentative evidence for our initial expectations that partisan conflicts are the most likely venue for conflicts in refugee-related policy episodes.
Conflict scores for the four dominant conflict lines in the policy episodes
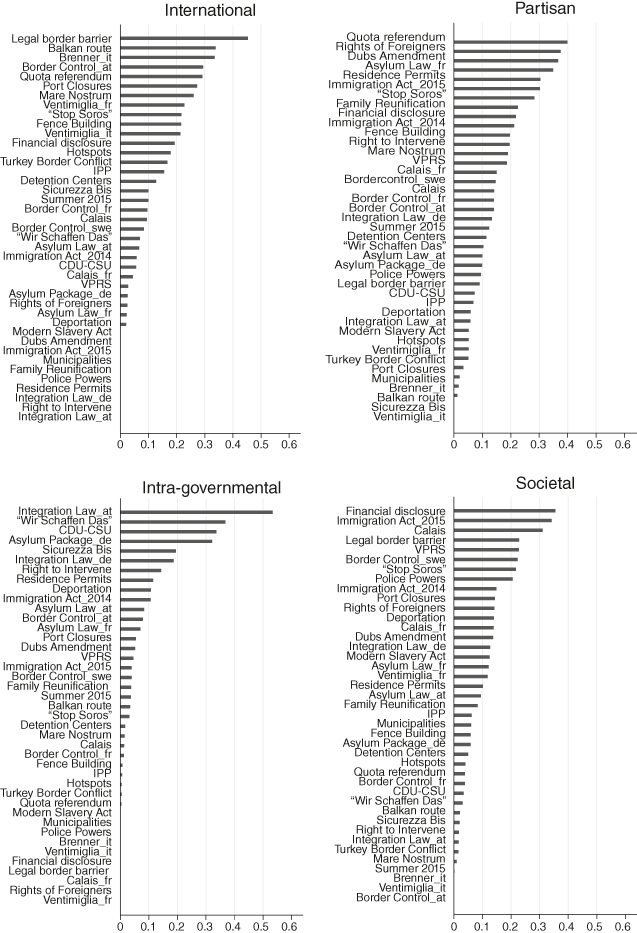
With the episodes ordered according to the size of the respective conflict score, some of the ideal typical episodes in terms of the conflict lines can be identified. Thus, the Legal Border Barrier Amendment in Hungary stands out as an example for a conflict between the government and international actors. With respect to the conflict between the government and its partisan opposition, there is a more even distribution of episodes at the top, with the Hungarian quota referendum, the Rights of Foreigners Bill in France, and the Dubs Amendment in the UK involving the most intense partisan conflicts. Comparatively speaking, as we noted above, many fewer episodes register high conflict scores between government actors themselves. The Austrian Integration Law episode is a clear outlier here, and three of the five German episodes (“Wir Schaffen Das,” the CDU-CSU Conflict, and the Asylum Package) follow in second, third, and fourth place, respectively. Finally, three episodes stand out for their relatively intense conflict between governments and civil society actors: The Civil Law episode in Hungary, the second Immigration Act in the UK, and the Calais border conflict (on the British side).
Beneath these broad-brush characterizations of conflict lines, however, there are important nuances. For three of the four types of conflicts, we further distinguish between two subtypes each. Within international conflicts, the main conflict line can be either between the national government and EU authorities or between the national government and other governments. For partisan conflicts, the bulk of the opposition can come either from mainstream or from radical opposition parties. For intragovernmental conflicts, the main conflict can take place either between coalition partners in the case of coalition governments, or within the government (or the senior ruling party) itself. We shall call the former type coalition splits and the latter type government splits. We do not further distinguish between societal conflicts, partly because we consider it to be of secondary importance which type of civil society organization the main source of opposition is coming from. With this second-level splitting, we thus end up with seven subtypes within the four main types we have previously identified. Table 6.3 allocates each episode according to the prevailing conflict. For the identification of the subtypes, we simply reproduce the conflict scores for the subtypes and allocate the episodes depending on which subtype-specific conflict score is greater.
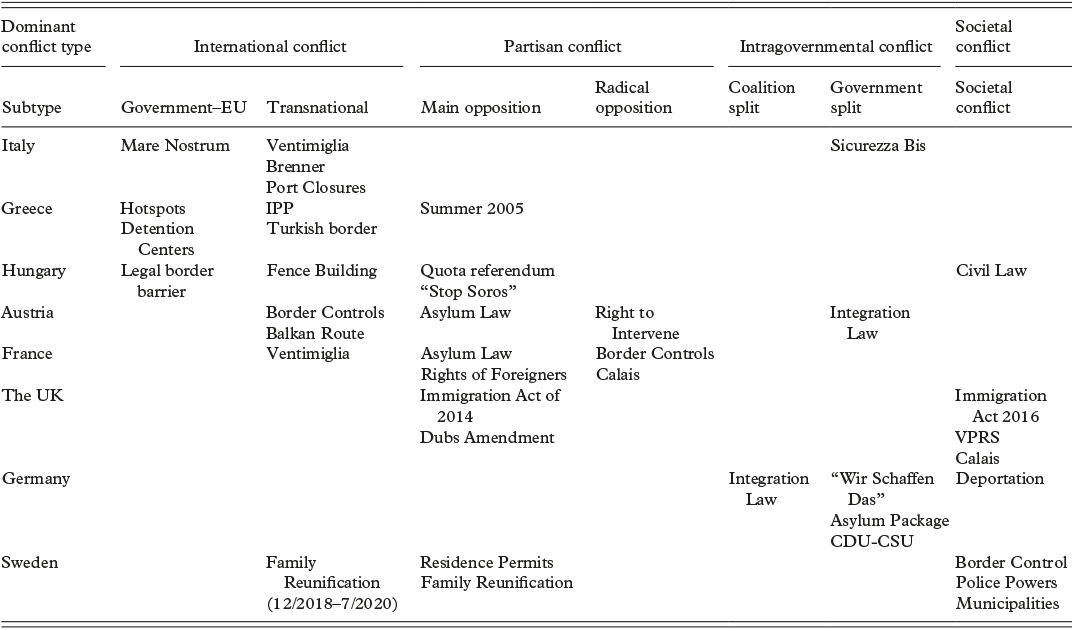
Examining the dominant type of conflicts across countries and policy episodes, some interesting patterns emerge. Thus, in line with our expectations, international conflicts are mostly limited to frontline and transit states. Partisan conflicts dominate in at least one episode in six of the eight countries, but they are absent from Germany and Italy. Most partisan conflicts take place between the government and the mainstream opposition, suggesting that strategic behavior by mainstream opposition parties often succeeds in sidelining challenger parties from the debates. That said, in Austria and France, where two of the largest and most established radical right populist parties in the EU are key actors in the party-political space, three episodes are dominated by the conflict between the government and the challenger opposition (the FPO and the National Rally). Interestingly, most of the intragovernmental conflicts (five of the six episodes) are characterized by splits within the government, strictly understood, or between the senior government party and the government. There is only one episode (the Integration Law episode in Germany) that is dominated by a coalition split between the ruling parties. However, it must be noted that allocating the episodes within the intragovernmental category is highly sensitive to coding decisions (e.g., whether the government position or the party position enjoys precedence when coding individual actors). Finally, with one exception, government–civil society conflicts are restricted to destination states. The only exception is the Civil Law episode in Hungary, where civil society groups were explicitly targeted by the government.
The disadvantage of treating episodes as belonging to one but only one conflict type is that we neglect possible secondary conflicts that may have strength that is comparable to the dominant conflict. To take the full configuration of country-specific conflicts into account, we present a series of country-specific radar plots (Figure 6.3) with episodes in the angles of the outer pentagons and the four rectangles showing the episode-specific conflict scores for each type of conflict. Starting with the frontline countries, the dominance of the international conflict line is clearly visible and is represented by the large area carved out by the black rectangles. In Greece, this international conflict primarily stems from the relatively important role of the European Commission in the debate and from the frequent exchanges between Greek authorities and foreign governments (mostly Germany and Turkey). In Italy, the international dimension of the conflict is primarily driven by Italian authorities interacting with neighboring governments (France and Austria) during the border conflicts at Ventimiglia and the Brenner Pass. In addition to this international dimension, a relatively large secondary conflict (government–opposition) is visible in Greece, whereas secondary conflicts appear only in individual episodes in Italy (e.g., the intragovernmental conflict in the case of the Sicurezza Bis episode).
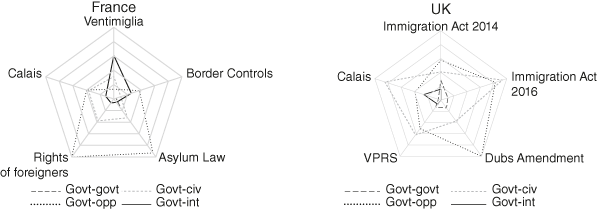
Relative strength of conflict lines in policy episodes (by country type: frontline states, transit states, open destination states, closed destination states)
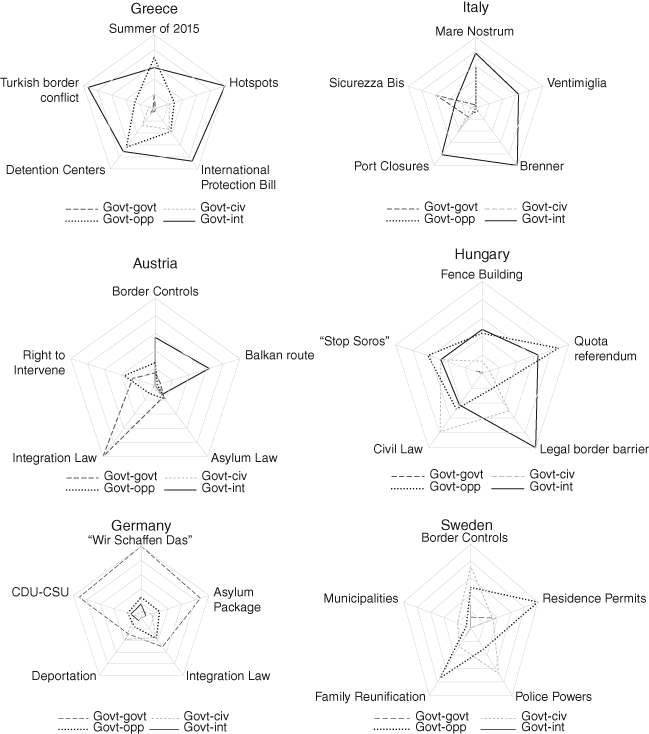
In the case of the two transit states, Hungary has three dominant conflict lines that are comparable in size; the international conflict line is the strongest overall, and the partisan and societal conflict lines are close seconds. In the international dimension, the European Commission and the European Parliament emerged as the Orbán government’s most vocal critics, whereas foreign governments contributed to the conflict mostly during the Fence Building episode. Within the partisan conflict line, the left liberal mainstream opposition played a much more prominent role than the right-wing challenger party, Jobbik. The societal conflict was largely driven by civil society groups that the government directly targeted in two of the five episodes (Civil Law and “Stop Soros”). By contrast, the intragovernmental conflict line is almost completely absent, due to the highly cohesive nature of the Fidesz-led government.
The strongest conflict line that emerges in Austria is the intragovernmental one, but it is heavily driven by a single episode, the Integration Law. During this episode, the national government and both members of the grand coalition (SPO and OVP) regularly engaged in verbal exchanges that were predominantly critical, accounting for around a quarter of all actions in the episode. In addition to these intragovernmental debates, the international conflict line (with EU institutions as well as with Germany and Balkan route countries) emerged as a secondary conflict, with partisan conflicts and societal conflicts lagging far behind.
Destination states show great variation in their conflict patterns. Germany is a paradigmatic case of the intragovernmental conflict, with a pattern similar to the Austrian Integration Law episode, except that this type of conflict persists throughout all five German episodes (around a third of all coded actions involve some sort of intragovernmental exchange). All components of the government triangle – the national government, the senior coalition member (CDU-CSU), and the junior coalition partner (SPD) – contribute to this conflict in roughly equal proportions. The other three conflict lines pale in comparison to this intragovernmental standoff in the German case. Sweden, by contrast, has a more balanced conflict configuration, with the partisan conflict playing the most prominent role and the center right opposition leading the attack against the center left government, occasionally complemented by exchanges with the challenger left (The Left Party) and the challenger right (Swedish Democrats). A secondary conflict line in Sweden is the one between the government and civil society, which unlike in the Hungarian case, largely involves media actors and other influential individuals in society.
In France, the partisan conflict is the dominant conflict line, with two important caveats, however. First, only a relatively low share of all actions (27.4 percent) are targeted, so the overall policy debate has a comparatively subdued level of conflict with the second lowest average conflict intensity among the eight countries (0.47). Second, the high partisan conflict score is driven by two of the five episodes: the Asylum Law and the Right of Foreigners Bill. During these two episodes, the mainstream opposition and radical challengers both from the left and the right contributed roughly equally to the partisan conflict. Finally, in the UK, there is a rough balance between the partisan and the societal conflicts, with the other two conflict lines largely absent. Within the partisan conflict in the UK, the opposition Labour Party led the attacks on the Conservative–Liberal Democratic coalition (later on, the single-party Conservative government), while the societal conflict was largely driven by various NGO groups (and to a lesser extent, religious figures from the Anglican Church) voicing their humanitarian concerns about the plight of asylum seekers in the restrictive policy environment of the UK.
Correlates of Conflict Lines
Having outlined the main conflict lines in the eight countries, we are now well placed to investigate systematic differences between these conflict lines in terms of the substantive scope of the episodes and the underlying political context. To briefly recall the expectations that we derived in the introductory section, we shall examine whether conflict lines systematically covary with the types of policy episodes, the underlying problem and political pressures, and the levels of politicization and average support behind the governments’ policies. Given the limited number of cases, we are unable to offer a rigorous statistical analysis across the episodes to answer these questions, but a descriptive summary provides some tentative answers nonetheless.
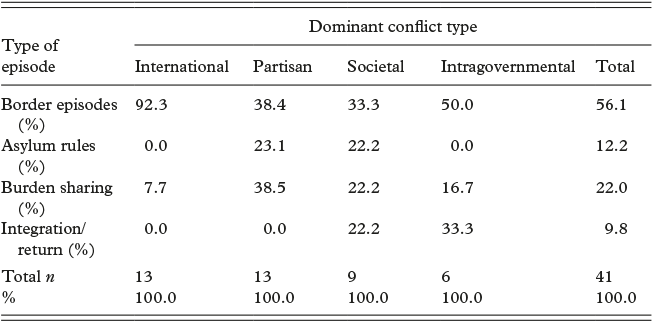
First, we investigate whether the substantive scope of the episodes offers any cues to the kind of conflict line that is most likely to emerge. We distinguish between the four types of episodes that we introduced in Chapter 4: border measures, changes in asylum rules, burden sharing episodes, and integration/return measures. It is readily apparent from Table 6.4 that international conflicts, unsurprisingly, are heavily concentrated among the border measures: All but one of the thirteen international conflicts correspond to this episode type. The other most common type of conflict, partisan conflicts, are more evenly distributed across the episode types, with the exception of integration and return episodes, all four of which triggered either societal or intragovernmental conflicts. While societal conflicts are evenly distributed among the episode types, none of the intragovernmental conflicts revolved around changes in asylum rules.
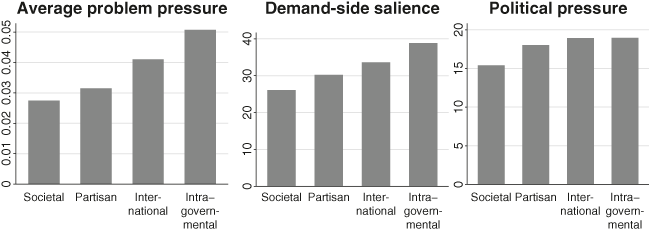
Turning to the demand-side correlates of conflict lines (Figure 6.4), problem pressure and demand-side salience appear to systematically differ between conflict types, whereas political pressure differs less. Intragovernmental conflicts stand out both in terms of problem pressure and salience from the rest, which is in line with our expectations. Though one has to interpret this with great caution because there are only six intragovernmental conflicts and they occur in only three countries, it appears that in contexts of high migration pressure and heightened public scrutiny, government actors are more likely to engage in public debate, crowding out other sources of conflict. Societal and partisan conflicts, on the other hand, tend to occur in contexts of significantly lower problem pressure and public salience, whereas international conflicts tend to occur at moderate levels in both dimensions. No such differences can be discerned with regard to political pressure, however, as all four types of conflicts tend to occur in roughly comparable political contexts as far as the strength of the radical right is concerned. A partial exception is societal conflicts in which the radical right seems somewhat weaker (by around 3 percentage points) compared to the rest.
Problem pressure, demand-side salience, and political pressure by conflict type
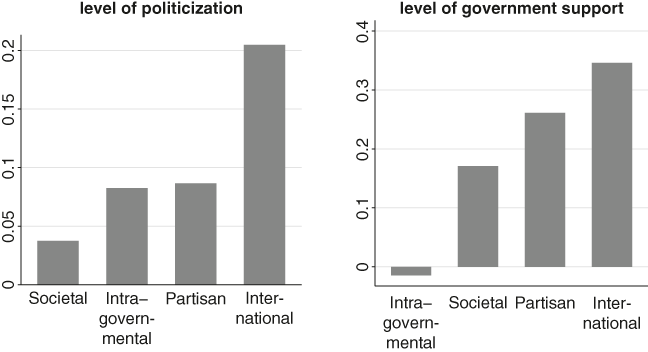
Compared to the political and migration context, there are considerably greater differences in the nature of the debate that the different conflict lines trigger. We focus on two elements of the debate that we have introduced in earlier chapters: politicization and average levels of support behind governments. On the left chart of Figure 6.5, we show the average level of politicization by conflict types, while on the right chart, we show the average level of support that the government received for their proposed policies. In both dimensions, international conflicts stand out from the rest with more than double the level of politicization and support behind governments compared to the other conflict types. The involvement of international actors thus seems to simultaneously lead to higher levels of politicization and to higher level of support that the government can expect. Our tentative explanation for this, as we laid out earlier, is that international conflicts tend to draw in a broader group of participants, thus increasing politicization, but at the same time, they tend to mute criticism from domestic opponents in the face of an international challenge. On the other end of the spectrum, societal conflicts tend to score low in politicization, while intragovernmental conflicts uniquely register a negative average level of government support. It appears, therefore, that as parts of the government (coalition partners, individual ministers, parliamentary wings of ruling parties, etc.) turn against the government proposal, they swell the ranks of critical voices, thus lowering the average level of government support. The low level of politicization in societal conflicts in turn is arguably the result of civil society actors’ institutional constraints and limited capacity to keep the debate on the agenda for an extended period of time and to draw in a wider array of actors in the debate.
Average levels of politicization and support behind government policies across the policy episodes
Conflict Lines in Detail
International Conflict: Legal Border Barrier Amendment in Hungary
The episode that best illustrates the type of international conflicts that occurred during the management of the refugee crisis unfolded in the spring of 2017 in Hungary. After a series of fence construction drives and a set of legal measures to hinder illegal crossings mostly across the Serbian and to a lesser extent the Croatian and the Slovenian borders, the Orbán government tightened the screws further by opening the way to the forced detainment of refugees and their confinement in metal containers under abject humanitarian conditions. This episode, while comparatively short and low in action count, constitutes a perfect example of an international conflict as the Hungarian government found itself in opposition to multiple sources of external contestation: EU institutions, the Council of Europe, the European Court of Human Rights, the UN, and other supranational institutions. Contrary to the Fence Building episode in the summer and autumn of 2015, there was no involvement of neighboring governments in the policy debate this time, arguably because they had come around to acquiesce to the sealed Hungarian borders as a fait accompli.
The exchanges between the Hungarian government and EU- and supranational institutions, however, were intense and conflict-ridden. Overall, the episode registers by far the highest conflict score on the international dimension (0.45 versus a sample average of 0.12). In fact, more than 40 percent of all actions in the episode involved exchanges between the Hungarian government and these international actors, and a majority of these actions carried a critical attitude toward the target actor. The directionality of these exchanges was rather lopsided, with the Hungarian government being the most common initiator (71.1 percent of the time) with the EU or EU institutions being the most common targets (60.5 percent of all such government–international exchanges).
On the Hungarian side, many of the attacks on European institutions and officials came from the highest circle and involved Prime Minister Viktor Orbán and his closest entourage. In fact, Orbán himself undertook the very first action in this episode in February 2017: While defending the proposed detention plans, he criticized Brussels in an interview as being aloof to the “bloody reality” in Europe stemming from illegal migration. His criticism was later echoed by his chief security adviser, who accused the EU of double standards and a failure to appreciate the importance of protecting external borders. Other ministers, including the foreign minister and the justice minister, joined the fray with the common underlying narrative that while Hungary was protecting Europe, the EU had failed to live up to its responsibilities in the domain of border protection.
Other fronts of the offensive involved particular EU institutions and officials. In late March, the chief security adviser expressed “puzzlement” over a ruling by the European Court of Human Rights related to the transfer of unaccompanied minors from their care facility. Later in March, the prime minister’s office criticized the European Commission for its lack of flexibility and compromise on the issue of DNA testing of unaccompanied minors to verify their age. Simultaneously, attacks were launched on actors from the European Parliament (specifically, the Socialist Group) for passing a resolution against Hungary, which Janos Lazar, a prominent cabinet member, shrugged off as a “left-wing political provocation.” The most popular boogeyman among these offensives, however, turned out to be Judith Sargentini, a Green MEP from the Netherlands, for her role in getting another critical resolution passed by the European Parliament in 2018. In this later phase of the episode, the conflict was more sporadic but no less intense in its tone. For example, in September 2018, Gergely Gulyas, minister of the prime minister’s office, dismissed the Sargentini Report in parliament as a “false immigration indictment and slander.”
Comparatively speaking, the attacks on Hungary by EU- and supranational actors were more measured in tone but equally critical in substance. In late March 2017, the Council of Europe (CoE) called on Hungary to review its new migration law because it carried the risk of subjecting minors to sexual exploitation. A month later, it accused Hungarian authorities of being unable to differentiate between victims of human trafficking among illegal asylum seekers and refugees. Among EU actors, it was mostly the European Parliament and left-wing parties and MEPs within (including Sargentini herself) who led the wave of critical voices against Hungarian authorities because of the humanitarian conditions reigning in the transit zones after the legal changes. The European Commission also contributed to the conflict, however, via two critical interventions by Dimitris Avramopolou, the migration commissioner, in the spring of 2017. All in all, however, these critical remarks mostly concerned the specific provisions of the law and practices by the coercive authorities, in contrast to the much broader and personal critiques articulated by Hungarian officials. The conflict was therefore rather one sided both in terms of the scale of the attacks and in terms of its substance, with the Hungarian government clearly in the initiating seat. Moreover, compared to the international aspect of the conflict that we have outlined above, critical exchanges with the opposition and civil society were few and far between.
Partisan Conflict: Rights of Foreigners Bill in France
Compared to the Hungarian border episode discussed above, the Rights of Foreigners bill in France was only moderately conflictual, with an average conflict intensity score of 0.45. Moreover, in line with the demand-side and supply-side correlates we have shown above, it occurred in a context of low problem pressure (stemming from France’s role as a closed destination country), moderate demand-side salience (it ended before the Bataclan and the Nice terror attacks shocked French political life), and low politicization. Only in political pressure did the episode score above the sample average, mostly due to the continuously high level of political support enjoyed by the right-wing challenger National Rally in the run-up to the refugee crisis when this episode was on the political agenda (2013–15).
In its substance, this episode concerns two legislative changes initiated by the center left Holland government: an asylum reform to reduce the processing period of asylum applications from 24 to 9 months and an immigration law involving the creation of a multiyear residence permit so that foreigners could avoid having to go to the prefecture every year to renew their residence permits. Its duration was accordingly rather long, spanning two and a half years between the summer of 2013 and November 2015.
Two features of the French political context provided fertile grounds for partisan conflict. First, the two legal changes were initiated by a center left government that quickly found itself in a partisan cross-fire between the left (left-wing challenger parties) and the right-wing opposition (the Republicans as the mainstream opposition and the National Rally as the right-wing challenger opposition). In this particular policy debate, however, the National Rally played a secondary role, and the main conflict line was mostly between the government and the Republicans, and to a more limited extent, between the government and left-wing challenger parties, such as the Parti Radical de Gauche and the New Anti-Capitalist Party led by the self-proclaimed Trotskyite Olivier Besancenot. Second, the bicameral French legislative process ensured that the government would be exposed to partisan attacks at two separate legislative readings for each of the two reforms: first at the Assembly and second at the Senate.
The bulk of the conflict originated from opposition parties targeting the government. The left-wing challengers emphasized principles of individual liberty and humanitarian considerations. For instance, Olivier Besancenot criticized the government for racist and xenophobic practices upon the evacuation of a migrant camp in Paris. Meanwhile, the mainstream opposition emphasized concerns related to illegal migration and accused the government that its legal proposals did not go far enough, especially with regards to the second bill on foreigners’ rights. During the debate on the first bill, Eric Ciotti from the Republicans expressed broad agreement with the principle of reducing the application time for asylum claims but claimed that “if it serves to receive more people, it is not certain that the French people like this policy.” Les Républicains continued their opposition throughout the parliamentary readings of the second bill. A group of MPs from the Republicans criticized Bernard Cazeneuve, the interior minister standing behind the proposals, in a National Assembly debate, claiming that the text is “contrary to the national interest.”
In response, the government, mostly represented by Cazeneuve, also turned its attention to the right-wing opposition in general and to former president Sarkozy, an old–new presidential hopeful at the time, in particular. In the early stages of the debate in 2014, he claimed in an op-ed article that the former president was still struggling with “his old demons” on immigration, “scorning the facts” by “demagogy.” Later, on the sidelines of a study day on asylum reform organized by the National Federation of Associations for Reception and Social Reintegration (FNARS) in September 2015, he took aim at Sarkozy’s hardliner proposals once again, claiming that “refugee status is not divisible, it is one and indivisible like the Republic.” Overall, however, despite the government’s best efforts to defend its initiatives against attacks from both the left and the right, it struggled to escape from this partisan cross-fire in a context of sagging popularity at the polls. Its only solace was the fact that neither international actors nor civil society actors were particularly vocal in this episode and could not match the critical voice of the parliamentary opposition. Also, the government managed to maintain a semblance of unity in the public eye, presenting a united front against the opposition in the midst of this partisan conflict.
Societal Conflict: Immigration Act 2016 in the UK
The 2016 Immigration Act in the UK, the second set of reforms to the British asylum system within two years, scores the second highest on the societal conflict dimension, just behind the Civil Law episode in Hungary. However, given the fact that this episode is a comprehensive reform package rather than a direct and targeted assault on civil society, we consider it more interesting than the Civil Law episode for the illustration of societal conflicts in the context of refugee crisis management.
In terms of the demand-side and supply-side correlates, the conflict took place in an environment of low problem pressure (the UK had to deal with one of the lowest average levels of monthly claims relative to its population), low political pressure (although UKIP was polling strongly in the period before the Brexit referendum, it had not reached its peak yet and did not even come close to the electoral strength of right-wing challengers elsewhere, such as France and Austria), and moderate demand-side salience of immigration. The episode was not particularly politicized (its average politicization score is well below the sample average), and the government received a low level of average support for its initiative. Though the government itself stayed largely united throughout, both the parliamentary opposition and civil society actors took a resolutely hostile and critical stance toward the proposal. However, the intensity of the conflict with civil society was higher, not least because the leader of the parliamentary opposition, Jeremy Corbyn, tried to strike a cautious tone in his criticism of the bill, fearing an exodus of Labour voters to UKIP.
The conflict between the government and civil society was entirely unidirectional, with all such exchanges being initiated by civil society and targeting the government. Being shut out of the institutional venues for voicing their opposition, these civil society actors communicated via the media and collected numerous petitions against the government. Different groups, often in coordination with each other, focused on different aspects of the bill. Some of the criticism from media actors and landlord organizations concerned the Right to Rent scheme and the expected discrimination that tenants would face as a result. The social workers’ union demanded appropriate funding of specialist social and health care support for refugees and asylum seekers, accusing the government of turning a blind eye to children in particular. Business leaders accused the government of “taxing talent” in relation to the visa levy for companies employing foreign workers. The Scottish Refugee Council emphasized issues of regional competences and institutional prerogatives, accusing the government of treating devolved administrations as “second class” because of its attempt to circumvent the Scottish parliament in key areas of housing, child protection, and licensing.
Ultimately, none of the criticism against the government proved particularly effective, perhaps because of the cautious and restrained attitude of the parliamentary opposition; the lack of involvement of international actors; and the general honeymoon period that David Cameron’s single-party government enjoyed at the time, just a few months after its reelection in May 2015. Nevertheless, the episode illustrates the potential vulnerability of governments to societal conflicts in complex policy episodes that touch upon a multitude of issues, drawing a large number of stakeholders and opponents into the debate.
Intragovernmental Conflict: “Wir Schaffen Das” in Germany
When on the eve of September 4 German chancellor Angela Merkel made the fateful decision to suspend the Dublin regulation and leave the southern border with Austria open to Syrian refugees traveling to Germany via transit countries, she made one of the most controversial policy decisions during the whole refugee crisis, splitting German society (and the wider European public for that matter) to its core. One of most unique features of this episode – “Wir Schaffen Das” – for the purposes of this chapter is the main locus of conflict being within the government, as opposed to the international, partisan, and societal conflict lines we have presented above. This intragovernmental conflict pitted three main actors against each other: the national government; the grand coalition partner (SPD); and perhaps most importantly, the Bavarian sister party of Merkel’s CDU, the CSU. Most prominently, Horst Seehofer, leader of the CSU and Merkel’s most influential critic, proved to be the protagonist in this conflict line both as initiating actor and as a target of his opponents, including Merkel herself.
The episode took place in the very center of the refugee crisis, both in terms of space (Germany received the highest number of asylum claims in absolute terms) and in time (autumn 2015, the peak of the crisis). Accordingly, the conflict was met with high problem pressure and demand-side salience. Political pressure, on the other hand, was comparatively low because the right-wing challenger party AFD would begin its steady rise in the polls only after this episode. Though politicization remained moderate, the government nevertheless received the lowest level of support for its policies (–0.21) among all the episodes, a general feature of such intragovernmental conflicts.
Zooming in on the intragovernmental triangle, the most common initiator of these exchanges is the senior ruling party (mostly the CSU, represented by Seehofer, and to a lesser extent the CDU), accounting for 47.1 percent of such exchanges, with the junior member in the grand coalition, the SPD, in second place (33.8 percent) and the national government accounting for a mere 19.1 percent. On the target side, however, the government found itself in the center of the attacks, accounting for 72.1 percent of all targeted actions, with the senior ruling party (again, mostly the CSU) in second place. The SPD, on the other hand, was largely spared attacks in this intragovernmental conflict, with only a single action targeted against it.
The role of Seehofer in the conflict deserves special attention. He engaged in critical action against the government no fewer than ten times, with all of these actions being targeted at Merkel personally. He first personally entered the debate after a successful petition by CDU-CSU members to reintroduce border controls at the Austrian border, with the important caveat that refugees would still be allowed to enter the country upon registration. On the day of the closure (September 14), he criticized Merkel in an interview with Der Spiegel, calling her earlier decision to open the border “a mistake that will haunt us for a long time to come.” He continued his attacks in October, claiming that “a new order and new content [were] necessary at a government-level.” This statement was interpreted by many as a de facto vote of no confidence in the chancellor. Later that month, he went further by threatening to issue a complaint of unconstitutionality against the federal government, followed by an ultimatum targeting Merkel that pressured her to slow down the flow of refugees. It was not just Seehofer, however, who contributed to the conflict from the CSU’s side. Other prominent names included Edmund Stoiber, a previous Bavarian premier and chancellor candidate; Thomas Holz; and Michael Müller.
The government and its CDU allies tried to hold the ground in the midst of these attacks. First, Merkel simply tried to dismiss Seehofer’s critiques, sticking to her line on humanitarian grounds. Later, she sharpened her tone and engaged in public dialogue with him. For instance, in response to Seehofer’s threat of issuing a complaint of unconstitutionality, she rebuked him with a public letter, claiming his “accusations are invalid.” In mid-October, one of her closest allies in the CDU who would become a chancellor-hopeful for a brief period of time later on, Annegret Kramp-Karrenbauer, rushed to Merkel’s defence in a thinly veiled attack on Seehofer in an interview. She stated that “as politicians it is not our responsibility to fuel fears, but to devise solutions for impending problems.”
During the conflict between Seehofer and Merkel, the junior coalition partner, the SPD, took a cautious stance on Merkel’s side. Their critical remarks were mostly aimed at Seehofer instead. In the early stages of the episode, Dieter Reiter, the SPD mayor of Munich, explicitly endorsed Merkel’s “Wir Schaffen Das” idea. Upon the reintroduction of border controls, SPD secretary general Yasmin Fahimi harshly criticized Seehofer for inviting Hungarian premier Viktor Orbán for a meeting, in what she described as a “stab in the back of Merkel.” The chairwoman of the Young Socialists in the SPD (Jusos), Johanna Uekermann, went even further and recommended that the CSU consider leaving the coalition government. That said, the SPD’s attitude toward the government was hardly without a critical undertone. Reiter criticized the interior minister, Thomas de Maizière, claiming that “the humane and dignified treatment of hundreds of thousands of refugees arriving in Germany is a national task, and so far Berlin has not risen to the challenge.” Minister President Malu Dreyer from Rheinland-Pfalz reiterated the SPD’s support for Merkel’s “Wir Schaffen Das” but at the same time criticized the chancellor in an interview for failing to maintain discipline in the coalition. The SPD’s rhetorical strategy illustrates, among other things, that nongovernment actors can contribute to the conflict even if they are in agreement with the policy initiative in substance.
All in all, the “Wir Schaffen Das” episode was a paradigmatic example of an intragovernmental conflict with multiple actors stuck in a tug-of-war in a situation of high problem pressure and public salience. Ultimately, Merkel would emerge from this conflict politically weakened, paving the way for the AFD to emerge as a strong right-wing challenger party in the German political scene.
Conclusion
As we have shown in this chapter, the domestic responses to the refugee crisis in the period between 2013 and 2020 exposed vastly different conflict lines running through European societies. In particular, we argued that the integration–demarcation cleavage that rose to prominence in the context of the refugee crisis triggered four types of conflicts throughout the policy debates. The two most common types of conflicts were partisan conflicts on the one hand and international conflicts on the other. In international conflicts, national governments found themselves in opposition to EU actors, foreign governments, and/or other supranational institutions such as the UN. Such conflicts were almost the exclusive remit of Border Control episodes. Partisan conflicts, on the other hand, covered a more diverse set of episode types. In these episodes, mainstream opposition parties emerged as the most common adversaries of national governments, though on occasion they were aided by the challenger opposition both from the left and especially from the right. However, in particular cases as we have shown via the example of the Rights of Foreigners Bill in France, the left-wing challengers were somewhat more active in the debate than the National Rally, though all challenger parties paled in comparison to the mainstream opposition’s (The Republicans) contribution to the conflict.
Comparatively speaking, societal and intragovernmental conflicts were fewer. Societal conflicts are characterized by a stand-off between governments and civil society groups that comprise a wide array of different actors, such as NGOs, experts and academics, unions, religious institutions, or groups of migrants themselves. In our policy episodes, NGOs proved to be the most common type of such civil society actors, and our brief summary of the 2016 Immigration Act in the UK has revealed the type of civil society organizations that played the central role in this societal conflict line. Finally, the intragovernmental conflicts are the fewest but arguably the most intense, as is evidenced by the low level of support that governments received for their policies in their wake as well as the high levels of problem pressure and public salience that tend to accompany them. These conflicts mostly occurred in Germany and to some extent in Austria and Italy. Via our summary of this type of conflict taking place in the context of the “Wir Schaffen Das” episode in Germany, we have shown that this conflict can occur via multiple channels: either between the coalition partners (coalition splits) or within the government (and within the senior ruling party). In the “Wir Schaffen Das” episode, both of these channels were present, but in other episodes, one of the two is likely to dominate. We shall further elaborate on the details of such conflicts in Chapter 7 of this volume.
Though we have adopted a stylized categorization of episodes in terms of the dominant conflict line that prevails in each, in reality, many of the episodes were driven by multiple conflicts that simultaneously unfolded in them. Hungary, the country that stands out for its high level of overall conflict intensity, is the paradigmatic case for such parallel conflicts with three of the four conflict lines – the international, the partisan, and the societal – at comparable strength. These parallel conflict lines are perhaps the most important feature of the refugee crisis at the domestic level. In contrast to the EU-level conflicts that largely unfolded between member states and EU institutions, as we shall show in the next chapter, the domestic debates revealed a much more complex reality with a diverse set of actors involved. Throughout the refugee crisis, governments were trapped in a two-level game, with their bargaining power in the European arena conditioned by the type and the intensity of conflict they faced from domestic stakeholders – with the fate of the millions of refugees making their way to the EU in the balance.
Introduction
In this chapter, we present the actors and conflicts at the EU level. The study of these aspects of the crisis management includes the analysis of the actors and conflict configurations in the different episodes as well as the politicization of the episodes. We begin by introducing expectations about the actors and conflict structures at the EU level, which reiterate some considerations we have already introduced in Chapters 1 and 2. Next, we proceed to presenting the actor distributions and conflict structures in the six EU-level episodes. In a third step, we show how the various episodes have been politicized by the different actors and adversarial camps that we identified previously, overall and in the two key phases of the refugee crisis – the peak phase preceding the conclusion of the EU–Turkey agreement and the phase following the adoption of this agreement.
As we have argued in Chapters 1 and 2, in the multilevel polity of the EU, the supranational level is not just another level at which international agreements are negotiated to be subsequently implemented nationally. Polity membership creates a foundational interdependence that stems from the original choice to become a member of a compulsory association. Market integration and the extensive pooling of core state powers have increased this interdependence over time. Still, the EU is not a full-fledged federal system, and the degree of interdependence varies by policy domain. As we have observed in Chapter 4, in the domain of asylum policy, responsibility is shared between the EU and its member states. While the latter have retained core competences, their policymaking still depends on the common Schengen–Dublin framework. Moreover, the policy-specific legislative framework is embedded in the overall institutional structure of EU decision-making. In asylum policy, the mixture of interdependence and independence of the member states imposes reciprocal constraints on the decision-makers at each level of the EU polity: On the one hand, the interdependence restricts the possible policy responses of national policymakers, and on the other hand, the independence that national policymakers still enjoy constrains the decision-making at the EU level. The limited competence of the EU in the asylum domain poses a great challenge for joint EU policymaking in times of crisis.
In terms of relevant actors, the grand theories of European integration locate the power alternatively in the supranational agencies – the Commission (neofunctionalism) or the European Council (new intergovernmentalism) – or in the member states (liberal intergovernmentalism, postfunctionalism). Given the low capacity and lack of policy resources of supranational institutions in the asylum policy domain, we expect supranational entrepreneurship to be highly constrained (Moravcsik Reference Moravcsik2005: 362–363). Under such conditions, the success of the policy proposals by supranational actors depends on the support by the member states. In the case of the refugee crisis, opposition to joint solutions and conflicts between the member states have been reinforced by two conditions: First, the member states were asymmetrically affected by the crisis and unequally prepared to deal with it. While the frontline and open destination states, the states directly hit by the crisis, favored joint solutions, the bystander and to some extent also the transit and closed destination states were less affected by the crisis and therefore were less ready to share the burden (Noll Reference Odmalm2003; Bauböck Reference Bauböck2018). Second, joint action was constrained, and conflicts between member states were reinforced by the politicization of national identities produced by the uneven distribution of crisis pressures within the EU polity. Consistent with the predictions of postfunctionalism, the tension between the uneven distribution of costs and benefits of crisis resolution at the international level and the limited scope of community feelings at the national level has made opposition to EU policy proposals more vocal. As pointed out by Ferrara and Kriesi (Reference Ferrara and Kriesi2021), this decision-making scenario is consistent with the postfunctionalist notion of “constraining dissensus.”
It is the territorial channel of representation in the EU that provides the most important (although not the exclusive) conduit for the politicization of the reciprocal constraints and related conflicts. Accordingly, intergovernmental coordination has become the key decision-making mode in the EU in general, and particularly in crisis situations. In this mode of decision-making, the heads of member state governments (in the European Council) and responsible ministers (in the Council of Ministers) assume a decisive role. They provide the critical link between the two levels of the EU polity. As a result of their dual role – that of head of state or government representing a country in European negotiations and that of member of the European Council representing Europe back home – the executives of the member states become the pivotal actors in the two-level game linking domestic politics to EU decision-making. Accordingly, we expect the governments of the member states and their key executives to play a crucial role not only in domestic policymaking in the refugee crisis but also in policymaking at the EU level.
Under crisis conditions, the role of key executives of both the EU and member states is likely to become even more prominent. Under such conditions, which combine high political pressure in the sense of conflict-laden salience with high time pressure (urgency), executive decision-making is expected to become the preferred mode of decision-making both at the supranational and the national level. In a crisis, policymaking is no longer confined to the policy-specific subsystem (asylum policy in our case); rather, it becomes the object of macro-politics or “Chefsache,” to be taken over by the political leaders who focus on the issue in question. The decision-making mode of intergovernmental coordination corresponds to the EU-specific version of executive decision-making.
Foremost among the expected conflict lines are the vertical and transnational conflicts involving member states and the EU. In Chapter 2, we have formulated some expectations about these conflict lines. At this point, we reiterate the general expectations formulated in Chapter 2. In the short run, that is, in the early phases of the crisis, we expect open destination and transit states to share a common interest in stopping the flow of arrivals and in sharing the burden of accommodating refugees, which aligns them with the frontline states but opposes them to the restrictive destination states and the bystander states. While at first the transit states’ interests are clearly in line with those of the open destination and frontline states, the position of transit states is likely to get more ambiguous as the crisis progresses, since they clearly benefit from the secondary movements of the refugees within the EU. Moreover, the frontline and destination states are also divided with regard to the reform of the CEAS: Together with the other member states, open destination states are in favor of restoring the Dublin regulation, while the frontline states demand reform of the CEAS to share the responsibility for accommodating the flood of new arrivals.
The configuration of member states’ interests is further complicated by country-specific conditions. Thus, as a nonmember of the Schengen area, the UK largely stands outside of conflicts involving burden sharing. The ambiguous crisis situation of transit states provides room for mobilization by political entrepreneurs, as has been the case of Prime Minister Orbán in Hungary and of Foreign Minister Kurz in Austria. Similarly, the ambiguous situation of frontline states, which have to deal with incoming arrivals but have an incentive to close their eyes to secondary movements, also provides opportunities for political entrepreneurs to exploit the crisis, as we have also discussed in previous chapters. Moreover, the directly concerned states that are interested in joint solutions do not necessarily all sit in the same boat. In general, their support for joint solutions depends on the specific conditions attached to them: If the EU intervention comes with strings attached and is perceived to impinge upon the state’s sovereignty, it may not be accepted even if it were to bring direct relief from the crisis pressure. Thus, external border control, demanded by open destination states, may involve the direct intervention of the EU in the national sovereignty of frontline states, as was the case in two EU episodes – the episodes of the hotspots and the EBCG. In the hotspot episode, the frontline states were expected to take back all the responsibilities they shoulder under current EU legislation, an expectation to which, as we have seen in Chapter 5, they responded with foot-dragging and other forms of informal resistance. In the EBCG episode, Greece was reluctant to subscribe to the plan to deploy the transformed EBCG without the consent of the directly concerned member state. Such resistance may be overcome by external pressure, as in the case of the hotspots, where the border closures at Greece’s northern border with Northern Macedonia put an end to Greek resistance, or by compromise solutions, as in the case of the EBCG, which implied that the EBCG could not be deployed without the consent of the directly concerned member state, which, in the case it refused to give its consent, risked a suspension of its membership in the Schengen area.
In addition to vertical and transnational conflicts involving member states, there are two other types of international conflicts involved in the policymaking at the EU level. One of them results from the EU’s strategy to externalize the burden of border control during the refugee crisis. As we have seen (Chapter 5), two of the six episodes at the EU level involved this kind of response to the crisis – the EU–Turkey agreement and the EU–Libya arrangement. In such instances, we expect the EU to present a more united front, since the externalization of the border control provides the EU member states with a public good from which they all benefit. Instead, the main conflict is expected to involve the EU and/or its member states on the one hand and the third country to which the burden is intended to be externalized on the other hand. In the case of Turkey, it was above all the EU that confronted the third country, while in the case of Libya, it was Italy, the member state most concerned by refugee arrivals from Libya. The other type of international conflict refers to other international organizations, which may get involved in the management of the crisis. Thus, White (Reference Wihtol de Wenden2020: 81f) points to the involvement of NATO in the management of border control with Turkey. Arguably, however, it was not NATO but UN organizations such as the UNHCR that played a considerable role in the management of the refugee crisis at the Turkish border with Europe. The UNHCR not only supported the reception efforts in the frontline states but also was a vocal critic of the situation in the hotspots and in the Mediterranean.
At the EU level, the conflict structure is expected to be dominated by these four types of international conflicts: vertical conflicts between the EU and the member states, transnational conflicts between member states, externalization conflicts with third countries, and conflicts with other international organizations. As we have seen in the previous chapter, at the national level, partisan, intragovernmental, and societal conflicts prevail, in addition to international conflicts. At the EU level, however, partisan conflicts are likely to be negligible, given the weakness of the European parties, while conflicts with civil society organizations are likely to play an important role, given the large number of humanitarian NGOs active in the migration policy domain (e.g., NGO ships in the Mediterranean rescuing migrants or NGOs supporting migrants in the camps). In addition to humanitarian NGOs defending the migrants, civil society actors also include migrant organizations, think tanks and individual experts making proposals for joint solutions (e.g., Gerald Knaus, head of the European Stability Initiative, the think tank that first floated the idea of the EU–Turkey Deal), or the media (e.g., by exposing shipwrecks or inhumane conditions in the camps). Finally, there is a possibility of intra-EU conflicts between different EU authorities. Conflicts between the Commission and the Council involve conflicts between the EU and the member states and are, therefore, already covered by the vertical conflicts introduced above. However, the crisis management may also pit other EU authorities against each other – for example, the Commission/Council against the European Parliament, all three institutions against specialized agencies like the ECB or Frontex, or different factions within one and the same institution (e.g., different Directorates-General [DGs] of the Commission).Footnote 1 We do not expect to find a lot of such internal conflicts, not only because conflicts within agencies are more difficult to pinpoint by our approach, which relies on public sources, but also because we assume that in the refugee crisis, the conflicts mainly involved member states, with respect to which the EU authorities took a rather homogenous position.
The Actors
For the actor distribution, we first show the distribution over three summary categories – member states, EU actors, and other actors. At the EU level, member states are virtually exclusively represented by national governments. Thus, the category of the member states is almost exclusively composed of national governments and their agencies and includes only a few actions attributable to local governments (1 percent) and to governing parties (2 percent). The category of EU actors is dominated by the Commission, which accounts for roughly half (49 percent) of the actions attributable to EU actors, the other half being almost equally divided between the Councils (European Council and Councils of Ministers) (24 percent) and other EU actors (European Parliament, parties, and specific agencies) (27 percent). The category of others consists of third countries (Turkey and Libya) (36 percent), supranational organizations (roughly 24 percent), and civil society organizations (roughly 40 percent). Table 7.1a presents the distribution of the actions in the six EU-level episodes over these three actor categories. As we can see, the member state governments and EU actors jointly dominate decision-making in four out of the six episodes. The other actors are very important only in the two episodes that aim at the externalization of border control. Obviously, in these two cases, the third country that is directly concerned plays a key role, as can be seen in Table 7.1b. Civil society is also important in these two episodes (as well as in the relocation episode). It includes above all NGOs (43.2 percent) but also experts and media (17.6 percent), migrants and their organizations (16.0 percent), and opposition parties (18.4 percent).
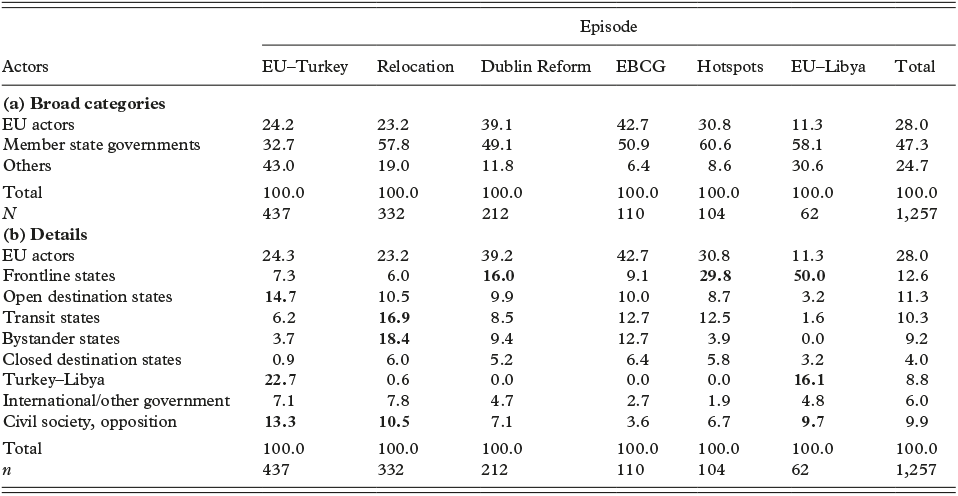
Table 7.1 confirms above all the central role of member state governments. At the EU level, they are even more important than at the national level (see Chapter 6): In all episodes except for the EU–Turkey agreement, they are the most salient actors and account for almost half of the actions overall, compared to a third at the national level (see Table 7.1). Table 7.1b demonstrates that, except for the closed destination states, which are least present at the EU level, all types of member states are roughly equally represented in EU episodes. However, each type is not equally represented by its component members. Thus, Germany accounts for no less than three-quarters (76.8 percent) of the actions of the open destination states, while Sweden is virtually absent at the EU level (with a share of only 3.5 percent of EU-level actions of open destination states). Even Luxembourg and the Netherlands (which assumed the EU presidency in the second half of 2015 and in the first half of 2016, respectively) have a greater presence among the open destination states, with 7 to 8 percent of the latter’s actions each. The interventions of the frontline states are mainly attributable to Italy (60 percent) and Greece (30 percent); those of the transit states mainly to Hungary (47 percent), Austria (34 percent), and Bulgaria (12 percent). The actions of the bystander states are more evenly distributed among a larger number of states, but the Czech Republic and Slovakia (22.6 percent each) as well as Poland (16.5 percent), which together with Hungary formed the V4 group, are the ones most present. Finally, the closed destination states are above all represented by France (with a share of 68 percent of the corresponding actions). The German government is the most salient member state government at the EU level, closely followed by the Italian government, and, at a greater distance, by the governments of Hungary, Austria, and Greece.
The presence of the different types of member states varies, however, from one episode to another. Thus, the open destination states (and above all Germany) were most involved in the EU–Turkey agreement. The frontline states dominated in the EU–Libya episode (Italy) and in the hotspot episode (Greece), and they were also heavily present in the Dublin Reform episode, where they are the key promoters of reform. The transit and bystander states, in turn, predominated in the relocation episode, where they were the main adversaries of a joint solution. The closed destination states, finally, were a minor force in all episodes, which reflects the fact that they were hardly affected by the crisis.
We also present the target actors in Table 7.2. While national governments are the preferred targets at the national level (see Chapter 6), at the EU level, it is the EU institutions that are the most important targets – overall and in four out of the six episodes. Only in the externalization episodes is the third country targeted even more frequently. This already foreshadows that the conflict lines run between the member states (the most important actors) on the one hand and the EU institutions and third countries (the most important targets) on the other hand. In terms of member states, the frontline states are the most frequent targets. Especially in the hotspot episode, Italy and above all Greece were the privileged targets of the interventions by the EU and other member states. In the EU–Libya episode, it was Italy that played the key role as both actor and target.
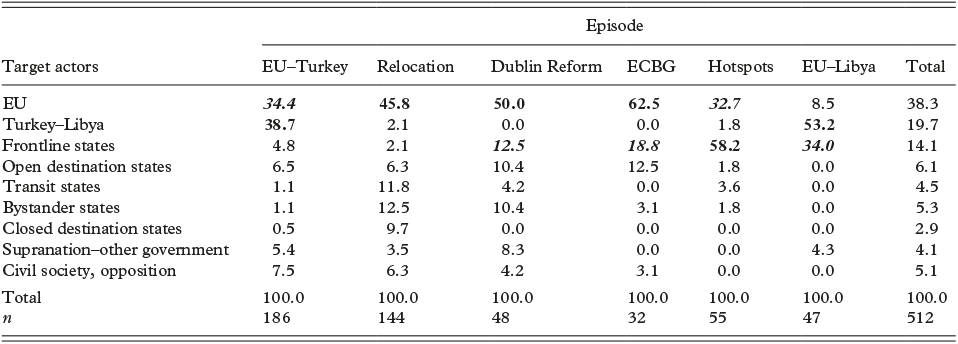
Turning to the individual actors, the question is whether the top executives played the expected role in the policymaking processes at the two levels. In this respect, we distinguish between four types of actors: top executives at the EU and the national level; other individual actors who have been mentioned by name in the media reports; and institutional actors, who are responsible for actions that have not been explicitly attributed to any individual. The top executives at the EU level include two leaders – Commission president Jean-Claude Juncker and Council president Donald Tusk. At the national level, they include the prime ministers and presidents (where they are not merely symbolic figures) representing our eight countries: Alexis Tsipras for Greece; Matteo Renzi, Paolo Gentiloni, and Giuseppe Conte for Italy; Viktor Orbán for Hungary; Werner Faymann, Christian Kern, and Sebastian Kurz for Austria; Angela Merkel for Germany; Stefan Löfven for Sweden; François Hollande, Emmanuel Macron, and Manuel Valls for France; David Cameron for the UK; and Ahmet Davutoğlu and Tayyip Erdogan for Turkey.
Table 7.3 compares the role of top executives in the decision-making processes at the EU level with their role at the national level. As is immediately apparent, top executives play a more important role in EU decision-making than in decision-making at the national level. Moreover, national top executives are more prominent policymakers in these crisis episodes at the EU level than EU top executives are. This confirms the expected pivotal role of government leaders of the member states in the two-level EU decision-making. They account for no less than one sixth of the actions (17.4 percent) in the policymaking processes at the EU level. The most prominent individual actor at the EU level is the prime minister from the most important member state, German chancellor Angela Merkel, who, on her own, accounts for 4.6 percent of all actions. She is followed by Commission president Jean-Claude Juncker and the Hungarian prime minister Victor Orbán. By contrast, EU top executives are virtually absent from the policymaking process at the national level. In national policymaking, power is not only more divided among a larger number of participants but also more focused on national policymakers.
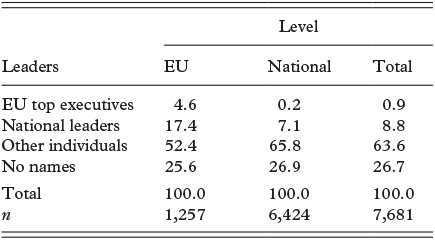
The influence of top executives varies by stage in the policymaking process. As is shown in Table 7.4, EU top executives are most important in the proposal and negotiation phases of this process, while top executives of member states have a most important role to play in the negotiation and adoption phases of this process – mirroring the respective institutional roles of the EU Commission and the EU Council. Thus, Commission president Juncker is the individual leader most present in the proposal stage, accounting for 7.4 percent of the corresponding actions, while German chancellor Angela Merkel is responsible for no less than 10.8 percent of the actions in the negotiation phase and for 4.3 percent in the adoption phase. Only Jean-Claude Juncker comes close to her in the negotiation phase, accounting for 5.2 percent of the actions. No one else is as prominent as Chancellor Merkel in the adoption phase. These shares are all the more remarkable if we keep in mind that at the various decision-making stages, institutional actors predominate in the public sphere. As Table 7.4 shows, in the public, the actions in the decision-making stages are above all attributed to institutional actors. By contrast, it is the public claims-making that is attributed above all to individual actors and, as the table shows, it is in this respect that the top executives of the member states are also highly present. They constitute the public face of the decision-making process at the EU level during the crisis, which implies that they are also the actors who take public responsibility for these decisions and who are most likely to be blamed for them by the public.
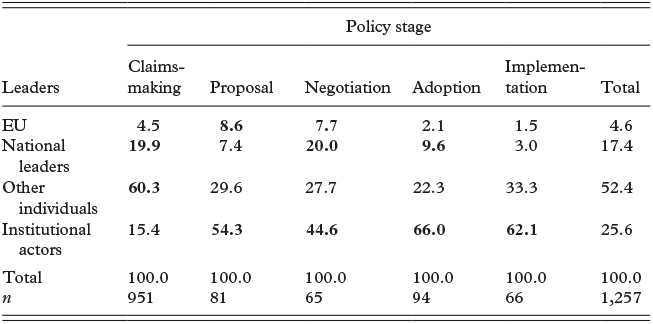
Conflict Lines
The actors involved in the policy debate, either as initiators or as targets, reveal only one aspect of the conflict. To understand the nature of the conflict in a given policy episode, we need to make refinements both conceptually and in operational terms. Our indicator for conflict intensity, which we use here, captures both the directionality of actors’ action vis-à-vis their targets (positive, negative, or neutral) and the type of actions they undertake (see Chapter 6). It suffices to reiterate at this point that conflict intensity is a composite indicator of the actor direction vis-à-vis the target and the type of policy action that the actor undertakes.
Table 7.5 presents the average intensity of six conflict types in the six EU episodes. The most important conflicts per episode are printed in bold, the second most important conflicts are in italic. As expected, the vertical and transnational conflicts constitute the two most important conflict lines in four out of the six episodes – the two episodes involving the Asylum Rules (Relocation and Dublin Reform) and two of the Border Control episodes (Hotspots and EBCG). By contrast, the two Externalization episodes (EU–Turkey and EU–Libya) above all gave rise to conflicts between the EU and the respective third countries, with the EU–Turkey agreement the most conflictual of all the episodes. Compared to these three types of conflicts, the other conflict types were at best secondary. Conflicts with international organizations and intra-EU conflicts were generally of low intensity. The exception concerns the EBCG episode, where the transformation of Frontex into the new EBCG created some intra-EU conflicts. Conflicts between the EU/its member states and civil society have been of some importance in two episodes – the EU–Turkey agreement and the relocation quotas. In the EU–Turkey case, NGOs and opposition parties heavily criticized the deal because they did not consider Turkey a safe third country, given the human rights abuses in Turkey. They also criticized the implications of the deal for the refugee camps on the Greek islands, which suddenly became closed centers where the refugees were stuck and had to count on being returned to Turkey. In the relocation episode, NGOs like Amnesty International and left-wing opposition parties pleaded for a relocation of refugees across Europe, while right-wing opposition parties like Jobbik in Hungary, UKIP in the UK, and RN in France refused to accept additional quotas of refugees.
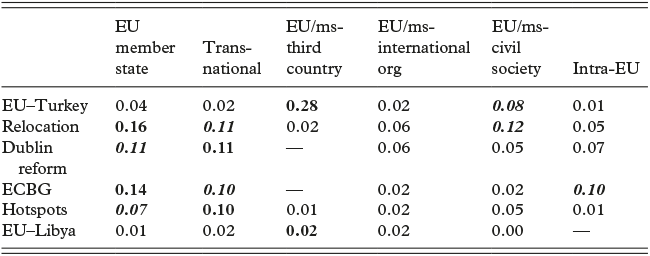
a The major conflict lines are in bold, the minor ones in italic.
Ms = member states.
To represent the resulting conflict structure between the nine types of actors we have distinguished in Tables 7.1 and 7.2, we calculated two types of dissimilarities for all the actor pairs involved (i.e., thirty-six pairs): the average distance between their positions on the six episodes at the EU level and the average conflict intensity between them (as actors and targets) across all six episodes. We then multiplied the two types of dissimilarity for each pair, which amounts to weighting the distance between the two actors’ positions with the conflict intensity between them. Finally, we analyzed the resulting matrix of dissimilarities with a multidimensional scaling (MDS) procedure. Such a procedure allows us to represent the overall actor configuration in a low-dimensional space, in our case in a two-dimensional space. Actors who took similar positions in the six episodes and who did not get involved in conflicts with each other are placed closer to each other in the resulting space, while actors who opposed each other in substantive terms and fought against each other to impose their own position against the position of their adversaries are located at some distance from each other. Figure 7.1 presents the resulting summary actor configuration.
Overall configuration of conflict structure at the EU level: MDS result

We can distinguish three camps in this actor configuration: the EU, which forms the core of the policymaking space, and two adversarial camps – the noncooperative camp of the transit and bystander states, and the humanitarian camp of civil society, which also includes the supranational institutions. The core camp of the EU is joined by the frontline states (Greece and Italy above all) and the closed destination states (represented above all by France), which share similar positions. The open destination states (mainly Germany) are located at the mid-point between the EU camp and the civil society camp, which indicates that their position is closer to the humanitarian position of the civil society and the UNHCR, the most important supranational actor. The third countries, Turkey and Libya, are located between the noncooperative camp and the EU, which indicates that their position is more in line with the EU than that of the noncooperative camp but that nevertheless they are to some extent adversaries of the EU.
The noncooperation by the bystander and transit states became most obvious in the two episodes concerning the asylum rules. Three bystander states (Poland, the Czech Republic, and Slovakia) together with one of the transit states (Hungary) formed the Visegrad four group (V4), which blocked the implementation of the relocation scheme and prevented any reform of the Dublin regulation. In addition, under the leadership of yet another transit state, Austria, they embarked on the elaboration of a unilateral solution to the external border control, the closing down of the Balkan route, which they implemented by the end of February 2016. In the short run, this solution isolated Greece, but it ended up being instrumental in getting the cooperation of Turkey in the external border closure in the Aegean Sea, which allowed keeping Greece in the Schengen area.
Given the triangular configuration of the conflict space, two dimensions are needed to accommodate the relationships between the key actors at the EU level. The vertical dimension might be called the humanitarian dimension, separating most clearly the pro-humanitarian civil society actors from the noncooperative bystander and transit states. The horizontal dimension distinguishes most clearly between both the humanitarian and the noncooperative camps on the one hand and the EU camp on the other hand. We propose calling this the pragmatism dimension. The EU, together with the frontline and the destination states, tried to find a pragmatic solution to the crisis, which was opposed by the principled opposition from two sides – the civil society actors who opposed the pragmatic “realism” of the EU in the name of humanitarian principles and the V4 actors who opposed it in the name of the principles of national self-determination.
Politicization
The politicization indicators allow for yet another summary presentation of the conflicts that characterized the refugee crisis. We have already presented the thematic focus of the politicization at the EU level in Chapter 5. We would now like to focus on the contribution of the various actor types and actor camps to the politicization of the policymaking process at the EU level during the refugee crisis. Figure 7.2a presents these contributions as well as their two components – salience and polarization – for the more detailed actor types. In this figure, the overall politicization and its components have each been standardized to the 0 to 1 range. As the figure shows, the EU actors dominate the politicization at the EU level, as well as its components: They are not only the most salient actors at this level, but they also contribute most to the overall polarization. Together with the destination and the frontline states, they are most supportive of the policy proposals at this level, but together with their allies, they also face strong opposition from the two adversarial camps, and they constitute the most frequent targets of this opposition – as we have seen in Table 7.2. In other words, EU actors constitute the most conspicuous actors on the supportive side of the policy proposals, which makes them at the same time the most conspicuous adversaries of the opponents of these proposals.
Politicization and its components by actor types: standardized averages.
Actor types;

actor camps

The contribution to the politicization by all other types of actors is more limited, since they are both less salient (they account for at most a third of the actions of the EU actors) and less polarizing (they are at best roughly half as polarizing as the EU actors). The closed destination states are the least politicizing actors of all, which confirms the limited stakes they had in the refugee crisis.
In the previous section, we have seen that the EU actors are allied to the frontline and destination states, which both count on joint solutions at the EU level, and opposed by two camps – the civil society camp and the camp of the transition–bystander states, with the third countries being caught somewhere in between. If we combine the actors into these opposing camps, we get a better sense of the politicization by the opposing forces. As we can see from Figure 7.2b, once we combine the actors of the camps, the EU actors no longer stick out. Taken together, the member states allied to the EU actors are contributing just as much to the politicization of the policy response in the refugee crisis as the EU actors themselves are, in terms of both salience and polarization. The two opponent camps contribute to the overall politicization to a lesser degree, since they are less present, although they are still highly polarizing. Compared to these three camps, the third countries are hardly contributing to the politicization at all. While they are contributing to the conflict intensity, as we have seen previously, they are much less visible in the European public sphere, and their opposition to the EU decision-makers is also less pronounced than the opposition from some member states and from civil society.
If we finally break down the actors’ contributions to the politicization of the policymaking process by episodes, we find that the politicization of the relocation quotas by the adversaries from bystander and transit states dwarfs all other contributions to the politicization of EU episodes (see Figure 7.3). Overall, the EU–Turkey episode has been more politicized than the relocation episode because it has been politicized by a broader set of actors, which notably does not include the bystander and transit states (see Table 4.2). However, the single most important contribution to the politicization of the refugee crisis at the EU level has been made by the opponents to the relocation quotas. This goes a long way to explain why this kind of proposal had no chance for success in subsequent debates and why later attempts to reform the Dublin regulation, which always contained some related policy ideas, have repeatedly failed.
Politicization by broad actor camps and episodes: standardized averages

Phases of the Policymaking Process at the EU Level
At the EU level, we can clearly distinguish between two phases in the policymaking process – the phase preceding the conclusion of the EU–Turkey agreement and the phase following it. About half of the actions at the EU level fall into the short first phase that lasts for less than one year, from the adoption of the European Agenda for Migration in May 2015 to the adoption of the EU–Turkey agreement in March 2016. The second half of the actions is drawn out over a four-year period that ends in February 2020. The first phase, which corresponds to the peak period of the crisis, was dominated by the two most politicized episodes – the EU–Turkey agreement and the relocation quotas. It also included most of the hotspot episode. As is shown in Table 7.6, the two most important episodes also extended into the second phase, but during this period, they no longer dominated to the same extent. The Dublin Reform became as important as the two more specific issues, and the attention shifted to the external borders in the center of the Mediterranean. This is also illustrated by Figure 7.4, which displays the relative politicization of the episodes in the two phases.
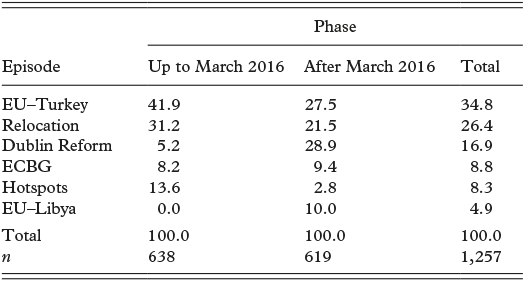
Politicization by episode and phase, average index value

Distinguishing between the two phases, we can also detect the development of the overall conflict structure at the EU level over the course of the crisis. The conflict structure was not yet as clear-cut in phase 1 and really became consolidated only during the long, drawn out phase 2. This is illustrated in Figure 7.5, which displays the conflict structures in each one of the two phases. In the first phase, at the peak of the crisis, the open destination and the frontline states constituted a cluster of their own, in the middle of the space. Their joint interest in stopping the flows and sharing the burden between all member states brought them together and placed them in opposition to some extent to all the other major actors. During the second phase, their interest became more aligned with those of the EU actors, and they also found a close ally in the closed destination states (above all, France). In the configuration of the second phase, the tripolar structure presented in Figure 7.1 emerged as a consequence of the management of the crisis. The contrast between the bystander–transit states alliance (V4) on the one hand and the frontline–destination states–EU alliance on the other hand becomes quite clear. The civil society actors and the other supranational actors (mainly the UNHCR) constitute the third (humanitarian) pole, which is opposed to both the intransigent defenders of exclusively national solutions (the V4) and the pragmatic defenders of burden sharing and of a reform of the Dublin regulation, who can rely on the support of the Commission and of the most important member states – Germany, France, and Italy. The third countries, which have become key partners of the EU in this policy domain, are located in between the three poles, ready to play off one against the other.
The conflict structures at the EU level, by phase: MDS results

Conclusion
At the EU level, international conflicts prevailed. These were mainly of three types – vertical conflicts between the EU and its member states, transnational conflicts between member states, and externalization conflicts between the EU/member states and third countries. The episodes that did not involve third countries were characterized by the first two types, while the externalization episodes obviously involved third countries. Other types of conflicts were secondary. The emerging conflict structure, which was consolidated only in the long period after the conclusion of the EU–Turkey agreement, is characterized by the antagonistic relationship between three camps – the EU core coalition (including destination and frontline states in addition to EU actors); the coalition of transit and bystander states; and the coalition of civil society actors, international organizations, and domestic opposition parties. The two-dimensional conflict space is structured by a dimension that opposes the pragmatic, “realist” EU and its allies to its principled adversaries, and a dimension that distinguishes its humanitarian from its nationalist adversaries. At the EU level, the sovereignty camp is composed of member states that have been largely spared by the refugee crisis and that refuse to share the burden of refugees with the hard-hit destination and frontline states. The latter in turn seek the help of the EU actors in their quest for burden sharing with the member states that have been largely spared by the crisis.
The actor configuration confirms the expectation that member states and their key executives play a crucial role in the two-level game of EU crisis management. In a policy domain where the EU shares its competences with the member states, it is unable to impose its policy proposals without the cooperation of the member states. As we have seen, Germany, the “hobbled hegemon” (Webber Reference Weinberg2019), and its chancellor Angela Merkel played a key role in policymaking at the EU level. Even if it shared the most explosive combination of problem and political pressure with some other member states, the combined pressure became particularly important in the case of Germany because of its size and influence, which enabled it to take the lead in common initiatives. As is suggested by the public goods literature, Germany as the largest member state and the recipient of the largest number of refugees was most engaged in the search for joint policy solutions, since it had potentially more to lose (in absolute terms) from the nonprovision of the public good in terms of stability and security, and since it also was the member state that was best able to unilaterally make a significant contribution to the provision of the public good (Thielemann Reference Thies2018: 69).
Introduction
In the previous two chapters, we have offered an analysis on the conflict lines that emerged at both polity levels: between member states and EU institutions, within member states, and between domestic actors and the EU. In this chapter, we continue this line of inquiry by zooming in on two types of conflicts: the conflicts within governments and the conflicts between governments and their domestic partisan opposition. For both types of conflicts, we put the role of government composition at center stage and argue that the fragmentation of governing coalitions as well as the ideological make-up of governments are important determinants of the extent and the type of domestic conflicts that emerge, as well as their substantive content. We consider government composition as an important and yet often overlooked variable in the refugee crisis. Since most of the governments in the countries we study came to power before the crisis reached its peak, their composition can be regarded as largely exogenous to the crisis itself, serving as an overarching constraint on political actors throughout the management of the crisis.
There were exceptions to this rule, however. In the spring of 2017, France experienced a political upheaval as the deeply unpopular government of Francois Hollande was replaced by Emmanuel Macron’s centrist coalition that included ministers from both the traditional left and the right. Later in the same year, one of Austria’s ruling parties, the center-right People’s Party (OVP), ditched its uneasy alliance with the center-left Social Democrats (SPO) and under the new leadership of Sebastian Kurz formed a right-wing government with the FPÖ, Austria’s long-standing radical right-wing challenger party. In the spring of 2018, Italy’s center left Democratic Party, unable to recover from the failed Renzi experiment, was severely punished at the polls and was replaced by the unwieldy populist coalition of the 5 Stars Movement and Matteo Salvini’s right-wing challenger party, the Lega. Finally, Greece also experienced a full-fledged partisan swing from the left to the right: Syriza was defeated decisively at the polls by its conservative rival, New Democracy, in 2019.
Though highly consequential, all these changes came in the later stages of the refugee crisis, which means that most of the policy episodes in our study fell under the departing governments. Moreover, in the four remaining countries, we observe remarkable continuity. After winning the 2015 election with an unexpectedly wide margin, the center right Conservative government of the UK stayed in power, now unconstrained by its previous junior coalition partner, the Liberal Democrats. In Sweden, the center left coalition led by Stefan Löfven came to power just before the start of the crisis and stayed there until the bitter end despite repeated attacks from the right-wing opposition for not taking a harder line against the influx of refugees. Angela Merkel’s grand coalition also survived the crisis despite the highly fractious relationship among the coalition partners, and despite an intervening election in fall 2017, as we shall see in greater detail later on in this chapter. Finally, the crisis did little to dent the stability of Viktor Orbán’s single-party government in Hungary; if anything, it allowed him to tighten his grip over Fidesz and catalyze Hungary’s descent into autocratic rule.
Behind these (partial) continuities within individual countries, however, there is important variation in government composition across policy episodes. In this chapter, we shall assess the explanatory power of this variation in order to account for the type of domestic conflicts that emerged. The first task of this chapter is descriptive: For both intragovernmental and partisan conflicts, we distinguish between various subtypes, relying on the fine-grained information that our PPA dataset provides on the general and specific institutional categories of the actors. Second, we aim to relate various aspects of government composition – namely, government fragmentation and their ideological make-up – to the type of conflict lines. Since our sample is rather limited – forty episodes in total – we limit ourselves to bivariate correlations rather than full-fledged multivariate statistical models, so we lay no claim on any definitive causal link behind the relationships we uncover. Third, we illustrate some of the patterns we have found via episode-specific narratives that illustrate the two main types of domestic conflicts and some of their subtypes. We motivate these empirical exercises, however, with some theoretical considerations derived from the coalition and issue competition literatures in the next section.
Government Composition and Political Competition
As the introductory discussion suggests, the bulk of the refugee crisis was managed by coalition governments. More precisely, twenty-eight out of the forty episodes – in their entirety or during the largest part of their timeline – fell under such government types. The rather obvious observation that coalition governments are not unitary actors has inspired a rich literature in political science, which examines how coalitions are formed (Debus Reference Debus2008; Laver and Shepsle Reference Laver and Shepsle1990, Reference Lazarsfeld, Berelson and Gaudet1990; Riker Reference Rinscheid, Pianta and Weber1984), how they allocate portfolios between each other (Fernandes, Meinfelder, and Moury Reference Fernandes, Meinfelder and Moury2016), and how constituent parties monitor coalition partners to prevent ministerial drift (Indridason and Kristinsson Reference Inglehart and Norris2013; Martin and Vanberg Reference Martin and Vanberg2004; Thies Reference Tilly2001). Underneath all these accounts, the common problem that coalition partners need to overcome is the multidimensional and often conflicting objectives they face when they are in government. The classic study on coalition behavior by Müller et al. (Reference Mulvey1999) distinguishes between three such objectives: policy, office, and votes.
While policy-seeking and vote-seeking behavior by coalition partners potentially pulls them apart as a function of the difference between their policy preferences (ideology) and the preference distribution and the overlap between their electorates, office-seeking motives exert a centripetal force on coalition partners because they have a joint interest in ironing out their differences in order to avoid a government collapse and present a united front to voters as viable coalition partners for the future. Since voters do not assess parties merely for their programmatic and ideological appeals but also for their role and performance as coalition partners (Blais et al. Reference Blais, Aldrich and Levine2006), incentives to signal agreement even against ideological preferences may serve the vote-seeking incentives of coalition partners as well. At the same time, however, coalition partners may also have an incentive to signal disagreement to facilitate voters’ responsibility attribution for policy outcomes (Duch, Przepiorka, and Stevenson Reference Duch, Przepiorka and Stevenson2015) and to counteract voters’ tendency to mesh the ideological profiles of coalition parties by putting them into the same basket (Fortunato and Stevenson Reference Fortunato and Stevenson2013). Which specific incentive structure prevails is a highly complex outcome of the party system, the most salient issue area of the day, and the electoral standing of the constituent parties. A complete analysis of all these considerations lies beyond the aim and empirical feasibility of this chapter. We limit ourselves instead to two aspects of government composition as explanatory factors: fragmentation and ideological composition.
The role of government fragmentation is a central insight behind the common pool perspective in budgeting, which argues that with an increasing degree of government fragmentation, the incentives of individual members to internalize the costs and to limit the adverse consequences of excess budgetary demands decrease (Martin and Vanberg Reference Martin and Vanberg2013; Perotti and Kontopoulos Reference Petrocik2002; Roubini and Sachs Reference Rucht and Neidhardt1989). We carry this logic forward to intragovernmental conflict beyond budgetary demands and argue that fragmentation within the cabinet is likely to increase incentives by coalition parties to emphasize their differences from coalition partners and reduce incentives to prioritize coalition unity and survival. Such conflict of interest can be especially sharp when coalition partners have equal or comparable access to policymaking levers (Bojar Reference Bojar2019).
The preceding discussion has been ideology-blind in the sense that fragmentation was conceptualized only in numerical terms. Fragmentation, however, has an ideological dimension, too: When coalition members hail from different party families, they are likely to have different policy preferences on immigration and therefore their policy-seeking preferences in the Muller and Storm framework will collide. By contrast, if coalition partners come from the same (or ideologically adjacent) party families, their policy differences are likely to be relatively small, so policy compromise (and lower levels of conflict) is easier to achieve. The second, ideological dimension of government composition thus predicts that with greater ideological distance between coalition partners, intragovernmental conflict is likely to intensify.
The pressure on government parties, as we have seen in the Chapter 6, more often comes from the opposition that tries to pin the government into a corner either by accusing it of doing too little in coming to terms with refugee flows or of excesses and inhumane treatment of refugees. The ultimate source of such partisan conflict is the radical right opposition that has had an immense influence on immigration-related policies over the past decades either directly (Akkerman Reference Akkerman2012; Schain Reference Schain2006; Carvalho Reference Carvalho2013) or by putting and keeping the issue on the agenda and compelling government parties to respond by getting tough on immigration both in rhetoric and in substance (Green-Pedersen and Otjes Reference Greussing and Boomgaarden2019; Bale Reference Angelescu and Trauner2003; Meguid Reference Meguid2005).
Though the distinction between mainstream parties and radical right challenger parties is analytically useful in this regard, we need to take a step further and distinguish between the center-left and the center-right both in government and in the opposition. The distinction is important when one considers the different strategies parties have when faced with issue competition from opposition parties that own an issue that is salient among the electorate (Green-Pedersen and Mortensen Reference Green-Pedersen and Otjes2015). One of these strategies is issue avoidance, as documented in the Swedish context by Odmalm (Reference Odmalm and Super2011): When parties are faced with challenges from parties that own the immigration issue, it might be electorally worthwhile for them to avoid engaging with the challenge, lest it divert attention from the parties’ core competencies. This consideration is expected to weigh particularly heavily in the calculus of center-left party strategists, which have an ideological inclination to offer a comparatively permissive stance on refugees that may clash with the vote-seeking objectives of the party if forced to compete on the immigration issue. The center-right, by contrast, is comparatively well positioned to compete on immigration (Pardos-Prado Reference Pardos-Prado, Lancee and Sagarzazu2015), as many of its voters share some of the underlying anti-immigration attitudes that allowed the radical right to capitalize on the refugee crisis (see Chapter 4). Therefore, when center-right governments are in power, partisan conflict is likely to be stronger because governments may actively compete on immigration, either by accommodating the radical right’s demands or by confronting these demands with an emphasis on their own competence to deal with immigration. In sum, our main expectation regarding partisan conflict is that the ideological composition of governments is related to the degree of partisan conflict, with center right governments engaging in more conflictual policy debates with opposition parties than center left governments do.
The foregoing considerations referred to only the intensity of the conflict, not its substantive content. In principle, the conflict both between government actors and between government actors and the opposition can revolve around either overly permissive or overly restrictive immigration policies. Though most of the policies we study imply significant tightening of the countries’ immigration regimes (see Chapter 5), governments can be under simultaneous pressure for breaching human rights and democratic principles and for not going far enough in limiting refugee flows. We expect the ideological composition of the government to be related to whether conflict revolves around humanitarian, solidaristic, and democratic considerations or around securitization, sovereignty-based, and identitarian principles. Specifically, while center left governments are more likely to engage in conflicts on the former grounds, their center right counterparts are more likely to engage in and respond to conflicts revolving around the latter.
Finally, in terms of partisan conflicts, it is not just the ideological composition of the government that matters but also the origin of the conflict. When conflicts emerge between the government and its right-wing opposition (either center right, or radical right), the security–sovereignty–identity mix is likely to predominate when compared to conflicts that emerge between governments and their left-wing opposition.
Data and Measurement
Many of the variables we use to test our theoretical expectations are based on the PPA dataset that we use throughout the book. In order to measure the intensity of intragovernmental and partisan conflicts, we revert to the conflict scores we derived in Chapter 6. In this chapter, we focus on only the intragovernmental and the partisan conflicts. We shall further investigate which particular actor pairs contribute most to these two conflicts. Within intragovernmental conflicts, the debate can unfold according to four different scenarios: within governing parties, between coalition partners, between government parties and the government, and within the government itself (for instance, between the prime minister and particular ministries). As for partisan conflicts, one of the conflicting parties is always the government (or government parties), but the adversaries can be the radical left, the radical right, the mainstream left, or the mainstream right. Figures 8.1 and 8.2 illustrate the distribution of these conflict sources in the policy episodes that we classified as intragovernmental conflicts and partisan conflicts, respectively.
The sources of intragovernment conflicts in the refugee crisis

The sources of partisan conflicts in the refugee crisis

Figure 8.1 shows the relative distribution of the four sources of intragovernment conflicts. Overall, the most common source is conflicts between government parties and the government, which arguably reflects the fact that parliamentary actors sought to achieve some sort of oversight over the crisis management of what has been predominantly an executive affair. In fact, more than half of such party–government interactions were initiated by senior government parties and targeted at the government. Comparatively speaking, conflicts within the government were rarer, on average. However, such conflicts were the dominant sources of intragovernmental conflicts in the Sicurezza Bis episode in Italy. In this episode, such within-government conflict was a triangular debate between the prime minister (Giuseppe Conte), the interior minister (Matteo Salvini), and the ceremonial head of state of the Italian Republic (Sergio Mattarella). Such a premier–interior minister stand-off was replicated in the CDU-CSU Conflict in Germany, where Chancellor Angela Merkel and Interior Minister Seehofer got caught in an acrimonious debate over the latter’s emboldened push toward a tighter asylum regime and an accelerated deportation process after becoming interior minister in the autumn of 2018.
Some degree of interparty debate was present in five out of the six intragovernmental conflicts, but in none of them was it particularly intense, with the partial exception of the integration law debate in Germany, where the three coalition partners – CDU, CSU, and SPD – exchanged verbal blows, with the SPD taking the leading role by criticizing the CSU on its hardline stance. Conflicts within the parties themselves were least common. They appeared only in the German episodes, whereas the Austrian and the Italian government parties managed to maintain party discipline and concentrated their efforts on criticizing coalition partners or the government.
Turning to partisan conflicts, Figure 8.2 displays their sources. As the reader may recall, partisan conflicts are significantly more common than intragovernmental conflicts, and there is a larger variation in the partisan patterns. What is immediately apparent is that governments engage in conflict much more often with their mainstream opposition rivals (especially with the center right) than with their radical challengers. The role of radical left challengers is especially limited. The mainstream right is an important source of conflict in six out of the thirteen episodes – in three of the four French episodes, in the Summer of 2015 episode in Greece, in one of the Hungarian episodes (“Stop Soros”Footnote 1) and the two Swedish partisan conflict episodes. The fact that the mainstream right has been a more vocal opponent of governments than the mainstream left provides early tentative support for the expectation that the center right has more to gain from politicizing immigration than the center left does.
On the radical end of the partisan spectrum, the dominance of the radical right is unsurprising. It has been the most vocal opponent of governments in one Austrian (Right to Intervene) and two French (Border Controls and Calais) episodes, consistent with their long-established presence in the political scene of the two countries. Comparatively speaking, Golden Dawn, Jobbik, the Sweden Democrats, and UKIP have accounted for a much more limited share of partisan conflict with the Greek, Hungarian, Swedish, and British governments. Overall, the share of a conflict that is attributable to the radical right tends to be higher in contexts where it is electorally stronger, such as France and Austria. The correlation coefficient between the average electoral strength of the radical right challengers throughout the policy episodes and the share of the partisan conflict with the radical right is 0.38. By contrast, the participation of the radical left in government–opposition conflicts is restricted to five of the thirteen episodes, and in none of them did it become a particularly prominent feature of the debates. The only partial exception is the Rights of Foreigners bill in France, but even here, merely two actions were targeted at the government by radical left politicians from the New Anti-Capitalist Party and the Radical Left Party.
After this brief overview of the sources of intragovernmental and partisan conflicts, we now return to the variables we highlighted as potentially important explanatory factors for the strength and substantive content of the conflicts.Footnote 2 For government fragmentation, we use the Herfindahl Index of governments from the Database of Political Institutions (Cruz et al. Reference Cruz, Keefer and Scartascini2021), which measures the sum of the squared seat shares of all parties in the government. In case of single-party governments, this indicator takes a value of 1, whereas for large coalitions constituted by many parties of roughly equal strength, it is close to 0. In our sample, none of the governments were particularly fragmented, so the effective distribution of the variable in our sample is situated between 0.5 and 1.
For the ideological variable, we rely on the GALTAN (Green–Alternative–Libertarian, Traditional–Authoritarian–Nationalist) score of parties assigned by experts participating in the Chapel Hill Survey (Jolly et al. Reference Bakker, Rooduijn and Schumacher2022). We use the respective scores from the survey wave closest to the corresponding policy episodes. The GALTAN score locates parties on a 0–10 scale, with higher values assigned to parties taking a position closer to the Traditional–Authoritarian–Nationalist pole and lower values for positions closer to the Green–Alternative–Libertarian pole of the attitudinal divide (Hooghe et al. Reference Bremer, Schulte-Cloos, Kriesi and Hutter2002). We measure the ideology of governments by the average of the governing parties, weighted by their seat shares in parliament. For ideological fragmentation, we take the average absolute distance between the GALTAN scores of the governing parties.
As Figure 8.3a reveals, governments in the refugee crisis spanned the entire ideological spectrum, with a slightly rightward skew. The most ideologically right-wing government (the third Orbán government in Hungary) is closer to the TAN pole than the most left-wing ones (the Renzi/Gentiloni governments in Italy) are to the GAL pole. Moreover, fifteen of the forty episodes occurred under left-of-center, and twenty-five occurred under right-of-center governments. The typical form of such left-of-center governments was a coalition between left-wing parties. An example of this constellation is the Swedish case, where the Social Democratic Party was in a coalition with the Green Party throughout all five Swedish policy episodes. Among right-of-center governments, we observe two main types. Twelve of the twenty-five right-of-center governments were single-party governments, such as the Fidesz-led governments in Hungary and the Mitsotakis-led government in Greece during the late Greek episodes in the years of 2019 and 2020. Another twelve were grand coalitions, which, due to the ideological position of the constituent parties as well as their relative strength, score above 5 on the weighted ideological position variable. Examples of such right-of-center grand coalitions are the German and the Austrian grand coalitions as well as the Lega–M5S government in Italy. In fact, the only left-of-center grand coalition in our sample is the French government led by President Macron’s centrist REM party during the Asylum Law episode. As for the ideological distance (displayed in the lower panel of Figure 8.3), single-party governments score 0, by construction. Most governments’ ideological distance varies in a moderate range between 0.2 and 0.4, and only a few governments display large differences between the coalition members on the GALTAN scale. This group includes two Greek episodes under the Syriza–Anel coalition and two Italian episodes under the M5S–Lega coalition.
Ideological position (a) and distance (b) of governing coalitions in the refugee crisis


The final measurement issue concerns the substantive part of the conflict. To this end, we rely on frame scores in our PPA coding, which distinguishes between ten frames actors use to justify their position/action (see Chapter 9). We distinguish between security–sovereignty–identitarian frames on one end and humanitarian–solidarity–democratic frames on the other. Our measure for the substantive part of the debate is then the share of these two types of frames among all the frames used. We limit this calculation to those actions that constitute the respective conflict lines for intragovernmental and partisan conflicts.
Government Composition and Political Conflict in the Refugee Crisis
We begin the empirical investigation with the relationship between government fragmentation and intragovernmental conflictsFootnote 3. As Figure 8.4 shows, the relationship is in the expected direction. All six episodes where such intragovernmental conflicts predominate are characterized by high levels of government fragmentation (relatively low scores on the Herfindahl index). On the other end, episodes falling under single-party governments all have a lower than average intragovernmental conflict score. The correlation between the two variables is rather high (–0.61), and even if we exclude all single-party governments from the sample and concentrate on coalition governments only, it is not much lower (–0.58).
Government fragmentation and intragovernmental conflicts

It must be emphasized, however, that the high levels of intragovernmental conflict associated with government fragmentation are largely driven by the German and the Austrian grand coalitions, as is readily visible in Figure 8.4. Though we operationalized government fragmentation simply by the relative strength of the constituent parties, certain other idiosyncratic features of these grand coalitions beyond party fragmentation provide equally important parts of the story. In the German case, one of these features is the role of the CSU, the Bavarian sister party of the senior government party, the CDU. A significant part of the intragovernmental conflict played out between this regional party and Chancellor Merkel and her party as well as the junior coalition member, the SPD. The leader of the CSU, Horst Seehofer, who also became interior minister in March 2018, played an especially pronounced role in this conflict due to his hardliner stance against Chancellor Merkel’s “Willkommenskultur” (see Chapter 6). In the Austrian case, an important venue for this intragovernmental conflict was the interaction between regional authorities and the central government. Although in Chapter 6 we treated such interactions as a distinct state–government conflict, it is important to recognize that several regional politicians played a prominent role in one of the government parties, such as Hans Niessl, SPÖ governor of Burgenland; Josef Pühringer, ÖVP governor of Upper Austria; and Michael Häupl, SPÖ mayor of Vienna. From their position as regional politicians, therefore, they also contributed to intragovernmental conflicts, particularly in the Asylum Law episode, where they launched no fewer than fourteen critical actions against the federal government. Intragovernmental conflicts in grand coalitions can thus be conceptualized as a result of government fragmentation in a broader sense that includes fragmentation across different levels of policymaking, particularly in federal countries.
The correlation between ideological fragmentation (average ideological distance between the coalition partners) and intragovernmental conflict score is considerably weaker, albeit still in the expected direction: 0.27. This relationship is, however, largely driven by single-party governments, where the ideological distance is zero by definition, as we saw on Figure 8.4, and which tend to be characterized by low intragovernmental conflicts. When focusing on coalitions only, the correlation coefficient is a mere 0.06, which provides very limited evidence for our expectation that ideological distance is a determinant for conflict. A more plausible interpretation of the data is that government fragmentation is a likely determinant of intragovernmental conflict even if coalition partners hail from similar or ideologically proximate party families. This is likely to be the result of the fact that conflict over immigration within the government is not necessarily a result of different ideological principles but rather follows from debates over electoral strategies, policy details, or blame avoidance strategies by the coalition partners.
A case in point is the Integration Law episode in Austria. This episode has the highest intragovernmental conflict score in the whole sample, and it occurred under a grand coalition government with a relatively large ideological distance (3.2) between the two constituent parties, the center left SPÖ and the center right ÖVP. In the conflict, however, few of the actions emanated from distinct ideological principles. The most contentious elements of the debate revolved around a ban on veiling in public places, language requirements, and a requirement for refugees to accept nonprofit jobs. Despite the sensitivity and ideological divisiveness of these issues, few of the conflictual actions revolved around basic ideological principles; rather, they focused on procedural matters and took the form of the parties mutually accusing each other of not sticking to their part of the coalition bargain. What this anecdotal evidence suggests is that even in cases with a relatively large ideological distance between coalition partners, the debate between them can be rather nonideological, so government fragmentation alone is a sufficient condition for intragovernmental conflicts.
Turning to the second conflict dimension that we examine in this chapter, we probe the relationship between the ideological make-up of governments and the extent and type of partisan (government–opposition) conflict (see Figure 8.5). As it turns out, the relationship between the average ideological position of the government on the GALTAN scale and the partisan conflict score of the episodes is positive but weak (0.2). On the one hand, with one exception, governments scoring high on the GALTAN scale (>8) are characterized by comparatively high levels of partisan conflict. On the other hand, all but two of the governments scoring low on this scale (<4) produced below-average partisan conflict scores. The two outliers among the governments with low scores – the Hollande government during the Rights of Foreigners Bill in France and the Swedish center left coalition led by Löfven in Sweden during the Residence Permits episode – were both characterized by a partisan context where the government was simultaneously attacked from both the left and the right. Though in both cases, the mainstream center right opposition led the offensive, the government was also criticized by the radical right and the radical left opposition. What explains the outlier status of these cases, therefore, is the multiple angles of partisan attack against the government rather than the government proactively seeking out conflict.
Government ideology and partisan conflicts

We expected that the center-right, when in government, may have a lot to gain from politicizing immigration, in contrast to the center-left. Though it is highly questionable to what extent Viktor Orbán’s Fidesz party can be considered a center-right party, the location of the two Hungarian partisan conflicts – the Quota referendum and the “Stop Soros” episode – in the upper right quadrant of Figure 8.5 suggests that these two episodes provide a useful testing ground for the validity of this mechanism. If our expectations are valid, the government (and government parties) should be in the driver’s seat as instigators of the conflict. This is definitely the case for the “Stop Soros” episode, where the government (and its parliamentary wing) was responsible for almost half (47 percent) of conflictual actions. If the government’s initiating role in the Quota Referendum episode was less pronounced, accounting for 36 percent of the partisan conflict, it is still situated well above the average government share for all partisan conflicts (roughly a quarter). Overall, however, as the proponents and the executors of the policy packages, governments are obviously much more likely to be targets rather than initiators of the conflict when forced to defend their policy proposals (see Chapter 6). Against this backdrop, the two Hungarian cases, particularly the “Stop Soros” episode, provide some suggestive evidence for the prospects of the center-right to electorally benefit from putting the immigration issue on the political agenda.
We also anticipated that government ideology determines the conflicts’ substantive content, as it is conveyed to the audiences via particular framing strategies that actors employ in the debates. In particular, we expected that center-left governments are more likely to engage in debates on humanitarian–solidarity–democratic grounds, whereas the center-right would prioritize debates revolving around themes related to security, sovereignty, and cultural (identitarian) concerns. However, the correlations between the share of such frame types and government ideology provide only weak support for this argument. For intra governmental conflicts, the relationship between government ideology and the share of humanitarian–solidaristic–democratic frames is indeed negative (correlation coefficient: –0.26), while the share of security–sovereignty–identitarian frames is positive (correlation coefficient: 0.17). For partisan conflicts, however, the resulting patterns go against expectations, with correlation coefficients for the types of frames amounting to, respectively, 0.17 and 0.06. This unexpected result can be explained by the fact that in the case of partisan conflicts, governments have only partial control over the substance of the debates. For instance, left-wing opposition parties may trigger conflicts on humanitarian grounds even if the center right government tries to ignore their actions. Conversely, center left governments may decide to ignore conflicts around security concerns, but that does not make the conflicts go away, as (center) right opposition parties can keep such security threats on the agenda against the wishes of the government.
To test this proposition, we now turn to the final empirical exercise, which relates the substantive content of the conflict to the sources of partisan conflict. To reiterate our expectations, we expected the share of humanitarian–solidaristic–democratic frames to be higher when the main opposition challenge comes from the left, and we expected the share of security–sovereignty–identitarian frames to be higher under challenges from the right. Starting with the share of the first type of frames, the patterns are closely in line with our expectations: The correlation coefficient between the share of such frames and the share of partisan conflict emanating from the center left and the center right are 0.63 and –0.40, respectively. For the conflict between radical challengers, the coefficient is –0.35 with radical right challengers and exactly zero (no correlation) with radical left challengers. The lack of correlation with the radical left is most probably related to the very low number of such actions in our sample. For frame shares of the security–sovereignty–identitarian type, the patterns largely mirror the previous findings, with one important difference. For such types of frames, it is the radical right that appears to be successful in putting such concerns on the agenda (the correlation coefficient between the share of these frames and the share of the conflict originating from the radical right is 0.52). The corresponding correlation coefficient for the mainstream left amounts to –0.38, for the mainstream right it is –0.04, and for the radical left it is –0.02 (again, no correlation). Therefore, while the center right has been a more vocal opponent of governments during the refugee crisis, the radical right opposition has been more successful in sticking to a consistent securitarian and sovereigntist narrative in the debate.
To sum up the findings on the relationship between the substantive content of the conflict and the source of partisan challenges, the most noteworthy patterns are the high share of humanitarian–solidaristic–democratic frames when the opposition comes from the center-left and the high share of security–sovereignty–identitarian frames when the challenge comes from the radical right. The role of the center-right is somewhat ambiguous: Though its presence, when in opposition, is associated with less conflict on humanitarian–solidaristic–democratic grounds, this does not translate into a higher share of security–sovereignty–identitarian concerns. More generally, we have seen that while the ideological composition of the government is consistent with the substantive content of the conflict in the intragovernmental domain, it is the ideological source of partisan opposition that has a stronger predictive power related to the content of the debate in the government–opposition (partisan) domain. Figure 8.6 shows the scatterplots with the highest correlation coefficients in such partisan conflicts.
Relationship between the content of the conflict and their partisan source

The Impact of Government Composition in Action: Two Case Studies
Sicurezza Bis in Italy (September 2018 to August 2019)
Based on the composition of the government that presided over the Sicurezza Bis episode in Italy toward the end of the refugee crisis, the episode was always going to be a perfect candidate for intragovernmental conflict. The coalition was composed of two main parties with vastly different ideological profiles on the GALTAN dimension: the Lega, an archetypical populist radical right party and M5S, a relatively new actor on the Italian party scene with a rather motley ideological profile but as far as the cultural dimension is concerned, arguably playing the role of the functional equivalent of a new left party in the Italian political system (Kriesi Reference Bojar, Gessler, Hutter and Kriesi2020). Government fragmentation was thus rather high both in numerical terms (0.54 on the Herfindahl index) and in terms of the ideological distance between the parties (5.47). Moreover, the M5S–Lega government was a case of nonaligned setting between the interior portfolio and the prime minister. Arguably, the interior minister and the leader of the Lega party, Matteo Salvini, even eclipsed the role of the nonpartisan premier Giuseppe Conte in this episode.
Unsurprisingly against this backdrop, the episode turned out to be one of the six intragovernmental conflicts and the only one that emerged outside Germany and Austria, the two countries with long-standing traditions of grand coalitions and the inevitable conflicts these entail. Most of the conflict played out within the government itself, as we have briefly mentioned before. Thirteen of the fifteen intragovernmental exchanges took place between government actors, while the remaining two occurred between government parties and the government. The relative peace between the coalition partners, however, is largely due to the fact that the Lega was largely a one-man show led by Salvini, who now acted in his new role as interior minister, rather than as the head of his party.
Salvini and Conte contributed to the conflict in roughly equal measure both as initiators and as targets. Predictably, they targeted each other most of the time. Though Salvini refrained from outright criticism of the premier and relied on softer forms of pressure via a radio interview, a letter directed at him, and statements made in a government meeting, his actions were largely aimed at speeding up the process of approving the law that sought to tighten the asylum system by accelerating deportations and facilitating the detainment of asylum seekers. In exchange, Conte expressed doubts on the constitutional legality of the decree and invoked the president of the republic, Sergio Mattarella, who shared these concerns.
In fact, Mattarella pushed his constitutional prerogatives to the limits by expressing concerns about the decree on various occasions. In early October, he invited Salvini for a meeting in the Quirinale – the Italian presidential palace – to express reservations about the law. Later, in a letter addressed to the government, he emphatically demanded that the constitutional rights of foreigners be respected. Much later, at the end of the episode, he made a last-minute attempt to curb the excesses of the law in yet another letter addressed to the leaders of both chambers, where he labeled the sanctions of those violating territorial waters “unreasonable,” a rather harsh expression from the president in an otherwise civilized debate.
Amidst the Salvini–Conte–Mattarella triangle, the role of Luigi di Maio and the senior coalition party, M5S, was somewhat ambiguous. Though he sought to assuage the concerns of Salvini by promising that he would impose order in the ranks of his party and get the votes to support the decree, at the same time, he did not shy away from distancing himself from the interior minister. In one statement, he accused the latter of trying to push the decree through without proper consultation with his party: “Salvini is trying to provoke us to cover up his failures, we will not fall into the game of responding to a decree that no one has ever discussed in advance.” In an inner-circle discussion, he went even further by accusing Salvini (and the Lega) of threatening the survival of the government and at the same time thought to assuage his party, saying that he would not give in to all of Salvini’s demands. Ultimately, however, this balancing act of di Maio turned out to be a failure because the substance of the decree ended up largely representing the Lega’s (and the populist radical right’s in general) vision of clamping down on asylum seekers in the context of the crisis.
In terms of the substance of the debate and the frames that the actors used, the main patterns also largely conform to our theoretical expectations. We argued that center right governments are more likely to engage in intragovernmental conflicts on security–sovereignty–identitarian grounds, whereas center left governments would prioritize humanitarian–solidaristic–democratic concerns as far as the intragovernmental conflict line is concerned. The ideological placement of the M5S–Lega coalition government is far from trivial because of the ideological ambiguity of M5S. The Chapel Hill expert survey scores place the Lega firmly on the right of the GALTAN spectrum, whereas M5S is coded as center left, giving rise to a weighted average ideological score of 5.67 (i.e., slightly right of center) for the government. Considering that both the nonpartisan premier Giuseppe Conte and the head of state Sergio Mattarella, who played a prominent role in the episode, had entered politics from a legal background, the overall weight of the government is expected to tilt further to the center. Accordingly, the frame mix in the debate was rather balanced. In the overall debate, roughly a quarter of the frames are of the security–sovereignty–identitarian mix, and slightly less than half are humanitarian–democratic (no solidaristic frame was used in this episode).
When zooming in on the part of the debate that unfolded along the intragovernmental conflict line, the balance is roughly the same: Two actions were accompanied by a security–sovereignty frame and three by humanitarian and democratic ones. Starting with the security–sovereignty types, both of these actions were undertaken, unsurprisingly, by Salvini. In May 2019, he defended the proposed measures to his followers on the grounds that they would protect Italy against “smugglers, criminals, and convicts,” rhetorically musing about how the coalition partner M5S could possibly be against the proposal. In the same month, in a letter addressed to Premier Conte, he sought to dismiss concerns voiced by six UN rapporteurs, calling these interventions “undue invasions” in a domestic political matter. On the other end of the frame mix, Sergio Mattarella played the leading role yet again. On various occasions, he invoked the constitutional rights of foreigners, and in the letter sent to the heads of the legislative chambers toward the end of the episode, he stressed that “there is always a responsibility to rescue at sea.”
Quota Referendum in Hungary (November 2015 to December 2016)
If the Sicurezza Bis episode in Italy created fertile grounds for intragovernmental conflicts to emerge, the one-year-long Quota Referendum episode in Hungary was an equally likely candidate for partisan conflict. While the party discipline that Viktor Orbán, the Hungarian premier, imposed on his single-party government all but precluded any sort of dissent from the government’s ranks, the ultraright policy platform of Fidesz (GALTAN score: 8.6) foreshadowed that not only would the government be exposed to frequent attacks from the opposition but that it would also readily engage with such attacks or provoke the conflict itself. In fact, as we previously showed, in the two Hungarian partisan conflicts – the Quota Referendum and “Stop Soros” – the government and its parliamentary wing initiated a comparatively large share of the partisan conflict. Moreover, given the rather heterogenous partisan opposition standing against Fidesz, the government’s plans to block the EU’s relocation scheme via a referendum was likely to be criticized from multiple directions and substantive angles. Accordingly, the episode came to be dominated by the partisan conflict line (with a partisan conflict score of 0.40). No less than 123 actions involved the government and the opposition, an outstanding number among our episodes both in relative (as a share of total actions) and in absolute terms.
Most of the government’s attacks were targeted at the long-standing leader of the mainstream left, the postcommunist MSZP (Magyar Szocialista Párt) party. However, by the time the referendum initiative was launched, the radical right challenger party, Jobbik – which, incidentally, initiated the constitutional change to block the relocation of asylum seekers to Hungary in the first place – had overtaken MSZP as the leading opposition force and was steadily climbing in the polls. As Jobbik’s challenge was widely perceived as more threatening to the government than the left-wing opposition, Fidesz could not ignore it and often targeted Jobbik in the debate. From the opposition’s side, the most active initiator of the conflict was yet again MSZP, followed by ex-premier Ferenc Gyurcsany’s Democratic Coalition. Jobbik was comparatively silent as an initiator, not least because the referendum initiative was close to its original plans and its general policy agenda. Nevertheless, Jobbik also targeted the government on eight different occasions. Finally, LMP – a nominally green left outfit but in political terms a centrist party playing a “bridging” role between the two blocs – also participated in the debate, though it was largely spared from the kind of government offensive that other opposition parties had to face.
Apart from its intensity, one of the most unique features of the partisan debate is the multiple arenas in which it unfolded. The media accounted for only around a third of the action, a limited share when compared to other episodes. This is largely due to the fact that in the summer as the date of the referendum (October 2016) neared, the debate gradually shifted to public campaigning, including various poster campaigns and other official campaign events. A number of opposition protest events also took place – including conventional demonstrations as well as a “human chain” around the parliament organized by the Democratic Coalition, most of them immediately before the referendum vote. Finally, the referendum also loomed large in the parliamentary arena, both in the preparatory phase in the spring and in the referendum phase in the autumn, when Fidesz first tried to mobilize the vote to reach the quorum and then to impose a constitutional amendment despite the unsuccessful referendum outcome for its position. Meanwhile, the opposition’s main strategy in the parliamentary debate was to take an ambiguous stance on the Relocation Scheme as such, while arguing that the referendum was a futile tool to fight it. However, there were discernible differences in the strategies between the mainstream opposition and Jobbik. The former sought to highlight the government’s incompetence and hidden agendas while refusing to take a firm stance on the fate of refugees, whereas Jobbik was careful to emphasize its substantive policy agreement with the government even as it criticized the latter on procedural grounds.
Similar to the Sicurezza Bis episode in Italy, the prevalent frames in the policy debate were rather mixed. Conspicuously, solidarity frames, yet again, were entirely absent from the debate, which is somewhat paradoxical given that the debate was ultimately about interstate solidarity. Instead, while the government successfully promoted its own narrative on security and identitarian grounds – with sovereignty frames taking a secondary role, the frame mix by the opposition mostly centered around democratic/legal norms – humanitarian considerations were invoked only once, in a mocking response to the government’s poster campaign. Instead, the most common frame type employed by the opposition was one of efficiency/pragmatism. This conforms to its overall strategy that we highlighted before: Instead of attacking the government on principled grounds, the opposition mostly aimed to highlight the futility of the referendum push. The relatively low share of security–sovereignty–identitarian frame types thus partly goes against our expectation that such frames should prevail if the mainstream left is the main source of conflict. Even if somewhat unexpected, this outcome can be accounted for by the government’s successful dominant initiating role in the conflict and the support it obtained from Jobbik, ever so careful to emphasize its toughness on immigration.
Conclusion
This chapter has highlighted the importance of government composition in explaining the nature of domestic conflict in the refugee crisis. We have put into evidence two important aspects of this composition: fragmentation and ideology. Our focus on government fragmentation was informed by the notion that most of the governments in our study are coalition governments and therefore should not be treated as unitary actors. The type of governments in charge during the crisis ranges from monolithic single-party governments – such as the Fidesz government in Hungary and the Mitsotakis government in Greece – to fractious grand coalitions. Some of these coalitions are further fragmented on ideological grounds, as we have witnessed in the case of the M5S–Lega coalition in Italy.
Our empirical exercises relying only on bivariate correlations due to the limited sample size in our study revealed some interesting patterns regarding the relationship between government fragmentation and the intensity of the intragovernmental conflict line. Numerical fragmentation showed a fairly close link to the prevalence of this conflict, while the link with ideological distance between the parties appeared to matter less. Ideology turned out to be of mixed relevance for the intensity of the partisan conflict. We confirmed that center-right governments are more likely to engage in debates centered on immigration with the opposition. Moreover, the role of government ideology also matters for the content of the debate along both the intragovernmental and the partisan conflict lines. However, the general relationship between ideology and partisan conflict is weak.
In substantive terms, we expected (and empirically confirmed) that center-right governments are more likely to engage with immigration-related debates among themselves compared to center left governments, whose electoral incentives push them to hide their differences and emphasize other issues instead. However, when the conflict unfolds between the government and the opposition, we have seen that the source of the partisan challenge matters more than the ideological make-up of the government: When the challenge comes from the radical right – and to a lesser extent, from the center right – security–sovereignty–identitarian frame types are more likely to be prevalent compared to challenges from the mainstream left, where humanitarian–solidaristic–democratic themes are likely to take center stage. In practice, however, as we have seen both in the case of the Sicurezza Bis episode in Italy and in the case of the Hungarian Quota Referendum, the frames that dominate the debates tend to be highly mixed and variegated, and they are likely to depend on a host of other factors beyond ideology and the general scope of this chapter.
Introduction
The most salient event early in the refugee crisis was perhaps the drowning of a young Syrian Kurdish boy at the coast of Turkey, three-year-old Alan Kurdi. It received wide media coverage for multiple days, placing the humanitarian aspect of the refugee crisis under the spotlight. Worries about the sustainability of the refugee flow subsided for a while, given the shock caused by the viral circulation of photos portraying this meaningless loss of life of one so young. It is hard to alter the perception that the refugee crisis is a humanitarian crisis at its core. It is driven by one of the most historically common human impulses, the urge to migrate in order to escape danger or depravity – and it can be stopped only by paying a steep price in terms of human life, as is evident on the seafloor of the Mediterranean. We instinctively classify the influx of 2015–16 as a refugee crisis due to all its political consequences, but in reality, the number of refugees was low compared to other major migratory incidents, like those after World War II. A question that has remained somewhat in the background up to now, therefore, is why was this even a crisis? Why was there such a zeal to implement ever-stricter border controls and asylum regulations when most of the people were indeed coming from a torn and depraved place?
One partial answer to this is that this is a result of politicians following public opinion, which is generally hostile to immigration across the EU. But this only begs the question of where this hostility comes from and who capitalizes on it. Arguably, anxieties about cultural mismatches and resource depletion do exist among the public, irrespective of what politicians say. However, this chapter claims that partially, the hostility is still greatly amplified by concerted efforts by political actors, focusing here specifically on the right wing of the political spectrum to present or frame the refugee crisis – and migration in general – as something different and bigger than a simple humanitarian issue. Mainly, this works by tapping into a primordial fear of outsiders and foreigners, but it must also address and annul the humanitarian aspect of the refugee crisis in order to allow the audience to overcome – or at least sidestep – the repulsion caused by images such as the lifeless body of an infant laying on the Turkish shore.
This chapter, then, slightly deviates from policy and issue-based politics and looks at arguments and frames surrounding the refugee crisis by right-wing actors. Regarding the defenders of the refugees and immigrants, the line of reasoning is relatively straightforward, attuned to what has been already mentioned. People are drowning in the sea as they seek a brighter future, and our advanced economies and societies can and should afford them an opportunity to pursue that. For the pro-migration side, first and foremost comes our humanitarian and moral duty to other persons, then our legal duty as inscribed in the Geneva treaties and UN participation. For the defenders of anti-immigration policies though, the ideational battle cannot be positive or straightforward to that extent. To defend their anti-immigration position, they can resort to identitarian ideals, stressing the cultural – among others – differences of newcomers; however, those must be weighed against humanitarian concerns. It is difficult to argue in favor of an abstract community cohesion when viral images of dead bodies washing ashore are everywhere in the media. To come to terms with this challenge, anti-immigration actors, predominantly on the right, are complementing their rhetoric with frames that correspond to Hirschman’s (Reference Hix and Hoyland1991) rhetoric of reaction: that the aid provided to refugees is bringing about perverse results, resulting in more human tragedy than they avert and concurrently placing our societies in grave jeopardy due to the social changes brought about by the refugee inflow.
As noted, we focus specifically on the themes and frames utilized by right and radical right actors to portray the refugee crisis because, as we shall see in Chapter 14, they were the main mobilizers and beneficiaries of the refugee crisis. We account for the most common frames utilized by these actors and make only passing reference to those invoked by others, such as civil society and other parties, which are generally more predictable. For this purpose, we briefly present the frames we coded in our PPA analysis but also perform and mostly rely on a separate speech analysis, described in Chapter 3, that attempts to record – more precisely and extensively – the frames used by right-wing actors specifically.
The chapter is structured as follows. First, we briefly review the literature on framing and situate our concepts and methods within this literature. Afterward, we look at the distribution of actors and frames/themes, aiming to see who uses which frames and themes. Moving forward, we rely primarily on speech analysis (see Chapter 3), which focuses on several key right and radical right actors who were the protagonists of our refugee crisis episodes. Finally, we discuss the commonalities and differences with respect to the themes among different right-wing parties and conclude the chapter by pondering what type of convergences and divergences in the right’s rhetoric we witnessed during the refugee crisis.
Theoretical Framework
Frames have become a staple of political and communication sciences. They are analyzed because of their potential to persuade recipients of a frame to “see” a situation in a specific way (Gamson and Modigliani Reference Gamson and Modigliani1987; Nelson Reference Nestoras2011). In this study, the frames we are interested in are “whole-story” frames (Gray Reference Graziano and Vink2003) that characterize an entire situation, in this case the refugee crisis, in different ways and aim to steer the audience toward a specific way of making sense of the crisis (Brewer and Gross Reference Brewer and Gross2005). While originally, after the first migrant deaths, the refugee crisis had a distinct humanitarian hue, it was gradually embedded in different frames, mainly, but not exclusively, by right-wing actors who attempted to present the whole situation as something entirely different, guiding the audience to see it through the lens of threat and lurking danger.
Most of the work done on the framing of the refugee crisis has focused on an analysis of media or social media content (Georgiou and Zaborowski Reference Giddens2017; Greussing and Boomgaarden Reference Grossmann, Mahmood and Isaac2017; Pérez Reference Perotti and Kontopoulos2017), mainly zooming in on whether the media presented the refugee crisis as a “security” or an “economic” issue (Kovář Reference Krasner2020). We consider this to be our starting point, but because our analysis focuses on political actors and analyzes their speeches directly, we expand on the list of possible ways of framing the situation, as politicians tend to utilize a wider variety of frames to characterize the refugee crisis. Some of them often treat it in a completely dispassionate way, relegating it to a mere technical issue of hotspot functionality, while other utilize more apocalyptic overtones, presenting it as a lethal threat to the existence and continuity of European civilization. In the next section, we present our list of frames in more detail.
Apart from “whole-story” frames, which aim to characterize the crisis in its entirety, we also engage in thematic analysis (Braun and Clarke Reference Braun and Clarke2006; Lorimer Reference Lutz, Kaufmann and Stünzi2021). In a more detailed way, we engage with the speeches of right-wing politicians and attempt to code constant tropes, arguments, and themes that they utilized in their speeches to characterize more specific aspects of the refugee crisis and to justify their use of the overarching frames. For example, talking about refugees as potential criminals or terrorists is often used to justify the framing of the refugee crisis as a security issue or even, depending on the context, as a geopolitical threat, as was the case when the Greek prime minister claimed that the influx of migrants from Turkey was an attempt to destabilize the country.
We thus approach the issue methodologically from these two sides, in order to address two main questions. First, we ask whether the right used a common template, or simply a common discursive agenda, to frame and talk about the refugee crisis, and if so, what the common discursive elements were. The refugee crisis presented both a threat and an opportunity for the right-wing party families. It was an opportunity because public opinion seemed massively hostile to the influx of immigrants and thus, the adoption of a stricter anti-immigration rhetoric could have gathered votes. It was also a threat, however, because there were impediments to such an outcome. First, many of the parties on the right were in government at the time and therefore had to balance their anti-immigration stances with government responsibilities. As the signatories of international treaties on asylum seeking and participants in the European Union that imposes certain minimal standards in the reception of asylum seekers, right-wing parties in government were often constrained with regard to what they could credibly promise in terms of antimigration policies. Concurrently, many of them faced competition on the issue from radical right antagonists, who could seize the opportunity to bolster their anti-immigration rhetoric and consequently their vote share at the expense of their mainstream rivals. Additionally, many of the radical right parties are associated in the minds of the voters with antimigration stances (see Chapter 14), own the issue, and are in a much better position to benefit from it.
Therefore, right-wing parties were faced with a dilemma concerning the rhetoric they adopted on the issue. Would an antimigration stance help them in political competition, aligning themselves with the public’s preferences, or would it drive more voters into the hands of the radical right? And if they adopted such a stance, should they use arguments similar to those of the radical right, or should they try to differentiate their discourse to appear more like responsible and credible governing parties? Overall, we want to study whether a common discursive strategy about immigration issues emerged among the center and radical right or whether, instead, there were multiple strategies depending on the position of a party in government or on other factors.
Furthermore, a second motivation of this study is to focus on the radical right instead to examine whether there was indeed a sort of transnational radical right discourse, as argued by Lorimer (Reference Lutz, Kaufmann and Stünzi2021) and McDonnell and Werner (Reference McKay2020), favoring tighter European integration on a civilizational basis and advocating a “fortress Europe.” These scholars have argued that radical parties in recent years have abandoned their dominant nationalistic-sovereigntist discourse (Hooghe, Marks, and Wilson Reference Hosli and Arnold2002; Kitschelt and McGann Reference Kitschelt1997; Kriesi Reference Kriesi, Altiparmakis, Bojar and Oana2016) in favor of one that is more ambivalent about Europe. Whereas before they would seek the dissolution of the European Union, they were now more tempted to maintain the edifice but remold it in the image of their own ideals. PiS, Fratelli d’Italia, and Fidesz, for example, have often lamented the cowardice of the European Union in proudly and unabashedly protecting what they regard as “European civilization,” which is purportedly under threat from the hordes of migrants and the dilution of European moral values and traditions. Ideally, these parties would seek the transformation of the European migration policy away from ideas of fair redistribution of refugees toward a system focused on providing impenetrable border protection and slim chances of any migrant receiving asylum. It is therefore an open question as to how some of these parties have argued in the refugee crisis: Have they assumed a discourse that stresses the policy failures of the EU as is, or have they insisted on charting a different, sovereigntist course altogether? We shall try to probe this question, too.
Presentation of Frames and Themes
As noted, we separate our analysis into frames and themes. Whereas our frames are overarching characterizations of the refugee crisis, inducing people to understand it as a specific kind of issue or crisis, themes are specific arguments that attempt to draw the audience’s attention to a narrow aspect of the crisis and persuade it to either prioritize certain of its elements or associate it primarily with this narrower aspect.
In other words, our frames are generally more abstract, attempting to classify the refugee crisis as a specific type of crisis. We deploy eleven different frames, contrary to other relevant studies that focus mostly on security or economic frames (Kovář Reference Krasner2020), as we find that for the array of policy actors that we cover, a wider variety of frames is used. The eleven frames are presented in Table 9.1 and range from frames typically invoked to argue against immigration to frames more closely associated with humanitarian organizations. In between, we find some frames that are used equally for framing the refugees in a negative or positive light, and frames that attempt to evade the issue and present it as a more neutral, “technical” one.
The first frames in Table 9.1, which as we shall see are the most common among right-wing parties, are typically used to frame the refugee crisis as a negative phenomenon that one must defend themselves against. Security frames commonly invoke the dangers of terrorism or crime from incoming refugees, while identity frames claim that the identity of refugees is incompatible with European identities. Sovereignty arguments are more ambiguous, as they can have multiple uses. While they are sometimes used for expressing opposition against efforts to create a common European approach to deal with the refugee crisis, as is very often the case with Fidesz, they are also used to justify claims that the country’s closing of borders is its sovereign right, as was mostly the case with the Greek New Democracy.
Moving down the list in Table 9.1, we encounter frames that tend to be neutral toward immigration and sidestep arguments on principles, preoccupying themselves only with the technical aspects of the refugee crisis. Arguments about the efficiency of policies dealing with the refugee crisis are some such frames, often arguing for the return of policies like Hotspots and Port Closures. Additionally, cost–benefit frames also approach the crisis from a “utilitarian,” dispassionate standpoint, while legalistic frames tend to narrow it down to a strict examination of the legal standing and rights of immigrants, the legality of their entry into a country, or the legal obligations of the country vis-à-vis the international community.
Much like legalistic frames, democratic arguments can cut both ways on the pro-/anti-immigration spectrum. They may be used either to argue that minority and refugee rights are a cornerstone of democracy or to make claims that elites are thwarting the democratic will of the people who are generally hostile toward migration. Similarly, sustainability frames are made either to argue in favor of immigration due to the spillover economic and manpower benefits it provides to an aging Western population or to articulate opposition to immigration, as when stressing the unsustainable implications of large immigration waves for the welfare systems and societies of Europe. Geopolitical frames are generally rarer and attempt to situate the refugee crisis within a wider context of geopolitical turbulence, subsuming it under the wider turmoil in the Middle East and Africa, or as in the Greek case, specifically, embedding it into the wider antagonism in the Aegean Sea.Footnote 1
Finally, at the bottom of Table 9.1, there are two frames that are typically used in pro-immigration discourse – humanitarian and solidaristic frames. Solidaristic frames are generally coded when actors, at least implicitly, accept the inevitability of immigration and call for other actors to share the burden caused by it and/or show some solidarity with the refugees. While such frames are generally rather rare in our speech analysis database, they are often invoked in the first version by right-wing politicians in frontline states. Humanitarian frames are eventually self-explanatory, stressing the humanitarian aspect of the refugee crisis and focusing on the problems of the immigrants themselves, but they are seldom used by the actors that are prevalent in our speech analysis and are usually invoked by NGOs and other civil society organizations.
Moving on to the themes – the coding here has been more inductive. While first coming up with a list of often-repeated tropes and arguments, we condensed this list of sixty or more arguments, which try to prioritize a specific aspect of the refugee crisis, into eight overarching categories, which are shown in Table 9.2.
Some of the themes have a very direct correspondence with the frames we analyzed above. Thus, we typically assign a democracy frame when also assigning a populism/democracy theme. The same applies to themes regarding policy efficiency/policy failure. When politicians, for instance, claim that the wave of immigration is imposed by unelected European elites upon an unwilling European public, they try to situate the refugee crisis within a wider frame of democracy. However, some of the arguments made in favor and – mostly – against immigration do not neatly correspond to an overarching frame but either can be subsumed under several of the frames we previously listed or may even not correspond to any of them. When we present the themes in more detail below, we also provide their correspondence with our existing frames.
Overall, our list of themes contains what we considered to be the broadest categories of arguments/tropes associated with the refugee crisis. Border protection themes are usually attributed to sentences where politicians ask for practical measures to bolster border security or make asylum procedures tougher. Economic pressure refers to a host of themes referring to the economic harm caused by migrants, either due to benefit recipience or because of increasing job competition. We have already referred to the populism theme, whereas the European theme mostly comprises discourses within which a politician attempts to blame Europe or the failure of European cooperation for the refugee crisis. Policy failure and efficiency themes refer to more “technical” expressions, such as the need to accelerate the building of hotspots or more abstract calls for better policy.
The three themes that are at the bottom of our list correspond mostly to types of arguments first identified by Hirschman (Reference Hix and Hoyland1991). The first – and most common – type of argument is that of perversity or counterintuitiveness. Generally, it points to efforts to help refugees that produce a result opposite that of their stated goal, or it stresses the hypocrisy of those wanting to help refugees. Some of the arguments included in this category, for example, claim that drownings are actually caused by rescue missions like Mare Nostrum that act as a “pull factor.” Some other arguments of this type claim that progressives hypocritically defend migrants who are much more conservative than the conservatives they oppose at home or that the wrong type of migrants are helped, that the hypocritical policy caters to those who can make the journey while ignoring the most vulnerable people stuck in the conflict zones where refugees originate from. Jeopardy, by contrast, is more straightforward; it involves arguments that refugees pose an active threat to the local populace as potential terrorists, criminals, or – more recently – as carriers of diseases and Covid-19.
Finally, the more far-fetched arguments that border on conspiracy theories or explicitly target Muslim migrants and bemoan “multiculturalism” are included in the last theme category. As we shall see, the “invasion” theme, by far the most common in this category, arguing that the local population will eventually be displaced by the incoming migrants, is almost exclusively invoked by radical right parties and Fidesz.
Frames in PPA and Speech Analysis
In Table 9.3, we present the distribution of frames in our speech analysis and PPA, according to the categories used in each type of analysis. As noted, PPA is missing three of the categories we used in the speech analysis. One could argue that the legalistic and cost–benefit categories are incorporated in the efficiency frame, which would leave the sustainability frame as the one lacking a true counterpart in our PPA analysis.
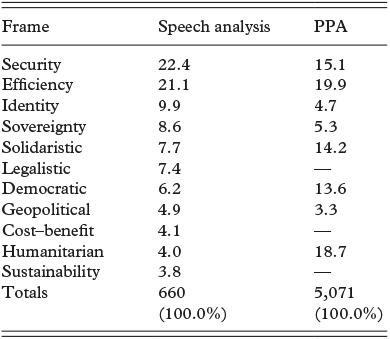
The results indicate the major divergences and similarities between media discourse of political actors more generally and the discourse of the right-wing side of the spectrum in particular. The speech analysis, as expected, displays a higher frequency of security and identitarian frames than the general PPA analysis and somewhat higher counts of sovereignty claims, whereas humanitarian frames are much less numerous. This is unsurprising, as right and radical right parties tend to prioritize security and identitarian frames and arguments rather than humanitarian frames, which are mainly deployed by NGOs and civil society. Unexpectedly, however, democratic frames, typically deployed to argue that immigrants are not wanted by a majority of the population or that elites impose immigration on a hostile electorate, are actually more rarely used by right-wing actors than by all the actors taken together in the PPA analysis. Other than that, the distribution over the rest of the frames appears relatively similar across the two datasets and, in an analysis not shown here, is very similar in terms of distribution, when the PPA database is reduced to the same type of actors.
We now focus on the data for the right-wing actors and break down the frames and themes by the types of actors. We start with the frames and compare mainstream right parties to the radical right. The UK conservatives, ÖVP, New Democracy and more arguably, Fidesz are classified as mainstream right parties, whereas UKIP, AfD, FPÖ, Elliniki Lysi, Lega, and Fratelli d’Italia are classified as radical right parties. In general, with the exception of the Lega, the party-family distinction also correlates with participation in government. There is only one exception where center right parties studied here have not been in government – namely, New Democracy’s early speeches. In other words, for the most part, the differences between party families are also differences between governmental and nongovernmental parties. In any case, in Figure 9.1, we see the difference in the usage of frames between mainstream right and radical right parties.Footnote 2
Differences in percentage use of frames between mainstream right and radical right actors
Note: The further right a dot is found, the more common is the usage of a frame by mainstream right parties compared to radical right ones and vice versa.

Figure 9.1 shows a relative convergence in the types of frames used by the two party families, with two major exceptions. On the one hand, solidaristic framing is more typically deployed by mainstream right actors. As we shall see shortly, this is entirely due to a single party, as it is predominantly New Democracy that utilizes this frame (51 percent of the sentences of this frame are attributed to the Greek mainstream right; the Lega uses it, too, but to a lesser extent – hence the party family difference). The same is true regarding sustainability, a frame almost solely utilized by New Democracy to stress the unsustainability of Greece receiving so many refugees. Sovereignty is also more often deployed by mainstream right actors, a product of mainly three parties, namely the UK conservatives and Fidesz in Hungary, another expected result given their centrifugal or anti-European tendencies. The other mainstream party utilizing it on the fringes is New Democracy, but rather in sentences meant to stress that protecting the Greek borders is an act of sovereignty, rather than as juxtaposed to supranational authority. What is surprising, however, is the degree to which radical right parties shy away from the frame. The AfD accounts for almost all sovereignty-focused frames among this party family. The Mediterranean radical right (ELLY, Lega, and FdI) almost never uses it, while it comprises only 6 percent of the frames utilized by the FPÖ.
On the other side of Figure 9.1, we can see that efficiency, identitarian, and especially security frames are much more common among the parties of the radical right. Identitarian frames are mostly avoided by all mainstream right parties, except for the family’s arguably most fringe component – Fidesz. Instead, they form the backbone of the Greek radical right’s repertoire, with its leader continuously stressing the incompatibility between Greek-European culture and the culture of Muslim immigrants. The FdI and – to a degree – UKIP and the Lega also utilize this frame, albeit much less frequently.
The security frame is the most common one and, concurrently, the one dominated by radical right actors. The champion is FPÖ, which comprises 30 percent of all security frames, copiously trying to present the refugee crisis as a security crisis. The Lega, Fidesz, and Elliniki Lisi all contribute almost equally to this framing, another sign that Fidesz is closer, in terms of rhetoric, to the radical right than to the mainstream right families. Nevertheless, unlike identitarian frames, mainstream right parties do deploy security frames, just not at the same frequency as the radical right.
Figure 9.2 presents the types of frames per country. This figure corroborates what has already been discussed, namely, that solidaristic frames are mostly used in the European south, dominating the discussion in Greece and partially in Italy, whereas they are nonexistent everywhere else. Also, despite the proliferation of security frames in both countries, they are the only countries (perhaps due to their frontline status making them confront the issue more directly) in which humanitarian frames appear at all, even by right-wing actors, compared to all the rest of the countries, except for the UK.
Frame type shares by country: percentages

As we shall also see in Chapter 14, security frames in Austria dominated the political scene, with the mainstream and radical right competing to present immigrants as a menace. It is most peculiar that in Austria, the whole discussion is framed in terms of security, with identitarian frames barely making an appearance, compared to a much more “cultural” approach in Greece and Hungary and, to a lesser extent, the rest of the countries, where identitarian frames are more common. Finally, as we discussed previously, it is apparent here as well that sovereignty frames are much more common in Germany, Hungary, and the UK, something that was to be expected, given the much more Eurosceptic profile of the parties involved.
Themes in Speech Analysis
Moving on to the second aspect of our coding, we trace the themes utilized in and by those different types of party families and countries. We start by showing the distribution of themes in Table 9.4. As can be seen, the most common themes are those that have to do with calls for European cooperation, or the ones decrying European failure. Perversity themes, involving claims that the handling of the refugee crisis is either hypocritical in some way or leads to perverse results, constitute the second most common category, followed by border protection, which includes abstract claims to ramp up border protection and more “technical” discussions on related issues. Following those are more abstract arguments on the efficiency of policies and more security-related themes dealing with jeopardy and conspiracy theories. Perhaps somewhat surprisingly, there is relatively little economic or populist/democratic argumentation, with our sample of parties rarely stressing such themes, compared to the more acute security threats caused by the refugee crisis.
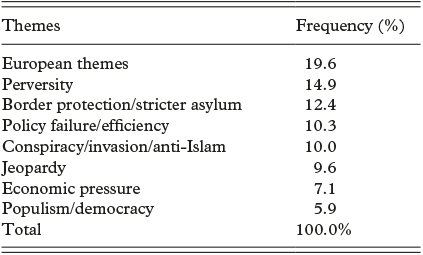
Repeating the exercise performed for frames, Figure 9.3 shows the difference of theme usage between party families. The only rhetorical devices that are more commonly used by mainstream rather than radical right parties are European-centered themes, which argue that the refugee crisis is either a product of European coordination failure or, contrarily, needs to be addressed via more European coordination. Almost all the rest of the themes, surprisingly, are hovering close to zero, even the conspiracy themes, as both radical and mainstream right parties seem to deploy them equally. On the other side of the spectrum, one finds only policy-efficiency themes – that is, claims that the policy is inefficient, too slow to be implemented, or not working – which are used more frequently by the radical right, possibly due to those parties being in opposition. The same partially applies to populist themes, which are also slightly more frequently used by radical right parties, as they are easier to use when in opposition, a position from which arguments about policy elites ignoring the people sound more plausible.
Differences in percentage usage of themes between mainstream right and radical right actors

In Figure 9.4, we present themes per country. First, it shows that concerns about policy efficiency dominate in Austria and Germany, whereas these themes are mostly absent in the other countries, with the exception of Greece. On the other hand, economic pressure themes are much more frequent in the southern European countries, which had an ailing economy, and the UK, where the Brexit discussion focused heavily on the burden of immigration.
Theme type shares by country: percentages

Even though solidaristic frames were mostly present in Greece, as we previously saw, the rhetoric centered on Europe was not the most dominant among the Greek right. Instead, Hungary and Italy show a much higher prevalence of European themes. This is not only because themes related to Europe do not only concern calls to present the issue as a problem requiring more European cooperation but because they also try to blame the refugee crisis on Europe’s decadence; weakness; and the “buonisti,” as Salvini used to call all those do-gooders in Europe who wanted to help refugees. The most common theme in this category by far is what we label as “impotent/weak Europe,” which refers to politicians – almost exclusively from the UK, Hungary, Italy, and Austria – who decry Europe’s catering to the so-called illegal migrants. In other cases, much less common and exclusively found in Greece, the refugee crisis was framed as a problem caused by the Visegrad countries, particularly Hungary, which blocked common European solutions for partisan and domestic reasons.
Perversity is another rhetorical trope that is particularly widespread in Italy, where Salvini repeated, ad nauseum, that efforts to help migrants were mismanaged, as they caused more drownings, and that the left was hypocritically helping conservative migrants who threatened European progressive values. Salvini also constantly suggested that the refugee crisis was in fact a fabricated crisis, cynically exploited by a cottage industry of NGOs, civil servants, and politicians – primarily from the left. A subtheme within this general category that is not, however, exclusive to the Lega but is actually widespread among all right-wing parties is that migrants are not actual refugees and that framing the crisis as a “refugee crisis” rather than an illegal immigration crisis motivated by economic reasons was fundamentally misguiding and led to perverse conclusions, as economic migrants placed a burden on society and made almost everyone worse off. This rhetoric was very common in Italy, Greece, the UK, Austria, and Hungary. Among our country sample, it is only really absent in Germany, where the focus was much more on the policy of the chancellor rather than on the refugees themselves. Indeed, Germany is where the populist theme is more prevalent, along with the UK, with the AfD scorching Merkel again and again regarding a policy that they considered to be unpopular and imposed from above on German citizens, who disagreed with it.
What is also striking is the presence of the jeopardy theme in all countries, including the rhetoric according to which migrants represented a terrorist or criminal threat and a danger to public health. While this is not the most dominant theme, it is common in all countries and used almost equally everywhere and by all parties. It is perhaps the common thread that links together the parties of both families and all countries, presenting the refugees and migrants as a potential threat.
Finally, we should note that the more conspiratorial discourses, which discuss the refugee crisis in terms of the loss of Christian Europe or of population and cultural displacement, are also common throughout Europe. As we saw, they are not necessarily the product of radical right parties, as these themes are sometimes invoked by the ÖVP, New Democracy, and the Conservatives – albeit in less apocalyptic forms – and are actually quite dominant in Fidesz’ s discourse, too, coming only second to themes about Europe’s impotence.
The Refugee Crisis as Seen by the Right: Convergences and Divergences
So far, we have described the frames and rhetorical themes used by parties of the mainstream and radical right, but now we want to delve a bit deeper into the questions that fueled this descriptive exercise. Specifically, we wish to examine whether there was a common discursive agenda between the two party families – and all parties in general – and whether there has been some movement toward a unified vision of Europe and a transnational rhetoric, as some other scholars have argued (Lorimer Reference Lutz, Kaufmann and Stünzi2021; McDonnell and Werner Reference McKay2020).
For this purpose, we resort to the use of multidimensional scaling (MDS) to portray the proximity and distances of parties and frames/themes. We base our MDS figures on the distributions of frames and themes for each party and try to see how close the parties’ distributions are to each other. Whereas MDS attempts to create a rough image of the relative distance of the objects it incorporates, it should be noted that the image produced cannot compress all the available information into the two-dimensional space of a typical figure; hence, some of the distances may not be represented precisely. Given that the process has to place the nodes based on a large number of distance pairs in a two-dimensional space, it cannot accurately reflect all distances, and we “correct” for this by returning directly to the distributions of frames for each party in Table 9.5. Nevertheless, it produces a rough, but helpful, summary image of the relationships present between parties and frames, both to each other and between themselves. Figure 9.5 presents the MDS graph for the parties, showing the proximity of their frame distributions.
MDS configuration of parties’ relative proximity based on their use of frames

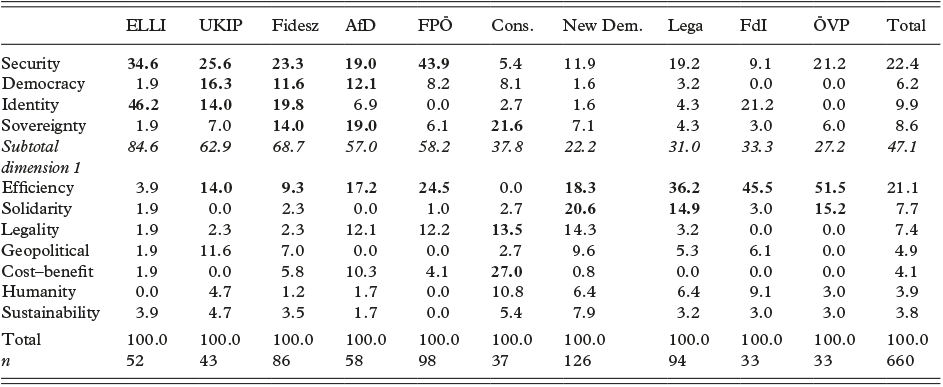
Figure 9.5 essentially reveals two clusters of parties. One is the “southern” cluster, containing the Greek and Italian parties, as well as the Austrian center right. The other one includes the radical right parties of northwestern Europe with the addition of Fidesz, which appears closer to them than to its own family. There is a particularly tight proximity between UKIP, Fidesz, and the AfD, while the extremity of ELLI places it further away but still closer to the radical right than to the “southern” cluster. The FPÖ is situated between the two clusters, but equally distant from the center of both. Finally, the UK Conservatives are in a league of their own, distant to all other parties studied here, as Brexit generated a quite different context that gave rise different frames than those used by the other parties.
We can take a closer look at the reasons for this configuration by complementing the MDS with the figures for the distribution of frames for each party. Table 9.5 shows the distribution of frames and number of frames for each party. It demonstrates the centrality of security frames as a common element in right-wing discourse and the fragmentary nature of the other frames, which are shared only by certain parties at a time.
Overall, if there is a common thread running across all parties, a core of right-wing rhetoric, it is the common usage of the security frame among all parties in our study, albeit to different degrees. Only the Conservatives, the party that we showed as more distant from the rest, minimized the use of this frame. Otherwise, we clearly see the patterns that led to the clustering in the table; the parties of the radical right, plus Fidesz, tend to deploy the security frame in conjunction with some, but not all, of the other radical right frames, namely populism, identity, and sovereignty frames. Which of these other frames are stressed by the radical right parties depends on the local context, but it is clear that they use a combination of them more than the center right parties do, as is evidenced in the subtotals for this first dimension in Table 9.5.
Fidesz uses all four elements almost equally, but the other radical right parties tend to stress some of them disproportionately. UKIP places emphasis on populist and identity frames, whereas the AfD replaces identity with sovereignty frames, juxtaposing itself to the Europe-friendly policies of the CDU. Meanwhile, the other parties of the radical right are more distinct, with FPÖ focusing exclusively on security concerns, trying to outbid Kurz’s encroaching on their rhetoric, whereas ELLI, apart from security, prioritizes only identity frames, frequently bemoaning the arrival of Muslim immigrants in Greece.
Looking at the parties of the “southern” cluster in Table 9.5, FdI appears closest to the other radical right parties, as it was also often complaining about the immigrants’ identity, origins, and religious leanings. But much like the other parties in this cluster, it is distinct from its other European peers due to its focus on policy efficiency, as it had to respond to the actual arrival of migrants on Italian shores. Policy efficiency frames, discussing migration in technical-efficiency terms, are the one element that separates this “southern” cluster from the other parties here.
The other characteristic element of this cluster is the frequent invocation of solidarity frames by New Democracy, the Lega, and the ÖVP – albeit in different modes. The first two appeal for solidarity and for the sharing of the burden of immigration among all member states, something no other party is doing among the ones we study. The Austrian government party, in contrast, refers to solidarity mostly to delineate the terms for providing it: which objectives, with regard to hotspots, border controls, and so on should be reached before the Greeks and Italians can enjoy the goodwill of their peers. The common thread running through the frames used by these parties is the concept of responsibility: They were all in government at the time and thus responsible for domestic policy and coresponsible for European policy. Hence their treatment of the issue from a more technical viewpoint and in terms of European policy – and hence the talk of solidarity and the conditions for providing it. In contrast to the parties in the radical right cluster, they had to devise and discuss policies at both the national and the supranational level rather than deal with the refugee crisis as a more abstract threat.
We repeat the previous exercise for the themes and present the results in Figure 9.6. We can see the same clusters of parties emerge for the themes, albeit at greater distances than for the frames. We again complement the MDS figure with the distributions of themes across parties in Table 9.6, and we can clearly see that the rhetoric with regard to themes is even more fragmentary and particularistic than the use of frames, even if we can see similar clusters emerging.
MDS configuration of parties’ relative proximity based on their use of themes

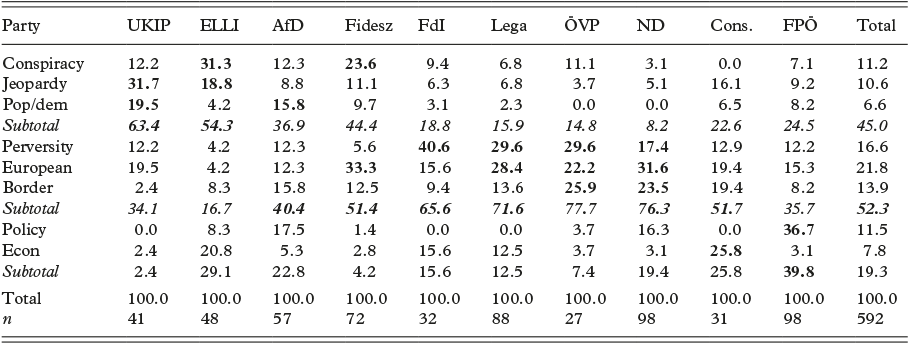
Table 9.6 demonstrates that the radical right plus Fidesz cluster mainly utilizes the first three themes, namely jeopardy (UKIP, ELLI), conspiracy (ELLI, Fidesz), and populism (AfD), with each party again utilizing a particularistic mix. For ELLI and Fidesz, the refugee crisis is often treated as a civilizational crisis, with overtones of demographic replacement and “Muslim invasions” invoked to justify their rejection of refugees. For the AfD, while those elements are present, too, it is far more important to highlight the distance between the popular distaste for immigration and the chancellery’s policies. The AfD tends to add some more themes of European failure and sovereigntist frames, as we have seen previously; hence, it slightly diverges from the cluster’s core and scores comparatively high in the second dimension. Meanwhile, UKIP and ELLI constantly remind the public that refugees represent a potential security risk in myriad ways: They can bring terror, crime, or disease and threaten our societies.
For the Italian, Greek, and Austrian parties, the same is not true. While those themes are somewhat utilized, they focus much more on perversity, particularly the Italian parties, and on European themes. The first comprise a set of themes that function as a counterintuitive rhetoric. Rather than accept that their policies cause an increase in human lives lost, these parties try to turn the issue on its head: It is actually the left, whose open border policies in the past invited those people in, that is responsible for the drownings. It is the NGOs acting as a pull factor, it is the humanitarian organizations providing them aid that cause the most suffering, and so on. This can be summarized simply as a doctrine of “strictness as humanitarianism” in contrast with the deadly consequences of leniency toward the refugees. Salvini uses this theme predominantly, and so does the FdI’s Meloni, while Mitsotakis and Kurz often deploy it, too, aiming to shield themselves from humanitarian critiques.
What they do share in common with the radical right cluster is their frequent use of European themes. But unlike the sovereigntist tones of the AfD and the apocalyptic appeals of Fidesz harping on about “European weakness and decay,” these parties drift toward themes that either plead for more solidarity from Europe or encourage further cooperation within it. As such, they occupy a distinct position compared to the radical right and Fidesz.
It is also noteworthy that the Conservatives tend to veer off to a corner in both figures. As both tables show, they produce a relatively unique rhetoric, underscoring again the British distance from European politics. Preoccupied with Brexit and the quest for sovereignty, they have tended to deploy sovereignty frames and talk about migration in economic terms, grouping the refugee crisis with the wider issue of intra-European migration that was a more salient concern for them than refugees arriving from Syria to Greek and Italian shores. The focus on economic themes is something they do have in common with three of the four southern European parties, the radical right ones, which also stressed the economic pressure from refugees on their already economically squeezed social systems.Footnote 3
Overall, though, we should not entirely focus on differences but also remark that the themes of perversity, jeopardy, Europe as well as more vague calls for tighter border protection are staples in all kinds of right-wing rhetoric and comprise a part of all parties’ speech. While the degree to which they resort to those tropes differs, it should be remembered that they all do resort to them and mostly alternate in representing the refugee crisis through one of these lenses.
Discussion and Conclusions
In this chapter, we tried to examine right-wing discourse on the immigration crisis, attempting to trace both how right-wing actors responded to an issue that had such a strong humanitarian overtone as well as what the elements were that allowed them to be the main beneficiaries of this crisis (see Chapter 14). We also wondered whether there was a convergence of rhetoric, culminating in a transnational radical right discourse, that shifted away from nationalism and sovereignty toward a defense of common European cultural heritage against the “migrant invaders.”
While the data used in this chapter are not sufficient to provide a definitive response, they can lead to some preliminary conclusions. First, we saw that the common way the right-wing parties tried to shift attention away from the humanitarian initial response to the refugee crisis was by primarily framing it as a “security” type of issue, either stressing abstractly that border protection needed to be tightened to boost security or presenting specific types of threats, like terrorism or crime, which would manifest due to the arrival of migrants and refugees. Concurrently, if there were any elements of a common discourse, these were centered around qualms about the efficiency of current border and asylum policies, which were typically deemed too liberal, and disdain for the “do-gooders” of NGOs and left parties, who sabotaged efforts to tighten security and inadvertently helped the smugglers and traffickers. In short, the frame of security and the themes of perversity, jeopardy, and calls to tighten border and asylum policies were dominant across the right-wing spectrum.
Beyond this common core, though, the parties did not speak with a united voice. We did, indeed, trace elements of a “civilizational” discourse, especially in Fidesz’s, ELLI’s and FdI’s speeches, stressing the need to protect European civilization from the invaders. But the mainstream right parties and the rest of the radical right did not particularly adopt this kind of civilization clash theme. Instead, some of the parties we examined continued to bang on the sovereignty drum, while others focused almost exclusively on security/jeopardy issues.
The overall attitude toward Europe was – to say the very least – divided. We noted a strong contingent that had outright Eurosceptic tendencies, such as the cases of UKIP, AfD, and the Conservatives, stressing the need for more sovereignty. Fidesz and the FdI were somewhere in the middle, criticizing European “weakness” when dealing with the refugee threat, sometimes urging the need for separate national-level action, sometimes urging a change in European practices themselves. Finally, other parties, especially the ones that were eventually tasked with governing during the refugee crisis or its aftermath, such as the Lega, the ÖVP, and New Democracy, concurrently leaned toward a tighter integration of asylum and migration policies at the European level and toward a much stricter regime.
Some scholars have mentioned the “ambivalence” of radical right parties toward the EU (Lorimer Reference Lutz, Kaufmann and Stünzi2021). In our limited data, at least, this ambivalence manifested mostly at the aggregate level, that is, with some parties opting for closer and stricter integration and others remaining attached to sovereigntist claims. Yet some, like Fidesz, showcased this theorized ambivalence more clearly, concurrently bemoaning the EU’s policies and urging a different type of union rather than abandoning it altogether, even if they are located far removed from the solidaristic solutions proposed by the southern European parties.
We can summarize and synthesize the preceding discussion by concluding that, for all parties, there is a common corpus of security frame discourse and then each party, on the margin, adds rhetoric and frames strategically, based on contextual factors. These factors are mainly three. First, the country’s position or type, which spurred the creation of a joint security–solidarity discourse, for example, a frame mainly proposed by the Lega and New Democracy. Operating in frontline states, these parties aimed for a tighter integration of EU policies and redistribution of refugees, which would alleviate the more urgent problems of their country.
Secondarily, the party constellation and positioning of the other parties also had an impact on the type of framing and rhetoric. The AfD, for example, utilized populist themes more often than other radical right parties did, insisting on juxtaposing Merkel’s welcoming attitude to the average German’s – supposed – hostility toward migrants. In Italy and Greece, this manifested with a sort of division of labor, with the governing parties focusing more on solidarity frames, European and policy-related themes, whereas the radical right parties in opposition tried to carve out a niche based more on cultural-identity concerns and conspiratorial claims, such as the threat of a “migrant invasion.”
Finally, the third factor is the timing of the refugee crisis in relation to the already existing political competition, providing incentives for the use of context-specific frames and themes. Thus, southern European parties deploy economic pressure/resource competition themes much more frequently than others, arguably driven by the dire economic straits their electorate found itself in on the eve of the refugee crisis. In Germany, the AfD emerged as the radical right pole of the party system at a time of increased Euroscepticism at the fringes of the political system, which is reflected by its much more frequent usage of sovereignty frames compared to other similar parties. The UK conservatives and UKIP, meanwhile, were already doing their utmost to please the “sovereignty base” of their parties by stressing the issue endlessly, a precursor to the Brexit activity that followed. Overall, the other crises that had preceded or followed the refugee crisis also played a role in the framing and representations associated with the refugee crisis.
To conclude, while there were some seeds of transnational discourse, mainly fixated on security and threat themes, in reality, the right-wing parties do not deploy a common rhetorical and framing template but share a common pool from which they borrow a wide array of frames and arguments liberally, depending on their country’s context, the political competition there, and the issues that were dominant when the crisis was introduced in their respective countries. The result is the existence of a right-wing discourse that is not entirely unified but is, rather, a sort of kaleidoscope through which different patterns and permutations of arguments and frames present themselves as each party sees fit, depending on its strategic calculus and the country’s status quo.


 Open access