


The freely available Shuttle Radar Topography Mission (SRTM3; 3” or ∼90 m resolution) digital elevation model (DEM) provides the opportunity to calculate changes in glacier surface elevation and thus ice mass for a large sample of glaciers at the same time. Depending on the availability and quality of an earlier DEM, overall changes for a period of a few decades can be calculated. Such changes have already been computed for several mountain ranges, and in all cases a massive thinning (down-wasting) of the lower parts of large and flat glacier tongues has been shown (e.g. Reference Rignot, Rivera and CasassaRignot and others, 2003; Reference Surazakov and AizenSurazakov and Aizen, 2006; Reference Larsen, Motyka, Arendt, Echelmeyer and GeisslerLarsen and others, 2007; Reference Schiefer, Menounos and WheateSchiefer and others, 2007). Moreover, all the studies point to an acceleration of glacier wastage in the past decade and the contribution of glacier melt to global sea-level rise has been frequently revised upwards. In this respect, some of the studies (not all) corrected the SRTM3 DEM at higher elevations for a systematic bias that has been reported by Reference Berthier, Arnaud, Vincent and RémyBerthier and others (2006) for stable non-glacier terrain. With this elevation-dependent correction, the elevation change in the accumulation area of glaciers is reduced and leads to a smaller estimate of the total volume change (cf. Reference Schiefer, Menounos and WheateSchiefer and others, 2007). However, other recent studies have not found such a bias (Reference Larsen, Motyka, Arendt, Echelmeyer and GeisslerLarsen and others, 2007) or have even applied a correction in the opposite direction (Reference Möller, Schneider and KilianMöller and others, 2007). As the DEMs used for comparison with the SRTM3 DEM largely differ in quality, it is difficult to say whether SRTM elevations should be corrected or not.
In a new study (Paul and Haeberli, in press), elevation changes have been calculated for the glaciers in the Swiss Alps by differencing the SRTM3 DEM (resampled to 25 m resolution) from a swisstopo DEM from about 1985 with the same resolution. A similar bias to that described by Reference Berthier, Arnaud, Vincent and RémyBerthier and others (2006) was found for non-glacier terrain. In order to assess whether this trend is only within the SRTM3 DEM (and must thus also be corrected over glacier areas), the influence of spatial resolution on DEM elevations has been assessed with an experiment based solely on the swisstopo DEM, that is, not influenced by problems resulting from comparing DEMs of different sources. The 25 m cells of the swisstopo DEM were averaged (mean value) to 100 m cells and resampled (bilinear) back to 25 m cells. Then the original DEM was subtracted from the resampled DEM. Finally, mean elevation differences were calculated in 100 m bins over glacier and non-glacier terrain (Fig. 1).
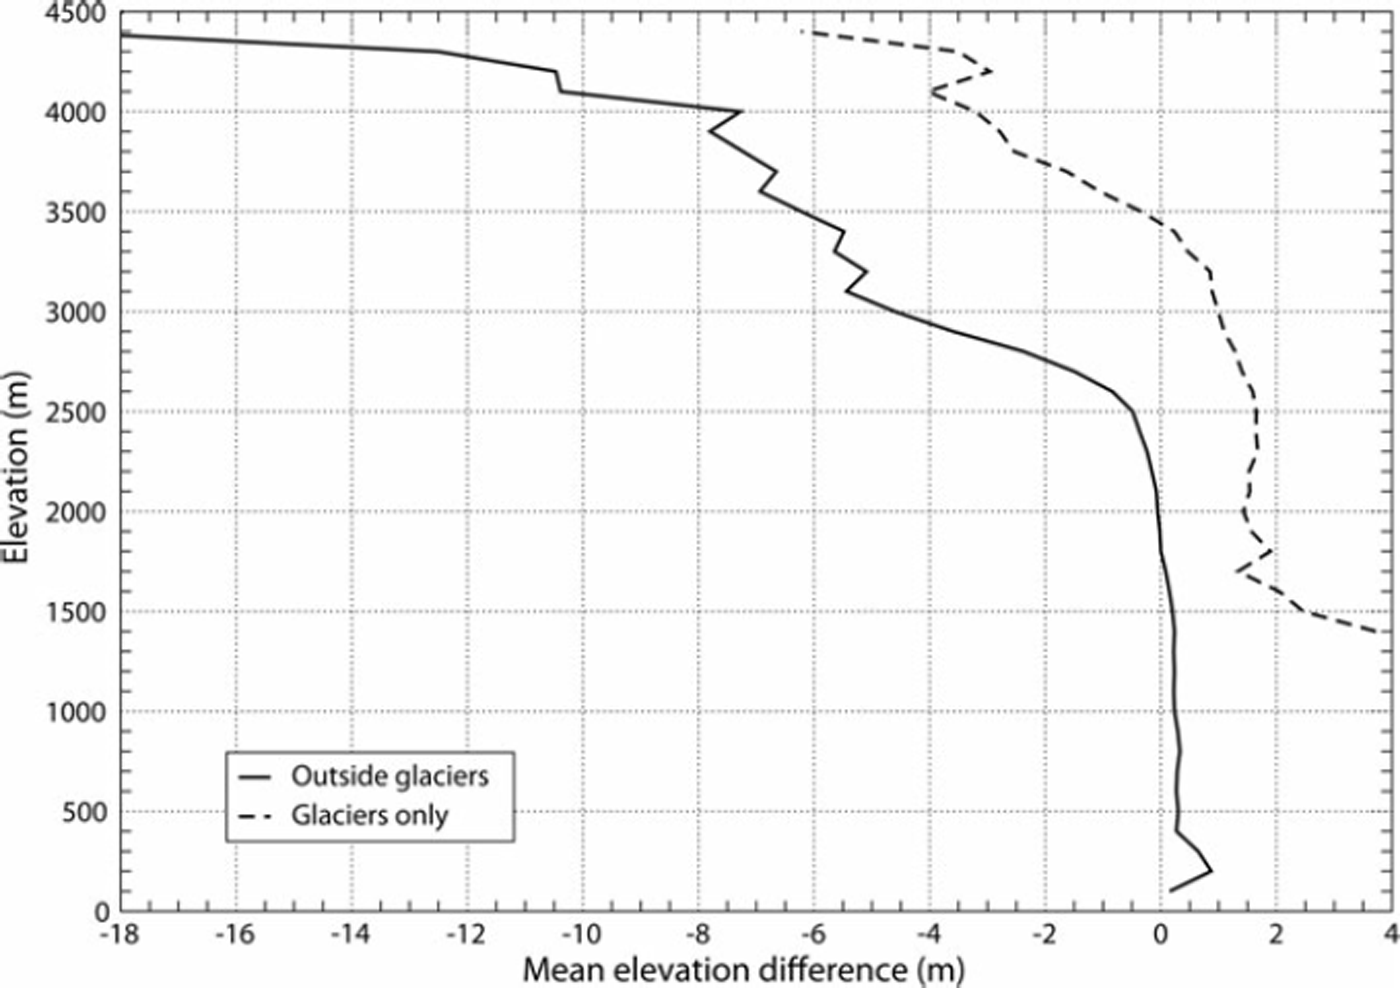
Fig. 1. Mean elevation differences with elevation calculated by subtracting the 25 m cells from the 100 m cells (which have been resampled before to 25 m) using the same DEM from swisstopo.
Over non-glacier terrain, mean elevation differences are small below 2500 m, but at higher elevations both DEMs increasingly deviate by about −4 m at 3000 m a.s.l. and −8 m at 4000 m a.s.l. This is similar to the correction factors suggested by Reference Berthier, Arnaud, Vincent and RémyBerthier and others (2006) and applied in some other studies (Reference Surazakov and AizenSurazakov and Aizen, 2006; Reference Schiefer, Menounos and WheateSchiefer and others, 2007). Based on this resolution-dependent bias, one might consider subtracting the SRTM3 DEM from the averaged 100 m swisstopo DEM. A quick analysis reveals (not shown here) that the elevation differences still exist (although they are smaller), because the generation of the swisstopo DEM also included additional vector datasets (e.g. breaklines, rivers, lake contours, spot elevations), which create a more pointed DEM (with steeper slopes) than without such data. Over glacier surfaces only, there is also a trend with elevation (Fig. 1), but only above 3000 m, and up to 3500 m the differences are slightly positive.
The reason for the systematic trend (or bias) over non-glacier terrain is that steep ridges/mountain crests are more frequent towards higher elevations and the elevation of these structures is underestimated in the coarser-resolution DEM. On the other hand, steep terrain at lower elevations is often related to gorges or conduits where elevations are overestimated in the coarser- resolution DEM. Hence, slope is not a unique indicator for the elevation difference, as plan curvature (convex, concave) determines the sign of the difference. When the sign is neglected, elevation differences exponentially increase with mean slope. For glacier surfaces, mean slope increases with elevation (due to steeper regions towards the bergschrund) and elevation differences reach ∼2 m for a slope of 40°. Thus, the increase of mean slope on glaciers could explain the calculated trend with elevation for glacier surfaces (Fig. 1). However, as the computed differences are generally small (±2 m) and thus well within the accuracy of the SRTM3 DEM, a correction based on local glacier slope will mainly introduce noise. In other mountain ranges, the elevation differences for terrain over non-glacier terrain may initiate at different elevations as they largely depend on the geomorphometric properties (e.g. curvature) of the terrain.
It is concluded from this experiment that the resolution-implicit elevation bias should be calculated as described above and considered before possible correction factors are applied to the SRTM3 DEM. It will be interesting to know how the glacier volume changes calculated in previous studies (e.g. Reference Surazakov and AizenSurazakov and Aizen, 2006; Reference Schiefer, Menounos and WheateSchiefer and others, 2007) change without the bias correction.
Acknowledgements
I thank M. King and R. Wheate for reviews which helped to improve the clarity of this correspondence.
11 September 2008

