


1. Introduction
Active regions are generally thought to be formed by coherent, arched magnetic flux tubes rising through the interior to manifest as roughly east-west aligned opposite polarity pairs at the surface of the Sun. In many dynamo models they are important to convert the Sun’s global toroidal magnetic field to poloidal (Cameron & Schüssler Reference Cameron and Schüssler2015). Understanding the physics behind the emergence process is important to constrain their origins and connection to the Sun’s large scale global field, as well as for space weather forecasting.
It is not clear from what depth these flux tubes originate, nor what causes them to rise. At the surface and below, the Sun’s magnetic field is embedded in the convective flows, and as such can be modelled with the equations of magnetohydrodynamics. Below the surface, the plasma pressure is generally greater than the magnetic pressure. Understanding the dominant terms in these equations, particularly the flows and the magnetic field, is important to understand how active regions form.
Simulations of magnetic flux emergence show that thin flux tubes can rise a priori from the base of the convection zone due to magnetic buoyancy in the absence of convection (e.g. Fan, Fisher, & Deluca Reference Fan, Fisher and Deluca1993; Weber, Fan, & Miesch Reference Weber, Fan and Miesch2011); or tubes of magnetic flux can be formed within the convection zone itself and brought up by convective upflows (e.g. Chen, Rempel, & Fan 2007; Hotta & Iijima Reference Hotta and Iijima2020). It may also be possible for active regions to form without the presence of a flux tube (e.g. Brandenburg Reference Brandenburg2005; Brandenburg et al. Reference Brandenburg, Gressel, Jabbari, Kleeorin and Rogachevskii2014). For a full review see Fan (Reference Fan2021).
The thin flux tube models in Fan (Reference Fan2008) predict a retrograde flow at the peak of the flux tube just before emergence. In principle, local helioseismology could be used to measure this flow. Local helioseismology measures perturbations to the natural seismic oscillations driven by the turbulent convection at the surface of the Sun and infers the three-dimensional subsurface structure and dynamics in localised areas (see Gizon & Birch Reference Gizon and Birch2005, for a full overview). Birch et al. (Reference Birch, Braun, Leka, Barnes and Javornik2013) used helioseismic holography (Lindsey & Braun Reference Lindsey and Braun2000) to measure the subsurface flows prior to the formation of one hundred active regions observed by the Global Oscillation Network Group (GONG; Harvey, Tucker, & Britanik Reference Harvey, Tucker, Britanik and Korzennik1998). They found that there were no statistically significant flows below the surface, however near the surface they found a statistically significant flow of about 15 ms $^{-1}$
towards the emergence location in the day preceding the active region formation.
$^{-1}$
towards the emergence location in the day preceding the active region formation.
Recently, it has become apparent that the near-surface convective flows themselves are important in the emergence process (see Weber et al. Reference Weber, Schunker, Jouve and Işık2023, for a summary of the recent paradigm shift). By comparing the observed surface flows at the time of active region emergence with simulations, Birch et al. (Reference Birch, Schunker, Braun, Cameron, Gizon, Loeptien and Rempel2016) showed that flux tubes cannot be rising faster than about 100 ms $^{-1}$
through the upper convection zone, which is on the order of the convective velocities themselves. Birch et al. (Reference Birch, Schunker, Braun and Gizon2019) went on to show that, on average, active regions preferentially emerge in east-west aligned converging flow lanes, suggesting a connection to the Sun’s supergranulation pattern. Schunker et al. (Reference Schunker, Birch, Cameron, Braun, Gizon and Burston2019) showed that the growth of active regions through the emergence process is consistent with the length and timescales of supergranulation, supporting the idea that convection on these scales buffets the polarities as they emerge.
$^{-1}$
through the upper convection zone, which is on the order of the convective velocities themselves. Birch et al. (Reference Birch, Schunker, Braun and Gizon2019) went on to show that, on average, active regions preferentially emerge in east-west aligned converging flow lanes, suggesting a connection to the Sun’s supergranulation pattern. Schunker et al. (Reference Schunker, Birch, Cameron, Braun, Gizon and Burston2019) showed that the growth of active regions through the emergence process is consistent with the length and timescales of supergranulation, supporting the idea that convection on these scales buffets the polarities as they emerge.
From a practical perspective, perhaps most importantly for space weather, it would be useful to be able to predict the location and time an active region will emerge, and whether or not it is likely to have low magnetic flux or high magnetic flux. Some effort has been dedicated to this. Helioseismic studies have not resulted in a significant subsurface detection (see e.g. Komm et al. Reference Komm, De Moortel, Fan, Ilonidis and Steiner2015), but Barnes et al. (Reference Barnes, Birch, Leka and Braun2014) showed that in the day before emergence the strongest indication that an active region will emerge is the unsigned surface magnetic field itself. This was also reflected in more recent efforts using machine learning (Dhuri et al. Reference Dhuri, Hanasoge, Birch and Schunker2020).
In this paper, we examine the magnetic field prior to emergence for two samples of active regions. In Section 2 we describe our database of emerging active regions. We then outline the data reduction, computation of the surface flows, how we measure the location of the polarities in each active region, and the ensemble averaging of the flow and magnetic field maps (Section 3). In Section 4 we describe the identification of active regions that show persistent pre-emergence bipole magnetic fields. In Section 5 we show that there is a distinct difference in the averaged surface flows and magnetic field from 2 d before the emergence to 1 d afterwards, and in Section 6 we discuss the implications of our results and possible avenues to make future progress.
2. Sample of observed emerging active regions
The Solar Dynamics Observatory Helioseismic Emerging Active Region (SDO/HEAR) Survey currently consists of 182 emerging active regions (EARS) (for a full list see Schunker et al. Reference Schunker, Braun, Birch, Burston and Gizon2016, Reference Schunker, Birch, Cameron, Braun, Gizon and Burston2019) observed by the Helioseismic and Magnetic Imager onboard the Solar Dynamics Observatory (SDO/HMI, Scherrer et al. Reference Scherrer2012) between 2010 May (the start of science grade SDO/HMI observations) and 2014 July (the declining phase of solar cycle 24). To avoid complications in interpreting local helioseismology results (e.g. Schunker Reference Schunker2010), the active regions selected for the HEAR survey specifically emerge into a relatively quiet area of the Sun’s surface at least $20^\circ$
from any surrounding strong surface magnetic fields.
$20^\circ$
from any surrounding strong surface magnetic fields.
The emergence time for each active region, $t=0$
d (see Appendix A and Appendix B), is defined as the time when the absolute flux, corrected for line-of-sight projection, reaches 10% of its maximum value over a 36 h interval following the first appearance of the sunspot (or group) in the National Oceanic and Atmospheric Administration (NOAA) record (Schunker et al. Reference Schunker, Braun, Birch, Burston and Gizon2016). We emphasise that a small amount of flux from the EAR is present at the emergence time. A negative time indicates pre-emergence and a positive time indicates post-emergence for each EAR.
$t=0$
d (see Appendix A and Appendix B), is defined as the time when the absolute flux, corrected for line-of-sight projection, reaches 10% of its maximum value over a 36 h interval following the first appearance of the sunspot (or group) in the National Oceanic and Atmospheric Administration (NOAA) record (Schunker et al. Reference Schunker, Braun, Birch, Burston and Gizon2016). We emphasise that a small amount of flux from the EAR is present at the emergence time. A negative time indicates pre-emergence and a positive time indicates post-emergence for each EAR.
Time averaged line-of-sight magnetic field maps for an example EAR with a bipole associated with the emerging flux more than two days before the emergence time (top row, AR 11702). And an example of an EAR without an obviously associated pre-emergence bipole (bottom row, AR 11697). The greyscale is saturated at $\pm 15$
G. Note that these maps have not been shifted to the emergence location.
$\pm 15$
G. Note that these maps have not been shifted to the emergence location.

Each active region, labelled by its NOAA number, is paired with a corresponding control region (CR). The CR is assigned a mock-emergence time when the Stonyhurst coordinates of the CR was the same as the EAR at its (real) emergence time (see Tables A.1 and B.1 in this paper, and Schunker et al. Reference Schunker, Braun, Birch, Burston and Gizon2016, for a full description). The control region is necessary to ensure that the signal is not due to systematics from the SDO/HMI instrument or due to some line-of-sight observing effect.
3. Data reduction
Our data reduction closely follows what has already been published in Schunker et al. (Reference Schunker, Braun, Birch, Burston and Gizon2016), Birch et al. (Reference Birch, Schunker, Braun, Cameron, Gizon, Loeptien and Rempel2016) and (Reference Birch, Schunker, Braun and Gizon2019). Here we outline the relevant details for this study.
3.1. Mapping and tracking
The HMI observes the full-disk continuum intensity, line-of-sight magnetic field and Doppler velocity at the photosphere with a cadence of 45 s. We track the location of the EARs and CRs at the Carrington rotation rate over time intervals (TI) of 6.825 h (547 frames with a cadence of 45 s).
Local helioseismology measures the travel time of a wave from one location on the surface until it appears at another location on the surface. Waves travel at the local sound speed, and generally waves that travel shorter distances do so over a shorter time. The waves we are interested in for this study have travel times less than about 6 h, and so this is the length of time we chose for a single time interval and the corresponding datacube.
These datacubes are labelled with their time interval (TI) relative to the emergence time interval, TI+00. The emergence time is defined as $\tau=0.0$
d, and the mid-time of time interval TI+00 corresponds to
$\tau=0.0$
d, and the mid-time of time interval TI+00 corresponds to $\tau=0.1$
d (see Table B.1 in Schunker et al. Reference Schunker, Birch, Cameron, Braun, Gizon and Burston2019, which lists the mid-time of each TI relative to the time of emergence,
$\tau=0.1$
d (see Table B.1 in Schunker et al. Reference Schunker, Birch, Cameron, Braun, Gizon and Burston2019, which lists the mid-time of each TI relative to the time of emergence, $\tau=0$
). The beginning of each time interval is spaced at 5.3375 h (320.25 min, 427 frames), and they have a 1.5 h, or 120 frame, overlap (see Figure 5 in Schunker et al. Reference Schunker, Braun, Birch, Burston and Gizon2016). Each active region is tracked up to 7 d before and after the emergence time, depending on their distance to central meridian at that time.
$\tau=0$
). The beginning of each time interval is spaced at 5.3375 h (320.25 min, 427 frames), and they have a 1.5 h, or 120 frame, overlap (see Figure 5 in Schunker et al. Reference Schunker, Braun, Birch, Burston and Gizon2016). Each active region is tracked up to 7 d before and after the emergence time, depending on their distance to central meridian at that time.
At each 45 s interval we projected the full-disk SDO/HMI observations onto $60^\circ \times 60^\circ$
Postel projection maps. The projection is made to a
$60^\circ \times 60^\circ$
Postel projection maps. The projection is made to a $512 \times 512$
pixel grid with a pixel size of 1.39 Mm. The coordinates of the map centre are the flux-weighted centre of the line-of-sight magnetic field at the emergence time (see Schunker et al. Reference Schunker, Braun, Birch, Burston and Gizon2016, for more details). In this article we examine the magnetic field maps averaged over each 6.825 h time interval to correspond directly to the flows.
$512 \times 512$
pixel grid with a pixel size of 1.39 Mm. The coordinates of the map centre are the flux-weighted centre of the line-of-sight magnetic field at the emergence time (see Schunker et al. Reference Schunker, Braun, Birch, Burston and Gizon2016, for more details). In this article we examine the magnetic field maps averaged over each 6.825 h time interval to correspond directly to the flows.
3.2. Computing the surface flows
Local helioseismology is a tool that uses the acoustic waves in the Sun to map the three-dimensional subsurface structure and/or dynamics (for a review of the different methods and key results see Gizon & Birch Reference Gizon and Birch2005). For example, perturbations to the travel times of the waves can be interpreted as a linear perturbation to the structure and dynamics of the interior of the Sun at the depths where that particular wave has sensitivity. By selecting waves that are sensitive to the near-surface of the Sun, we can infer the horizontal flows which can then be used to identify supergranulation structures (e.g. Gizon, Duvall, & Schou Reference Gizon, Duvall and Schou2003).
We filtered the tracked and remapped Doppler velocities with a phase-speed filter with a central phase speed of $17.49$
km s
$17.49$
km s $^{-1}$
and a width of
$^{-1}$
and a width of $2.63$
km s
$2.63$
km s $^{-1}$
(filter 3 from Table 1 in Couvidat et al. Reference Couvidat, Gizon, Birch, Larsen and Kosovichev2005). This filter isolates waves that are most sensitive to the 3 Mm just below the photosphere. We then measured the north-south and east-west travel time differences using surface-focusing helioseismic holography (Lindsey & Braun Reference Lindsey and Braun2000). We used an empirically determined conversion constant of
$^{-1}$
(filter 3 from Table 1 in Couvidat et al. Reference Couvidat, Gizon, Birch, Larsen and Kosovichev2005). This filter isolates waves that are most sensitive to the 3 Mm just below the photosphere. We then measured the north-south and east-west travel time differences using surface-focusing helioseismic holography (Lindsey & Braun Reference Lindsey and Braun2000). We used an empirically determined conversion constant of $-7.7$
ms
$-7.7$
ms $^{-2}$
to convert from travel time differences to surface flows (Birch et al. Reference Birch, Schunker, Braun, Cameron, Gizon, Loeptien and Rempel2016).
$^{-2}$
to convert from travel time differences to surface flows (Birch et al. Reference Birch, Schunker, Braun, Cameron, Gizon, Loeptien and Rempel2016).
We removed any remnant large scale velocities from the Sun’s bulk rotation or orbital velocity of the SDO satellite (a constant offset) in the flows by subtracting a plane fit to each map, excluding a central region of radius 70 Mm (50 pixels) which is our region of interest where the active regions emerge. To remove high-wavenumber noise, we used a low-bandpass filter with a value of 1 for $k R_\odot < 140$
, a raised cosine from 1 to 0 in the region
$k R_\odot < 140$
, a raised cosine from 1 to 0 in the region $140 < k R_\odot < 220$
, and zero for
$140 < k R_\odot < 220$
, and zero for $k R_\odot > 220$
. We then have surface flow maps,
$k R_\odot > 220$
. We then have surface flow maps, $\textbf{v}_{\textbf{x}}(x,y)$
and
$\textbf{v}_{\textbf{x}}(x,y)$
and $\textbf{v}_{\textbf{y}}(x,y)$
at a 5.3375 h time interval, corresponding to the time-averaged magnetic field maps (described at the end of Section 3.1).
$\textbf{v}_{\textbf{y}}(x,y)$
at a 5.3375 h time interval, corresponding to the time-averaged magnetic field maps (described at the end of Section 3.1).
To create ensemble averages, we treated all active regions as if they were in the northern hemisphere, so that positive $\textbf{y}$
, is towards the pole (north); negative
$\textbf{y}$
, is towards the pole (north); negative $\textbf{y}$
is towards the equator (south); positive
$\textbf{y}$
is towards the equator (south); positive $\textbf{x}$
is in the prograde (solar west) direction; and negative
$\textbf{x}$
is in the prograde (solar west) direction; and negative $\textbf{x}$
is in the retrograde (solar east) direction.
$\textbf{x}$
is in the retrograde (solar east) direction.
We reversed the magnetic field polarity of the regions in the southern hemisphere, to account for Hale’s law when averaging EARs, so that the leading polarity is always negative. Under the assumption that the magnetic field is radial at the solar surface, we approximately corrected for the magnitude of the magnetic field for the line-of-sight projection by dividing it by $\cos \theta$
, where
$\cos \theta$
, where $\theta$
is the angular distance to disk centre.
$\theta$
is the angular distance to disk centre.
For active regions in the southern hemisphere, we flipped the averaged magnetic field and flow maps in the latitudinal direction to account for the pole-to-equator symmetry, and reversed the direction of the flows in the north-south direction, so that the poleward flows are in the positive y-direction. We then computed the divergence of the flows, $\boldsymbol{\nabla} \cdot \textbf{v}_{\textbf{h}}$
where
$\boldsymbol{\nabla} \cdot \textbf{v}_{\textbf{h}}$
where $\textbf{v}_{\textbf{h}} =(\textbf{v}_{\textbf{x}}, \textbf{v}_{\textbf{y}})$
, as the most representative way to show the location of the supergranules, which are the tops of convection cells.
$\textbf{v}_{\textbf{h}} =(\textbf{v}_{\textbf{x}}, \textbf{v}_{\textbf{y}})$
, as the most representative way to show the location of the supergranules, which are the tops of convection cells.
3.3. Measuring the location of the bipoles
The magnetic field associated with an emergence can have significant proper motion compared to the Carrington rotation rate. To analyse the evolution of the flows associated with the EARs, we measured the location of the active region magnetic field at each time interval.
We tracked the position of the centroid of the positive and negative polarity in the active region as described in Schunker et al. (Reference Schunker, Birch, Cameron, Braun, Gizon and Burston2019), and we outline the process here. We first measured the location of the roughly circular polarities with a threshold magnetic field strength of 20 G at time interval TI+02 ( $\tau=0.6$
d). We used a feature recognition algorithm (feature.pro copyright 1997, John C. Crocker and David G. Grier) designed to determine the centroid position of roughly circular features in an image to determine the location of both polarities individually. Moving forward and backwards in time, we repeated the process and selected the x and y-centroid closest to the polarity location in the previous time interval.
$\tau=0.6$
d). We used a feature recognition algorithm (feature.pro copyright 1997, John C. Crocker and David G. Grier) designed to determine the centroid position of roughly circular features in an image to determine the location of both polarities individually. Moving forward and backwards in time, we repeated the process and selected the x and y-centroid closest to the polarity location in the previous time interval.
If the location of the bipole at some time interval was not defined (e.g. a bipole cannot be detected), then we linearly interpolated for the x and y-centroid locations from the nearest time intervals. For times before a clear bipole was detected, we extrapolated the first measured location of the bipole. Similarly, for times after emergence when a clear bipole could no longer be detected, e.g. after decay, we extrapolated the last measured location of the bipole.
We shifted the averaged magnetic field and flow maps, using a bi-linear interpolation (over the nearest four pixels), for each EAR to the point halfway between the centroid locations at each time interval. The shifts are typically on the order of up to 5 pixels. The shifting of the maps at each time interval removing the proper motion of the bipole is unique to the analysis method in this paper, and is required to get a well-defined mean of the absolute magnetic field prior to emergence.
4. Identification of persistent magnetic bipoles before emergence
Active regions are defined by their dark appearance in the intensity of light from the surface of the Sun. This is due to the strong concentrations of magnetic field, that appear in an east-west aligned pair of opposite polarities on the solar surface and that increase in size and field strength as more flux emerges (see, e.g. Figure 1 in Schunker et al. Reference Schunker, Birch, Cameron, Braun, Gizon and Burston2019). It takes about 2 d on average from the time of emergence for an active region to reach its maximum flux (see Figure 2 in Weber et al. Reference Weber, Schunker, Jouve and Işık2023).
Averaged divergence flow maps over N active regions with pre-emergence bipoles at different time intervals. Blue represents converging flows and red represents diverging flows. The arrows indicate the direction and magnitude of the flows. Solid (dashed) black lines contour the $-20$
G (
$-20$
G ( $+20$
G) of the averaged line-of-sight magnetic field maps. There is a significant converging flow prior to emergence.
$+20$
G) of the averaged line-of-sight magnetic field maps. There is a significant converging flow prior to emergence.

By inspection, we identified 42 EARs (listed in Appendix A) as having persistent magnetic bipoles at least one day before emergence associated with the eventual bipole structure of the active region. The persistent polarities are characterised by their roughly east-west orientation and the proximity as a pair as they are buffeted by the convection. The bipoles do not change significantly in size (on the order of 10 Mm, see Fig. 1, first panel) until the main emergence process begins closer to $t=0$
.
$t=0$
.
Some active regions, such as AR 11182 and AR 11969, show magnetic bipoles up to 2.8 d (TI-12) before emergence. An example of an EAR with a clearly associated pre-emergence bipole more than 2 d before emergence is AR 11702 shown in the top row of Fig. 1.
For a contrasting sample, we selected an equal number (42) of EARs that, by inspection, are not associated with any magnetic field bipoles prior to $t=-0.3$
d (listed in Appendix B). One example is AR 11697 shown in the bottom row of Fig. 1. These two samples may constitute the extremes of a continuum allowing us to clearly identify any fundamental differences in their evolution.
$t=-0.3$
d (listed in Appendix B). One example is AR 11697 shown in the bottom row of Fig. 1. These two samples may constitute the extremes of a continuum allowing us to clearly identify any fundamental differences in their evolution.
Any EARs with dense, small-scale magnetic field within $\approx$
50 Mm radius of the emergence location were excluded from either sample since they may obscure the identification of any pre-emergence bipole. In Schunker et al. (Reference Schunker, Braun, Birch, Burston and Gizon2016), the authors defined a P-factor, where 0 represents an emergence into a very quiet region; a P-factor of 1 or 2 indicates emergence into increasing amounts of magnetic field nearby (but not directly at) the subsequent emergence location; and a P-factor of 3 or higher indicates the region may be compromised by pre-existing field at the emergence time and location. We cross-checked the P-factor for the active regions identified in our two samples, and found that neither of the samples we identified have a dominant P-factor, and were mostly 0 or 1.
$\approx$
50 Mm radius of the emergence location were excluded from either sample since they may obscure the identification of any pre-emergence bipole. In Schunker et al. (Reference Schunker, Braun, Birch, Burston and Gizon2016), the authors defined a P-factor, where 0 represents an emergence into a very quiet region; a P-factor of 1 or 2 indicates emergence into increasing amounts of magnetic field nearby (but not directly at) the subsequent emergence location; and a P-factor of 3 or higher indicates the region may be compromised by pre-existing field at the emergence time and location. We cross-checked the P-factor for the active regions identified in our two samples, and found that neither of the samples we identified have a dominant P-factor, and were mostly 0 or 1.
In summary, we have averaged line-of-sight magnetic field maps, B
los(x,y), flow maps, $\textbf{v}_{\textbf{x}}(x,y)$
and
$\textbf{v}_{\textbf{x}}(x,y)$
and $\textbf{v}_{\textbf{y}}(x,y)$
, and flow divergence maps
$\textbf{v}_{\textbf{y}}(x,y)$
, and flow divergence maps $\nabla \cdot \textbf{v}_{\textbf{h}}$
with a 5.3375 h cadence, centred on the bipole location at each time interval for 42 EARs with persistent pre-emergence bipoles, and 42 EARs without pre-emergence bipoles.
$\nabla \cdot \textbf{v}_{\textbf{h}}$
with a 5.3375 h cadence, centred on the bipole location at each time interval for 42 EARs with persistent pre-emergence bipoles, and 42 EARs without pre-emergence bipoles.
5. Evolution of the average magnetic field and flows
We averaged the magnetic field maps and the flows for each sample of EARs (with and without persistent pre-emergence bipoles). Figs. 2 and 3 show the average surface flows at each time interval for the two samples. The equivalent maps for the control regions are in Figs. C.1 and C.2 in Appendix C.
Averaged divergence flow maps over N active regions without pre-emergence bipoles at different time intervals. Blue represents converging flows and red represents diverging flows. The arrows indicate the direction and magnitude of the flows. Solid (dashed) black lines contour $-20$
G (
$-20$
G ( $+20$
G) of the averaged line-of-sight magnetic field maps. There is no significant flow signal prior to emergence, however, there is a significant diverging flow post-emergence.
$+20$
G) of the averaged line-of-sight magnetic field maps. There is no significant flow signal prior to emergence, however, there is a significant diverging flow post-emergence.

The sample of EARs with persistent pre-emergence bipoles (Fig. 2) shows a converging flow at the location of the bipoles (centre of the map) prior to the emergence time. The growth of the bipole is shown in the contours of the mean magnetic field. The sample without pre-emergence bipoles (Fig. 3) does not show a statistically significant converging flow, but does show a statistically significant diverging flow from the time of emergence.
At each time interval we computed the spatially averaged magnetic flux within a central disk of radius 35 Mm for each active region. We chose a fixed radius that encompasses the contour of the average $|B_\mathrm{los}|=20$
G as the active region grows in size to
$|B_\mathrm{los}|=20$
G as the active region grows in size to $\tau=0.6$
d (see Fig. 2).
$\tau=0.6$
d (see Fig. 2).
The top panel of Fig. 4 shows the mean and standard error of the magnetic flux over the sample of active regions with (blue) and without (orange) pre-emergence bipoles. The expected difference in magnetic flux prior to the emergence of the active regions is clear. Then, after about –0.3 days, the averaged magnetic flux of the regions that emerge abruptly becomes higher than for the regions with pre-emergence bipoles. This shows that the active regions with pre-emergence bipoles evolve to have significantly lower flux than those without pre-emergence bipoles.
Averaged magnetic flux and flows as a function of time for active regions with pre-emergence bipoles (blue) and those without (orange). The top panel shows the average magnetic flux within a central 35 Mm radius of the emergence location as a function of time. The error bars show the standard error in the average magnetic flux over the active regions at each time interval. The dashed lines show the corresponding control regions with shaded standard errors. Active regions with pre-emergence bipoles tend to evolve to be lower magnetic flux active regions post-emergence. The second panel shows the averaged flow divergence, the third panel shows the average East-West flow, and the bottom panel shows the average North-South flow. The surface flows are averaged in the central 11 Mm radius of the emergence location.

We then averaged the surface flows in the central 11 Mm (8 pixels) radius for each active region and time interval. We chose this radius by inspection of the maps in Fig. 3 to include only the flows associated with the emergence, and note that it is on the order of supergranulation scales, but is considerably smaller than the radius of the area over which the magnetic flux was averaged (35 Mm). The lower three panels of Fig. 4 show the evolution of the averaged flow divergence, east-west velocity, and north-south velocity. The averaged flow divergence follows a similar evolution for both populations apart from an offset of about $3 \times 10^{-6}\textrm{s}^{-1}$
. The mean flow in both samples is converging up until 0.5 d before emergence,
$3 \times 10^{-6}\textrm{s}^{-1}$
. The mean flow in both samples is converging up until 0.5 d before emergence,
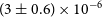
 $\langle \boldsymbol{\nabla} \cdot \textbf{v}_{\textbf{h}} \rangle = ({-}2.9 \pm 0.5) \times 10^{-6}$
s
$\langle \boldsymbol{\nabla} \cdot \textbf{v}_{\textbf{h}} \rangle = ({-}2.9 \pm 0.5) \times 10^{-6}$
s $^{-1}$
for regions with a pre-emerging bipole, and
$^{-1}$
for regions with a pre-emerging bipole, and $\langle \boldsymbol{\nabla} \cdot \textbf{v}_{\textbf{h}} \rangle = (0.03 \pm 0.4) \times 10^{-6}$
s
$\langle \boldsymbol{\nabla} \cdot \textbf{v}_{\textbf{h}} \rangle = (0.03 \pm 0.4) \times 10^{-6}$
s $^{-1}$
for those without. From about 0.5 d before emergence until about 0.1 d after emergence, the divergence increases in both samples.
$^{-1}$
for those without. From about 0.5 d before emergence until about 0.1 d after emergence, the divergence increases in both samples.
The flows for both samples are strongest in the east-west direction, $\langle \textbf{v}_{\textbf{x}} \rangle$
, and peak close to the time of emergence at about 70 ms
$\langle \textbf{v}_{\textbf{x}} \rangle$
, and peak close to the time of emergence at about 70 ms $^{-1}$
. The flows in the north-south direction,
$^{-1}$
. The flows in the north-south direction, $\langle \textbf{v}_{\textbf{y}} \rangle$
, are consistent with zero and do not vary significantly, due to averaging over the antisymmetric flow in the north-south direction (see Fig. 2).
$\langle \textbf{v}_{\textbf{y}} \rangle$
, are consistent with zero and do not vary significantly, due to averaging over the antisymmetric flow in the north-south direction (see Fig. 2).
Most of the surface of the Sun consists of the diverging flows of granules and supergranules. Statistically, it is more likely that a randomly selected location on the surface will be a diverging flow, rather than the narrower inflow lanes. This is reflected in Figs. C.1 and C.2 (which shows the averaged surface flow maps of the control regions), and the orange dashed curve in the second panel of Fig. 4. The averaged divergence signal close to the emergence time in Fig. 4 is equivalent in magnitude to other diverging flows in the map (see Appendix C), showing that it is not significant compared to the background signal. Because we averaged the flows over a relatively small sample of active regions and the averaging area (diameter of about 20 Mm) is the size of a supergranule, we have captured the evolution of supergranulation-scale flows.
6. Discussion
From our classification of two samples of EARs based on their pre-emergence bipole signatures we found that these samples also form distinct post-emergence populations of active regions. The sample of active regions with persistent pre-emergence bipoles evolve to be, on average, lower flux active regions,Footnote 1 and those that emerge more abruptly are higher flux active regions. It is not clear why this is the case, but suggests that there is some flux dependence in the growth and evolution of active regions.
Our results are consistent with Birch et al. (Reference Birch, Schunker, Braun and Gizon2019) who showed that active regions tend to emerge into regions of converging flow, but we add that the amplitude and sign of the flow divergence is flux dependent. We find that the sample with persistent pre-emergence bipoles emerges into strong converging flows and these flows begin more than two days prior to emergence. Pre-emergence bipoles confined to the converging flow lanes between supergranules is not surprising since small, lower flux magnetic features are buffeted by the flows at the surface of the Sun.
Additionally, Birch et al. (Reference Birch, Schunker, Braun, Cameron, Gizon, Loeptien and Rempel2016) showed that the upward rise speed of flux tubes that form active regions must be on the order of the convective flow velocities, based on the lack of any diverging flow signature in a single observed active region. In our statistical analysis, we have shown that some samples of active regions are associated with a diverging flow, although the magnitude is on the order of supergranulation velocities ( $\approx$
100 ms
$\approx$
100 ms $^{-1}$
) and not as strong as the diverging flows produced by simulations of a traditional thin flux tube (up to 500 ms
$^{-1}$
) and not as strong as the diverging flows produced by simulations of a traditional thin flux tube (up to 500 ms $^{-1}$
Birch et al. Reference Birch, Schunker, Braun, Cameron, Gizon, Loeptien and Rempel2016).
$^{-1}$
Birch et al. Reference Birch, Schunker, Braun, Cameron, Gizon, Loeptien and Rempel2016).
Furthermore, this sample of EARs shows that higher flux active regions emerge with stronger diverging flows. This may suggest that it is easier to form a large active region where the converging (down) flow is weak, and/or that the magnetic flux is brought up in the upflows of newly forming supergranules. On the other hand, it could also suggest that tubes with higher magnetic flux rise faster, driving a moderate surface diverging flow at the time of emergence. This can only be properly explored once the emergence process of the full sample of active regions is (better) understood.
We suspect that these active regions with pre-emergence bipoles are responsible for the conclusions of Barnes et al. (Reference Barnes, Birch, Leka and Braun2014) and Dhuri et al. (Reference Dhuri, Hanasoge, Birch and Schunker2020) that the best predictor of an imminent active region emergence is the surface magnetic field itself. It may also be that these active regions are at the sites of active region ‘nests’ (Işık et al. Reference Işık, Shapiro, Solanki and Krivova2020) or active longitudes (e.g. Berdyugina & Usoskin Reference Berdyugina and Usoskin2003) supplementing the surface small-scale magnetic field from below. A larger sample of active regions will help to explore this idea.
We also note that we are limited by our resolution of 1.39 Mm per pixel, which is four times coarser than the nominal HMI resolution. From inspection of some of the full resolution line-of-sight magnetograms for these active regions, the onset of the bipoles before emergence and their motions can be tracked more precisely.
Hotta & Iijima (Reference Hotta and Iijima2020) have successfully formed a small active region by placing a flux tube at some depth in their three-dimensional numerical magnetohydrodynamic simulations where the near-surface convective flows have brought the flux to the surface. The key to the formation of their active region is placement in an upflow region sandwiched between two downflow regions. The emergence in an upflow region is consistent with our sample of EARs with higher flux, but without pre-emergence bipoles. These simulations are computationally expensive, and while an equivalent statistical sample of emerging active regions to compare with is prohibitive, such simulations are crucial to probe the subsurface mechanisms of active region formation.
7. Conclusions
We have identified two distinct samples of emerging active regions: one sample with a persistent magnetic bipole more than one day prior to emergence, and one sample that emerges abruptly. There are 42 active regions in each sample, which may constitute the extremes of a continuum.
We found that both samples of active regions are associated with converging flows prior to emergence, but that the magnitude of the convergence was statistically significantly different, with the sample of active regions with a persistent pre-emergence bipole emerging into strongly converging flows. We also found a statistical dependence on the post-emergence flux of the active regions, where the sample of active regions with a persistent pre-emergence bipole evolved into lower flux active regions, with an average flux of $(19\pm1.3)\,\times 10^{20}$
Mx, and those without evolved into stronger active regions, with an average flux of
$(19\pm1.3)\,\times 10^{20}$
Mx, and those without evolved into stronger active regions, with an average flux of $(24\pm1.8) \times 10^{20}$
Mx.
$(24\pm1.8) \times 10^{20}$
Mx.
Furthermore, we found that the higher flux active regions are associated with a diverging flow at the time of emergence, whereas the lower flux active regions did not show any significant flow signature. The ensemble averages of the flows for both samples show the same profile of the diverging flows in time, offset by about $3 \times 10^{-6}\textrm{s}^{-1}$
(and about 30 ms
$3 \times 10^{-6}\textrm{s}^{-1}$
(and about 30 ms $^{-1}$
in the averaged east-west flows).
$^{-1}$
in the averaged east-west flows).
We have presented a new observational constraint for flux emergence models, and a potential quantity to predict the maximum magnetic flux of an emerging active region. A full interpretation of these intriguing results requires both a more in-depth observational analysis of a broader sample of active regions coupled with numerical simulations of rising flux tubes with a range of magnetic fluxes. This will help to understand whether the flux dependence of the flows in these samples we have identified are distinct or are the extremes of a continuum of EARs governed by a single emergence mechanism.
Data availability statement
The HEARs data can be reproduced following the description in this paper and more fully from Schunker et al. (Reference Schunker, Braun, Birch, Burston and Gizon2016). The results presented in this paper can be fully reproduced following Section 3 and Section 4. Digital data is available through private communication with the authors.
Acknowledgement
We acknowledge the Awabakal people, the traditional custodians of the unceded land on which this research was undertaken. Observations courtesy of NASA/SDO and the HMI science teams.
Funding statement
The HEARs data were originally processed at the German Data Center for SDO, funded by the German Aerospace Center under grant DLR 50OL1701. HS is the recipient of an Australian Research Council Future Fellowship Award (project number FT220100330) and this research is partially funded by this grant from the Australian Government.
Competing interests
None.
Appendix A. NOAA active region numbers with associated pre-emergence bipoles
As described in Schunker et al. (Reference Schunker, Braun, Birch, Burston and Gizon2016), we assigned a number, P, to indicate the amount of pre-emergence flux (see Tables A.1 and B.1 in Appendix A and Appendix B) based on a visual inspection of the mapped magnetograms. A P-factor of 0 represents an emergence into a very quiet region; a P-factor of 1 or 2 indicates emergence into increasing amounts of magnetic field nearby (but not directly at) the subsequent emergence location; and a P-factor of 3 or higher indicates the region may be compromised by pre-existing field at the emergence time and location. These were all evaluated by inspection of the line-of-sight magnetic field maps, and does not appear to correlate with the existence of pre-emergence bipoles.
Emerging active regions with associated pre-emergence bipoles and their associated control region tracking locations and emergence time (adapted from Table A.1. in each of Schunker et al. Reference Schunker, Braun, Birch, Burston and Gizon2016, Reference Schunker, Birch, Cameron, Braun, Gizon and Burston2019).

The left panel of the table lists the NOAA active region number, emergence time, Carrington latitude, Carrington longitude, central meridian distance (CMD) at the time of emergence and the P-factor. Columns 7 and 8 list the emergence time and Carrington longitude of the control region. The last two columns list the difference in B-angle, $\Delta B = B0\mathrm{(CR)} - B0\mathrm{(EAR)}$
, and the rounded difference in days
$\Delta B = B0\mathrm{(CR)} - B0\mathrm{(EAR)}$
, and the rounded difference in days $\Delta T=t_0(\mathrm{CR}) - t_0(\mathrm{EAR})$
.
$\Delta T=t_0(\mathrm{CR}) - t_0(\mathrm{EAR})$
.
*Active regions with a maximum flux larger than the median of the entire HEARS.
Appendix B. NOAA active region numbers without associated pre-emergence bipoles
Emerging active region and control region tracking locations and emergence time (adapted from Table A.1. in each of Schunker et al. Reference Schunker, Braun, Birch, Burston and Gizon2016, Reference Schunker, Birch, Cameron, Braun, Gizon and Burston2019).

The left panel of the table lists the NOAA active region number, emergence time, Carrington latitude, Carrington longitude, central meridian distance (CMD) at the time of emergence and the P-factor. Columns 7 and 8 list the emergence time and Carrington longitude of the control region. The last two columns list the difference in B-angle, $\Delta B = B0\mathrm{(CR)} - B0\mathrm{(EAR)}$
, and the rounded difference in days
$\Delta B = B0\mathrm{(CR)} - B0\mathrm{(EAR)}$
, and the rounded difference in days $\Delta T=t_0(\mathrm{CR}) - t_0(\mathrm{EAR})$
.
$\Delta T=t_0(\mathrm{CR}) - t_0(\mathrm{EAR})$
.
*Active regions with a maximum flux larger than the median of the entire HEARS.
Appendix C. Averaged flow maps of control regions for both samples
Averaged divergence flow maps of the control regions associated with pre-emergence bipole regions. Blue represents converging flows and red represents diverging flows. The arrows indicate the direction and magnitude of the flows. Solid (dashed) black lines contour the $-20$
G (
$-20$
G ( $+20$
G) of the averaged line-of-sight magnetic field maps. There are no significant flows.
$+20$
G) of the averaged line-of-sight magnetic field maps. There are no significant flows.

Averaged divergence flow maps of the control regions associated with active regions without pre-emergence bipoles. Blue represents converging flows and red represents diverging flows. The arrows indicate the direction and magnitude of the flows. There is a diverging flow at the centre of the map near the artificial emergence time, however, neither the size nor magnitude is significantly different than other surrounding regions. We note that most of the Sun’s surface consists of supergranulation cells of diverging flows, and so this is statistically not unexpected.


 Open access