

Taxpayer morale will be raised … not by a view of the government as a remote and impersonal bureaucracy dedicated to the interests of the favored few but by an insight into it as an available and sympathetic servant of the ordinary citizen.
(George F. Break and Ralph Turvey, “Studies in Greek Taxation,” Athens, 1964, p. 205)
In 1963, George F. Break and Ralph Turvey, two respected economists from UC Berkeley and the LSE, respectively, spent a visit of a few weeks at the Centre for Planning and Economic Research in Athens.Footnote 1 The Centre (known by its acronym, KEPE) was a brand-new technocratic structure created by the Greek government to support the modernization of economic policy making under indicative planning.Footnote 2 Break and Turvey were commissioned to do a critical survey of the country’s tax system, which had been reformed a few years earlier with the introduction of modern income and corporate taxation. Their reportFootnote 3 emphasized tax resistance by households and businesses as the main challenge faced by Greek authorities. While poor tax compliance was a common problem in low and middle-low income economies, Break and Turvey observed, some specific characteristics of Greek taxation—especially the uneven distribution of the tax burden and the excessive discretion of the fiscal bureaucracies—exacerbated taxpayers’ perception of the system and its administration as unfair. This, in turn, by undermining trust in authorities, tended to make the problem of tax morale worse.
In light of a recent scholarly literature on the fundamental role of trust building for successful tax reforms,Footnote 4 the analysis of Break and Turvey is extraordinarily enlightening. In the 1950s, Greek governments invested huge political resources in the modernization of tax legislation. Yet, their failure to raise tax capacityFootnote 5— especially the “capacity to levy direct taxes” that lies at the heart of successful governmentsFootnote 6—in line with the fast development of the economy soon became evident. By the mid-1970s, international observers noted that “the unsatisfactory composition of tax revenue […] deems to place Greece at a level of development not warranted by its figures for per capita income.”Footnote 7 Poor tax compliance of the business sector and liberal professions was unanimously regarded as one key determinant of this failure. Why did governments fail to seize the opportunity offered by the “Golden Age” of the Greek economy to make a breakthrough in the tax capacity of the state?
In line with recent studies that focus on the long-run co-evolution of political culture and political institutions,Footnote 8 we contend that the poor tax compliance of Greek businesses can be understood as the result of their historical interaction with tax authorities. For our interpretation, we draw on an extensive literature that identifies an endemic lack of trust in the state as a persistent feature of the Greek process of state building.Footnote 9 Its roots can be traced back to the early 19th century, when new bureaucratic infrastructures inspired by the Napoleonic tradition—which independent Greece inherited from earlier large-scale administrative reforms under Ottoman ruleFootnote 10—were superimposed on a political system largely built around patronage networks. Over time, the failure to create a professional and independent civil service organization led to “a general mistrust toward political-administrative institutions on behalf of society,” with a deficit of credibility and legitimacy that the pre- and post-WW2 experiences of authoritarianism and limited democracy were not able to redress.Footnote 11 In the long run, distrust in the state became a deeply ingrained cultural trait of the Greek population, clearly observable in its negative attitude toward taxation.Footnote 12 In this perspective, Greece provides a compelling case of “low compliance equilibrium” generated by a vicious circle between lack of trust and state inefficiency—dynamics also observable in the historical experience of other countries, such as Italy and Argentina.Footnote 13
Our paper contributes to this literature by looking for the first time in depth at the interaction between tax authorities and business in Greece in the second half of the 20th century. We focus on the personal income and corporate tax reforms of the 1950s and the reaction of entrepreneurs to changes in tax policy and enforcement until the late 1980s. Our first original contribution is methodological. Our analysis is framed into the “slippery slope” model proposed by Erich Kirchler and his co-authors. This approach, which combines insights from economics, psychology and other social sciences, focuses on the dynamic interaction between trust in authorities and different forms of tax power (legitimate versus coercive), its impact on different dimensions of compliance (enforced versus voluntary), and the resulting “tax climates” (antagonistic versus synergistic). The model predicts that, in an environment characterized by low initial trust, enforcement strategies exclusively based on coercion tend to antagonize taxpayers, crowd out voluntary compliance, and elicit negative reactions that lead to lower enforced compliance. Although the issue of trust plays a pivotal role in recent historical studies on tax resistance,Footnote 14 to our knowledge, our paper is the first attempt to use explicitly this framework for historical analysis.
An analytical narrative of the emergence and consolidation of an antagonistic tax climate between Greek business and authorities is the second original contribution of our paper. Entrepreneurs persistently perceived the exercise of power by tax authorities as unfair, arbitrary, and extractive. Governments’ initial attempts to combine coercive and legitimate power lacked credibility because they were not matched by any significant improvement in the perceived relationship of businesses with the administration. In contrast, the use of intimidating threats of coercive enforcement by the military junta (1967–74) marked a turning point in the slippery slope into an antagonistic tax climate. After the return to democracy, tax enforcement lost its most repressive features, but the coercive approach intensified in an adverse macroeconomic environment dominated by a permanent fiscal emergency. Our analysis of aggregate tax returns reveals that in this period real income reported by the business sector increasingly diverged from average and entrepreneurial income per capita. This evidence is fully consistent with the predictions of the slippery slope framework: Increased coercion led to declining tax compliance of the business sector, mainly in the form of systematic underreporting of income. With hindsight, the period of political and macroeconomic stability of the 1950s and early 1960s provided a unique opportunity to build a more cooperative tax climate between business and the state. This missed opportunity ultimately lies at the root of Greece’s failure to enhance business acceptance of modern income taxation and close the gap in income tax capacity with the rest of Europe over the 20th century.
Trust, Power and Business in the Slippery Slope Framework
The most recent literature sees tax compliance (defined as the full payment of all taxes due) as the joint outcome of economic and noneconomic motivations. The economic rationale (enforced compliance) is driven by a rational assessment of the costs and benefits of noncompliance, which in turn depends on the efficacy of deterrence through audits and fines. The noneconomic rationale (voluntary compliance) rests on behavioral factors (psychological circumstances, culture, social norms) usually conflated into the notion of “tax morale”—a catch-all concept that reflects individuals’ willingness to declare honestly their tax duties.Footnote 15 Among the key determinants of voluntary compliance, trust in the state has gained special prominence.Footnote 16 This form of vertical trust is also strongly related to institutional quality, including the transparency, impartiality, and reciprocity of the tax system—all elements that enhance taxpayers’ perception of “fairness” in the exercise of tax power.Footnote 17
The key insight of the slippery slope approach is that the level of taxpayers’ trust in the state and their perception of how tax authorities exercise power interact dynamically in shaping attitudes toward taxation.Footnote 18 In the model, the authorities can pursue compliance through different combinations of coercion (i.e., by heightening taxpayers’ perception of its potential to detect and prosecute noncompliance) and legitimate power (i.e., by enhancing taxpayers’ perception of a fair and transparent exercise of power through expertise in fighting tax offenses, the provision of information and supportive services, and the enhancement of taxpayers’ voice and participation). Although in theory maximum tax compliance can be achieved through either strategy, voluntary compliance is assumed to be superior because it requires a smaller administration, fewer controls, and a less antagonistic relationship with taxpayers.
In the model, the dynamic combination of power and trust leads to different equilibrium solutions.Footnote 19 A systematic use of legitimate power enhances mutual trust and respect, leading to a synergistic climate in which taxpayers feel committed to the tax system.Footnote 20 A purely coercive approach, on the contrary, can be perceived as a signal of distrust, alienate honest taxpayers, and decrease the overall level of trust in the authorities, thus leading to lower voluntary compliance. If coercion fails to produce clear efficiency gains in the detection and punishment of tax frauds, honest taxpayers remain unrewarded and exposed to exploitation by freeriders. In this case, the outcome is a downward spiral into an “antagonistic” tax climate, where the interaction between taxpayers and tax authorities becomes “cops and robbers,” voluntary compliance is low and tax capacity rests exclusively on enforced compliance. The latter is expected to increase with the perceived power of authorities—for instance, the perceived probability of being audited or the perceived severity of sanctions. Deterrence, however, may have little effect if it lacks credibility. In turn, even credible deterrence might backfire if it makes taxpayers feel stigmatized or restricted. Coercion also requires an intensification of face-to-face interactions with tax officials, which can multiply the opportunities for corruption, harassment, and predation in a poor institutional environment.Footnote 21 In this case taxpayers can perceive noncompliance as a legitimate strategy of defense and a way to gain back their freedom.Footnote 22
This analytical framework applies especially well to businesses. Firms operate under the same cultural norms that influence individuals’ tax morale. In addition, their compliance decisions are critically affected by the extent to which the overall taxation process is perceived as a resource-consuming obstacle to doing business.Footnote 23 Entrepreneurs are more willing to pay if a fair system allows them to predict with certainty their tax liabilities, which enhances business planning and investment. Acceptance of taxes is easier if they are supported by neutral procedures and tax enforcement is perceived as neither arbitrary nor abusive—for instance, officials have limited scope for a subjective assessment of tax liabilities, penalties for noncompliance are equitably and consistently administered, and firms have access to fair and efficient recourse procedures if they feel abused.Footnote 24 Empirical studies confirm that this fairness dimension of tax morale, specific to business, strongly correlates with measures of trust in the government.Footnote 25 In turn, voluntary compliance is enhanced if owners and managers perceive that tax enforcement does not selectively target (or ignore) certain classes of businesses (a violation of horizontal equity) and efforts to collect taxes are consistent across firms of different sizes and operating in different sectors (vertical equity).
On the contrary, an unfair and unequal coercive system is bound to meet business resistance and depress tax compliance.Footnote 26 There exists strong evidence that entrepreneurs hold a more acute tax awareness as they pay taxes “out of their pockets” (unlike employees, whose tax liabilities are generally withheld at the source). They also tend to perceive taxation as a loss of freedom in personal finances and investment decisions. Studies on entrepreneurs’ “reactance” find that their mental representations tend to associate taxation with concepts such as constraints, disincentives, and punishment. They also attest more power to tax authorities and perceive noncompliance as a legitimate strategy to reestablish competence and autonomy.Footnote 27 In this case, deterrence is more likely to induce resentment and crowd out intrinsic motivations to pay taxes.Footnote 28 As a consequence, entrepreneurs and authorities are more likely to get trapped into an antagonistic relationship and a credible investment in trust building is essential in order to win over business’ tax resistance.
Greek Business’s Resistance to Income Taxation: The Legacy of the Past
The slippery slope framework is especially suitable for historical analysis. Trust (or the lack of it) is built and transmitted over time through the experiences of different generations. For this reason, a country’s history and its impact on the initial conditions at the moment of reforms have a paramount influence on their success or failure.Footnote 29 Past investment in fiscal capacity may affect indirectly the ability of governments to raise taxes through their impact on individual values and social norms.Footnote 30 If taxpayers use the past record of tax compliance to form their expectations, reforms can be less effective in societies with a long history of poor compliance.Footnote 31 Just as past successes can have long-run benefits, past failures can be difficult to correct.Footnote 32 Over time, social norms act as a propagation mechanism that perpetuates cross-country differences by ingraining the society’s attitudes toward taxes. Thus, the past might act as a major source of persistence, making the success of reforms more difficult.
On this ground, postwar Greek policymakers inherited a troubled legacy. During the interwar period, the principles of “mass taxation” of personal income based on universal tax liability and progressivity were enforced in high income countries, especially under the pressure of war mobilizations.Footnote 33 In this process, corporations were increasingly perceived as taxable entities separated from their shareholders. The corporate tax created a withholding mechanism that enhanced a more effective taxation of capital at the source as a necessary complement of personal income taxation.Footnote 34 Wars also reinforced the legitimacy of a separate taxation of corporations to ensure their proper contribution to postwar recovery.Footnote 35
Early Greek reformers had joined this international trend in 1919, under the pressure of mobilization for the Greco–Turkish War, by transplanting the key features of the French model of income taxation established few years earlier.Footnote 36 The reform combined a schedular system based on flat rates on different income categories (slightly more favorable to labor than to industrial and commercial activities) with a mildly progressive general income tax on total net income, targeting high income earners.Footnote 37 The new system discriminated unincorporated business with respect to domestic joint-stock companies, which were subjected only to a flat tax on distributed profits (dividends and interests) but totally exempted from the progressive general tax. This differential treatment led to a massive incorporation of a high number of family-owned industrial and commercial enterprises. The government’s attempt to impose discriminatory legislation on firms incorporated after 1926 elicited massive protests by entrepreneurial organizations.Footnote 38
The result was a generalized resistance to income taxation by the business sector. Far from being a Greek peculiarity, this was an international phenomenon. Since the early debates on its introduction in the United Kingdom and France, its opponents expressed concerns about the “inquisitorial” and “vexatious” nature of the procedures required by its enforcement.Footnote 39 In France, its legitimacy was repeatedly questioned by entrepreneurs, merchants, and artisans between the wars and after WW2.Footnote 40 In a middle-low income country such as Greece, the structure of the economy—with a very large share of self-employed and small enterprises; low quality information on income, production, transactions, and property; and poor accounting and bookkeeping standards—facilitated business resistance. Moreover, reforms were implemented in a period of extreme political instability and permanent fiscal emergency, which further complicated their legitimization.Footnote 41
In fact, a system of tax collection and certification based on auditable tax returns and a legal framework for the resolution of tax disputes was gradually built only after 1927 under the governments of the Second Hellenic Republic (1924–35).Footnote 42 However, checks proved virtually impossible in most cases, due to very poor bookkeeping records even in relatively large firms and the strict application of banking secrecy. As a consequence, in 1930 the government switched to a presumptive system of income assessment, based on the application of predetermined profit coefficients to the estimated total volume of sales. At the same time, the flat tax on industrial and commercial profits was de facto abolished for the vast majority of small and medium enterprises and replaced with a license tax (impôt de patente), while the assessment of taxable net income was entrusted to mixed committees of representatives of the tax administration and business organizations.Footnote 43 Although the presumptive approach minimized audits and reduced the opportunities for disputes, the system was constantly challenged by industrial and commercial interests, who insisted on limiting the right of inspecting books. At the same time, the adoption of stricter accounting requirements and more severe legal sanctions had limited effects on the widespread practice of double bookkeeping. The general progressive tax on high incomes generated meager revenues in the 1930s, due to the exemption of incorporated firms, the low income reported by the vast majority of industrial and commercial activities, and the generous treatment of income from financial assets.Footnote 44 Overall, the reforms had a negligible effect on tax capacity: At the end of the 1930s, the tax-to-GDP ratio remained well below 20 percent, and indirect taxes still accounted for 70 percent of total tax revenues.Footnote 45
The Design of Income Tax Reforms of the 1950s
The failure of prewar experiments with income taxation explains why the reforms of the second half of the 1950s are considered a major turning point in the fiscal history of the country. The 1950s were a period of political stabilization, partial democratization (with significant restrictions on political and civil rights and extensive purges of left-wing supporters from the state administration) and a favorable macroeconomic environment, sustained economic growth, low inflation, and high returns to capital accumulation.Footnote 46 In this framework, governments—led by the conservative National Radical Union (1955–63) and the liberal Center Union (1963–65)—pursued the reform of the public administration and the modernization of economic policy making, with the introduction of modern national accounting and the adoption of indicative planning inspired by the French model.Footnote 47
The tax reforms were therefore an essential part of an ambitious technocratic plan of economic modernization. They coincided chronologically with the reform of income and corporate taxation in FranceFootnote 48 but preceded other middle-low income countries in southern Europe, where similar reforms had to wait until the mid-1970s (Italy, Spain) or the late 1980s (Portugal). Their most important and durable achievement was a comprehensive reform of direct taxation and the integration of personal and corporate taxation to limit over- or underassessment of different types of income: “in this respect”—Break and Turvey noted—"the Greek tax system has much to be commended.”Footnote 49
The 1955 reform of personal income taxation, which affected nonincorporated businesses, introduced a single tax scale applied to total income, plus a flat tax on unearned income (interests and dividends) for equity purposes. This simplified the tax process and reduced compliance costs compared to the prewar system.Footnote 50 Nominally, the tax scale was quite progressive, with marginal rates increasing from 3% to 60%. The top rate was the same as in France and in line with other European countries,Footnote 51 although rates on upper income brackets were slightly higher in comparative terms.Footnote 52 However, as Break and Turvey noted, “few income recipients … face[d] effective tax rates that would be considered high in most developed countries,” also thanks to exemptions and allowances.Footnote 53 According to their calculations, 75 percent of taxpayers paid less than 5 percent of their reported income; only the top 10 percent was subject to effective rates in excess of 10 percent, which escalated above 50 percent for a tiny minority of super-rich. As a consequence, the system lost most of its progressivity—in fact, effective tax rates were low for the vast majority of taxpayers and roughly proportional to the income of most households, as in a flat-tax system.Footnote 54
A narrow tax base undermined its revenue potential. Households below a minimum income threshold (periodically increased) were totally exempted and reductions for wage earners and family allowances became more generous over time. In the late 1950s and early 1960s, the government also reduced tax rates for low and middle income households, hoping that a lighter tax burden would improve compliance.Footnote 55 More importantly, any income from agricultural activities—which in the mid-1950s still represented more than 30 percent of the national income and employed 60 percent of the labor force—remained virtually exempted until the late 1980s.Footnote 56 Although in all European countries agricultural income benefited from preferential treatment, the generosity of the Greek system was rather unique. It dated back to the late 19th century, when tax exemptions were systematically used by competing political factions to win the electoral support of the rural population.Footnote 57 The process culminated in the interwar period, when a land tax levied on all crops (with the exception of tobacco) was suspended as part of an agricultural debt relief package in favor of smallholders.Footnote 58 Moreover, the 1955 reform introduced a surcharge tax (deductible from taxable income), whose revenues contributed—together with a variety of additional indirect taxes on consumption—to the funding of a social insurance scheme for tax-exempted farmers and agricultural workers. This implied a substantial redistribution from urban to rural population and could enhance perceptions of horizontal inequity among industrial and commercial entrepreneurs.
The modernization of direct taxes was completed in 1958 with the introduction of a corporate tax on all Greek and foreign-owned incorporated firms.Footnote 59 It set a 35 percent statutory flat rate on retained profits, plus a deductible 15 percent surcharge to fund farmers’ social security, for an estimated overall tax rate of 38 percent—a relatively low rate compared to other European countries.Footnote 60 In turn, profits distributed in the form of dividends and allowances to directors and managers were not taxed at firm level. This choice was rather unique among industrial countries, where double taxation (under different systems) was the rule.Footnote 61 By renouncing to tax dividends and interests at the source, the Greek system avoided any double taxation of shareholders and bondholders, who remained subjected only to the flat surtax on personal unearned income. This of course implied a lower revenue capacity of corporate taxation and possibly of the overall integrated system if dividends and interest could easily escape the personal income tax.
The impact of the corporate tax on revenues was also muted by an extensive system of tax holidays, investment allowances (i.e., deduction of investment from taxable undistributed profits) and accelerated depreciation rates, which reduced the tax base.Footnote 62 This was a common feature both in advanced and developing economies, where “micro-manipulations of the tax code” were widely used to influence firms’ investment decisions.Footnote 63 In poor institutional environments, however, the proliferation of preferential schemes created significant opportunity for discretion and abuse and was more likely to harm horizontal equity and increase the perception of unfairness.Footnote 64 In fact, a specific characteristic of the Greek system was the extreme number and variety of incentive schemes applied to different businesses to stimulate private investment and attract foreign capital.Footnote 65 For instance, newly established foreign-owned firms were guaranteed an unchanged tax regime over a period of time and total exemption from custom duties on imported capital goods. Tax facilities were soon extended to new, merged or expanding domestic firms.Footnote 66 Shipping—a sector of special relevance for the Greek economy since the interwar periodFootnote 67—enjoyed a special tax regime close to full exemption, with the hope of reducing the share of the merchant fleet registered abroad, which depressed the inflow of invisible earnings.Footnote 68 Its effect was not negligible (the share of ships under “flags of convenience” over the total gross tonnage of the Greek-owned merchant fleet fell from 75 percent in 1950 to 60 percent in 1970)Footnote 69 but below expectations, with a modest impact on the balance of payments.Footnote 70 Finally, tax facilities were granted to firms located outside the Attica region, with the aim of enhancing (jointly with administrative controls) the geographical dispersion of industrial activities away from the heavily congested Athens’ metropolitan area—where 30 percent of the active population and 31 percent of the employment in the manufacturing sector (including handicraft) were concentrated—and promoting the economic development of peripheral regions.Footnote 71
Similar problems affected the turnover tax. Designed as a modern multistage tax on firms’ revenues net of purchases of taxed intermediate inputs, it avoided the typical cascading effects (with tax accumulating as products move from production to final sale) and was equivalent to a tax on the value of output at wholesale.Footnote 72 However, tax rates and exemptions discriminated hugely between favored (“nonstandardized”) and nonfavored sectors, turning a simple tax into an overly complex one, imposed on a minority (ca 3,000 in 1961) of relatively large firms, while the vast majority of the rest (ca. 24,000) remained totally exempted.Footnote 73 As already noted by Break and Turvey in the mid-1960s, the extensive use of discretionary exemptions and incentives in direct and indirect taxation of businesses not only led to large revenue losses but also increased the opaqueness of the system, enhanced rent seeking and unfair competition, and heightened the perception of the system as unfair and unequal, with negative consequences on tax morale.Footnote 74
Trust and Tax Enforcement: Business Voices
In this section, we use business “voices” to capture the evolution of entrepreneurs’ sentiment about the exercise of tax power around the time of the approval and implementation of the reforms of the 1950s. For this purpose, our most important source of information is the Viomichaniki Epitheorissis (The Industrial Review), a very influential business magazine, established in the interwar period and considered still today the most entrepreneurship-focused publication in the country.Footnote 75 We also consulted the most representative daily press of the period, including the economic and financial newspapers I Naftemporiki (established in 1924 and still today the most widely read business newspaper) and O Economicos Tahidromos (established in 1926), among others.Footnote 76 Finally, we used publications of business organizations, such as the Bulletin of the Chamber of Commerce and Industry of Athens, the Bulletin of the Federation of Greek Industrialists, and the Forologiki Epitheorisis (The Tax Review), a specialist magazine that provided a forum for discussion for tax professionals and members of the tax administration.
The voices recorded in our sources convey the sense of a profound lack of trust of businesses in tax authorities. The main complaints focused not on the design of the reforms or the level of the tax burden but on the enforcement of tax laws, the lack of integrity in the tax administration and the excessive discretion enjoyed by tax auditors in the assessment of accounting books. It has to be said that this was partly a consequence of the poor accounting and bookkeeping standards still prevailing in the majority of small and medium commercial and industrial enterprises, which obliged auditors to estimate profits on the base of the business volume.Footnote 77 However, the general perception was that audits too often drifted into informal tax bargaining,Footnote 78 which led to recurrent accusations of arbitrarinessFootnote 79 and self-interest.Footnote 80 A press article denounced in 1962:
Even for the slightest reason, the accounting books of merchants and industrialists get rejected […] Instead of a tax of, say, DRS 10,000, the tax auditor, through the rejection of the books, imposes a flat tax of DRS 100,000, and then asks the owner of the firm to compromise […] The cut of tax rates has no effect when, through another door, by classifying the tax payer to a higher tax bracket than the one he really belongs, the State oppresses the taxpayer and exerts over-taxation.Footnote 81
The following vivid description of what business owners perceived as an “extractive” attitude of tax authorities was published in the same year:
The prevailing atmosphere in the office of the director of the tax service [resembles that of] paying a ransom. The director reads the report [of the tax auditor], writes something down and then, turning to the taxpayer, says ‘I will reduce it by 40%’. If the taxpayer insists, as I did, he might achieve an even greater reduction. Ordinary people know that they are right, but, not wanting to get involved in tax fights with the State, eventually give in. It is sad to see how the State has ended up making tax officials negotiating for a ransom from the taxpayers.Footnote 82
The lack of a fair and efficient mechanism to settle tax disputesFootnote 83 magnified the perception of systematic arbitrariness and abuse:
If I take legal actions, would it ever be possible for me to expect any further gain, especially from a second instance court chaired by a…[judge] with no knowledge of tax matters and an economic inspector who is undoubtedly a mouthpiece, if not an extension, of the inclinations and the aims of the tax officer?Footnote 84
Entrepreneurs felt that excessive discretion in tax interpretation and enforcement increased compliance costsFootnote 85 while recurrent disputes on the application of investment allowances generated a permanent uncertainty about their tax liabilities. As the president of the Chamber of Commerce and Industry of Heraclion denounced at a national congress in 1964:
The benefits stemming from the laws on tax incentives should be of a permanent nature, without being subject to cancellation or depending on tax auditors’ judgement about the sincerity of accounting books.Footnote 86
In all evidence, the reforms of the 1950s failed to improve business’ perception of the tax system. Yet, Greek reformers, well aware of the generalized lack of trust in the tax administration, made some efforts toward a more extensive use of legitimate power in the implementation of the new legislation. To that aim, the government publicly committed to rationalize the tax organization and improve its efficiency in detecting frauds,Footnote 87 promoted the professional training of tax officers, recommended directors of tax offices “leniency” in the application of the reformsFootnote 88 and promised that cases of corruption involving tax officers would be given priority in the courts.Footnote 89 It also announced “a series of measures in favor of taxpayers,” including limits on tax inspectors’ discretion on the rejection of accounting books (excluding cases of tax fraud) and the possibility to resubmit incomplete tax returns.Footnote 90 Finally, directors of tax offices received a set of directives on tax disputes that aimed at setting limits to their discretion.Footnote 91
The actual impact of those initiatives is hard to assess, however. There was also some ambiguity in enforcement strategies, which possibly undermined their credibility. For instance, as early as 1957 the government pushed in the parliament a draft bill that extended the discretionary power of tax inspectors and converted tax evasion into a criminal offense.Footnote 92 The proposed legislation met business’ fierce opposition—it was denounced in the press as “a kind of Holy Inquisition aiming to verify tax conscience”—and was precipitously withdrawn.Footnote 93 Overall, entrepreneurs’ perceptions continued to be dominated by the self-interest and unconstrained discretion of bureaucracies. This was clearly expressed at the national congress of the Greek Chambers of Commerce in 1964:
We are all aware of the … orders of the Ministry of the Economy requesting tax officers to cultivate a spirit of cooperation and understanding with taxpayers. But […] who doesn’t know the abuses and very often the blackmailing by tax officers, which creates a climate of permanent dispute? And how could there be no such abuses… when the promotion of tax officers depends, on one hand, on the number of accounting books they reject and on the other hand […] [tax officers] will never be subject to any sanction for any kind of abuse, no matter how great, when determining the taxable income?Footnote 94
These voices strongly suggest that government’s failure to reform the tax administration and limit its scope for discretion was the main cause of business resistance to the reforms. As Break and Turvey also noted in the mid-1960s, the tax bureaucracy suffered from a structural lack of qualified officials, poor training, inefficient organization, and a limited capacity to process a fast-rising volume of declarations.Footnote 95 In fact, these were generalized features of a public administration largely affected by practices of nepotism and political patronage, as also emphasized by coeval studies that the government commissioned to independent experts.Footnote 96
The unequal enforcement of taxation across the business sector was another consequence of administrative and organizational weaknesses. An important innovation of this period was a better integration of personal and corporate taxation with the turnover tax. The establishment of a mechanized clearing center allowed income tax auditors to detect underdeclared profits by cross-checking information on wholesale purchases from suppliers extracted from turnover tax records.Footnote 97 In principle, the use of third-party information represented an important element of modernization. However, due to binding constraints on the ability to process this information, audits targeted only firms whose declared taxable profits as a percentage of turnover were implausibly low (especially those with reported profits below the exemption limit), firms with profits in excess to a given thresholdFootnote 98 and firms “whose tax morality [was] suspect”—a statement that suggests the persistence of a wide margin of discretion. Moreover, since the vast majority of small businesses were exempted from the turnover tax, cross-checks affected only a minority of large firms, with little impact on tax evasion but possibly a significant negative impact on perceived fairness and horizontal equity.Footnote 99 Combined with partial exemptions and allowances in favor of “special” businesses, the modernization of tax enforcement paradoxically tended to reinforce the perception that reforms had led in fact to an “oppressive levy designed only for the unfavored few.”Footnote 100
Cops and Robbers: Slipping into an Antagonistic Tax Climate
In this section, we use the slippery slope framework to build an analytical narrative of the interaction between changes in tax policy and enforcement by the tax authorities and business’ perceptions of the exercise of tax power. The analysis covers three different executives: the military junta (1967–74), the center-right governments of New Democracy (1974–1981), and the socialist governments led by PASOK (1981–88). In the absence of information on actual controls (for instance, audit rates), our assessment of enforcement relies exclusively on variations in legislation, regulation and instrumentation, such as changes in the approach to criminalization of tax offensesFootnote 101 and changes in the severity of penalties, as well as procedural and organizational innovations to counter tax evasion.Footnote 102
Under the military regime, fiscal policy combined generalized tax cutsFootnote 103 with a major shift in the use of coercive threats in tax enforcement. A few months after the coup of April 1967, a new legislation allowed the criminal prosecution of accounting inaccuracies and bribery of tax officials, with severe penal and administrative sanctions administered by military courts.Footnote 104 This extreme approach was instrumental to the fiscal policy objectives of the 1968–72 Economic Development Plan, which relied on a significant reduction in tax evasion to meet its ambitious (and hardly realistic) revenue targets.Footnote 105 The switch to a heavy hand on tax enforcement was also presented as part of a program of modernization of the state administration and fight against corruption, wrapped in a bold rhetoric of patriotism and nationalistic fervor. The consensus view, however, is that the abrupt changes in administrative norms and practices introduced by the junta and its permanent intimidation of civil servants, far from achieving the desired “catharsis of the administrative machinery,” alienated the bureaucracy from the regime and marginalized the expertise of civil technocrats in the formulation of policies.Footnote 106 A telling example was the decision to dismantle as politically disloyal a large part of the technocratic apparatus in the Ministry of the Economy that had designed the tax reforms and supported their enforcement.Footnote 107
Whether this public stance on tax enforcement translated into more systematic and thorough audits or just into more arbitrary controls is hard to say. As the pressure of censorship subsided in the final years of the regime, however, qualified representatives of tax authorities publicly denounced how the junta had failed to pursue measures that would have improved the transparency of the system and contribute to taxpayers’ trust—among them, a rationalization and simplification of an often contradictory tax code (which increased the probability of accounting inaccuracies)Footnote 108 or a clear regulation of tax audits.Footnote 109 In turn, the Federation of Greek Industries complained about the lack of a clear differentiation between tax evasion and tax avoidance and the arbitrary criminalization of “perfectly reputable” companies with “an excellent tax-paying record.”Footnote 110 Overall, the military regime marked a turning point in the emergence of the cops-and-robbers logic of an antagonistic tax climate.
The return to democracy in 1974 ushered in a rising demand for social spending, which had lagged behind the OECD average under previous governments (both democratic and autocratic) and more generally for an expansion of the role of the state in the economy through nationalizations and subsidies.Footnote 111 Democratization, however, also coincided with the emergence of an adverse macroeconomic environment, characterized by high inflation and (after 1980) declining growth. In a situation of permanent fiscal emergency,Footnote 112 tax pressure on business escalated as governments of different ideological orientation strove to reduce a structural revenue shortfall.
Pressed by a large budget deficit inherited from the military junta, center-right governments passed an emergency tax package that included a nonrecurring 10 percent to 20 percent surcharge on high personal income and corporate profits, deductible from future tax liabilities.Footnote 113 Later on, the executives pursued a stronger progressivity by raising tax rates for upper income brackets while increasing tax exemptions and allowances for wage income. In corporate taxation, they increased the rate on retained profits to 40 percent (35 for companies quoted in the stock exchange) and—in line with a general trend in Europe—expanded the tax base by reducing some incentives for privileged sectors (shipping included).Footnote 114 While the new level of the statutory rate remained below the European average,Footnote 115 an additional burden was imposed on corporations in the form of extraordinary contributions (10 percent of outstanding large credit and loans, or an equivalent tax on profits)Footnote 116 and a 10 percent to 20 percent capital levy on the increased book value of their land and buildings. Finally, the rate of the general turnover tax was also raised and some of its exemptions reduced or discontinued.Footnote 117 All these measures raised vibrant protest from entrepreneurial organizations for pushing firms to their “ultimate limit of […] taxpaying capacity.”Footnote 118
In this period, enforcement strategies lost the intimidating and repressive features of the military regime. At the same time, governments raised the penalties for tax offenses and introduced innovations that raised concerns and protests in the business sector. Criminal prosecution was limited to fraudulent tax infringements, while the tax code was revised to impose tougher fines on evaders.Footnote 119 In turn, a presumptive system based on external signs of wealth (e.g., cars, boats, yachts, housing rents), which until then had been used informally by the tax administration,Footnote 120 was officially reintroduced in 1978.Footnote 121 The turn of the screw, welcomed by international observers as “the beginning of a systematic approach to the serious problem of tax evasion,”Footnote 122 included also new unconventional instruments, such as the creation of specialized task-forces against tax frauds. These were denounced in the business press as “commando-like” squadrons of a “tax hunting” police entrusted with “excessive powers” (for instance, to reject accounting books on a fast-track basis) and trying to intimidate taxpayers with “unprecedented penalties and fines.”Footnote 123 On one hand, this procedural and organizational innovations admitted the chronic failure of the tax administration to fight noncompliance, weakened also by a strict application of bank secrecy that prevented systematic third-party checks. On the other hand, they strained further the relationships with the business sector. The Chamber of Commerce and Industry of Athens complained that the new strategy “handed the taxpayer over to the uncontrollable judgment” of “overzealous” directors of tax offices,Footnote 124 whose remuneration was officially linked in 1976 to the amount of revenues collected.Footnote 125 In turn, government’s promises to reduce firms’ compliance costs (through a simplification of the accounting records to be submitted to tax authorities) and to enhance a “fast resolution” of tax disputes were received with skepticism by entrepreneurs, who saw them as just another way of preserving a high level of arbitrariness that “sabotaged” business plans and tax compliance.Footnote 126 In 1979, a “Disincentives Committee,” coordinated by the Bank of Greece with the participation of entrepreneurial organizations, placed the tax system in a prominent position among the most serious obstacles to business initiative and industrial development.Footnote 127
The tax policies of the socialist governments (1981–88) followed similar paths. With a rising budget deficit, they widened the taxable base and raised tax rates, with some relief for lower-wage income earners. They also imposed a new tax on the overvalue of land and buildings owned by large companies, increased further the statutory rate on retained profits (from 40 percent to 45 percent) and the turnover tax rates, while at the same time approving new tax incentives for investment.Footnote 128 In a similar way, the austerity plan of 1986–87 included a one-time surcharge on corporate profits and income from property and self-employment and a generalized increase in corporate and property taxation.Footnote 129
In this framework, the government also put new pressure on the business sector by intensifying book audits, extending criminal prosecution to a wider set of tax offenses and in some case by publicizing the identity of firms under investigation.Footnote 130 This increasingly inquisitorial approach stressed government’s relationship also with tax officers’ unions, which publicly denounced the existing procedures for the assessment of firms’ taxable income as “endless … bureaucratic, difficult to explain, and incomprehensible.”Footnote 131 In turn, entrepreneurial organizations continued to complain publicly about the “disincentives” to business generated by the tax system, blamed emergency taxation for disrupting firms’ investment plans, denounced the unabated discretion and self-interest of book auditors and tax officers and accused the government of trying to intimidate taxpayers.Footnote 132 By the late 1980s, an antagonistic tax climate had become a permanent feature of the Greek society.
Down the Slippery Slope: Evidence from Tax Return Data
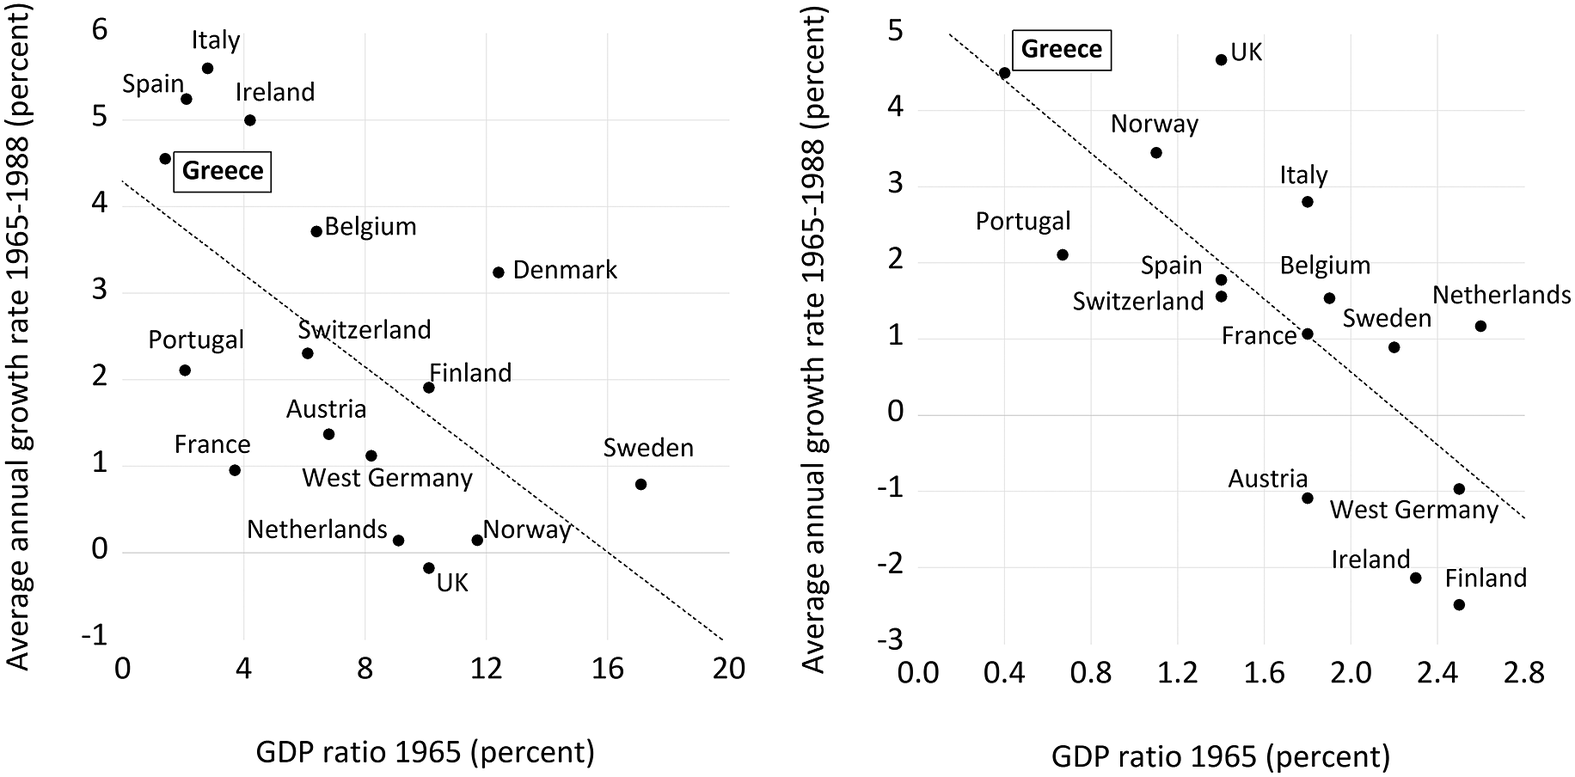
The reforms of the 1950s aimed at reducing the heavy dependence of tax revenue on regressive indirect taxation and rebalance its structure in favor of direct taxes, which would enhance a more equitable income distribution and a more effective macroeconomic management.Footnote 133 Thirty years later, it was clear that they had failed to achieve the desired objectives. The postwar period saw in Western Europe a convergence in the GDP ratio of income tax revenue, which increased faster where its initial level was lower. In fact, as shown in Figure 1, Greece—a country at the bottom of the European ranking in income tax capacity in 1965 (the first year for which comparable data are available for OECD countries)—recorded the highest average annual increase in revenue both from personal income taxation (with Italy, Spain, and Ireland) and corporate taxation (with the United Kingdom) until the late 1980s.
Income tax convergence in Western Europe, 1965–1988. This figure shows the relationship between the initial levels of the GDP ratio of revenue from personal and corporate income taxes and their average annual compounded growth rates in the period 1965-1988 in Greece and other 15 Western European countries (Austria, Belgium, Denmark, Finland, France, West Germany, Ireland, Italy, Netherlands, Norway, Portugal, Spain, Sweden, Switzerland and the UK). Source: OECD.Stat, Revenue Statistics, Comparative Tables (https://stats.oecd.org/index.aspx?DataSetCode=REV).
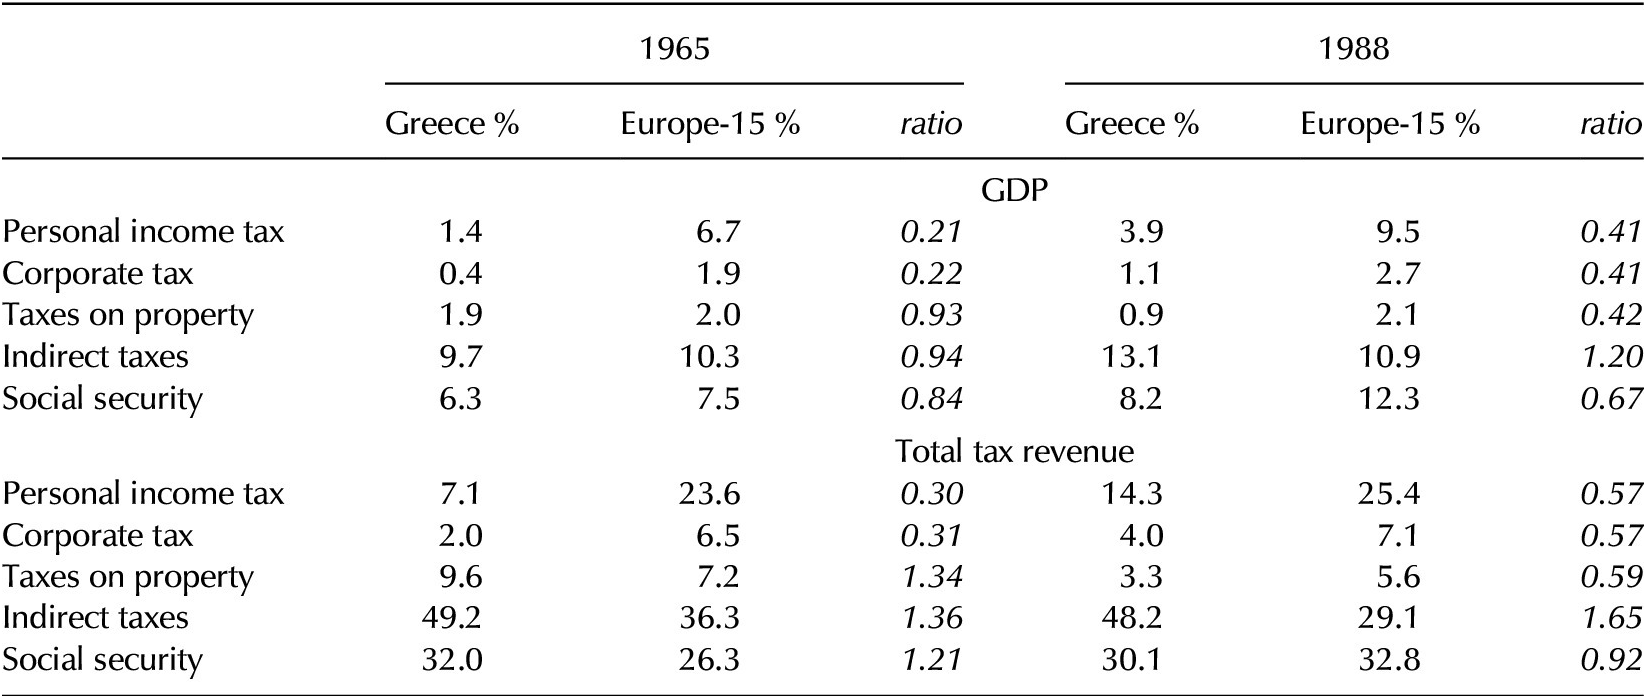
However, this relative catching up was insufficient to fill the initial gap. As shown in Table 1, in 1965 overall income taxes, as a share of GDP and of total tax revenues, were a fraction (21 and 30 percent, respectively) of the corresponding average in 15 Western European economies. A quarter of century later, in 1988, they had increased only to 41 and 57 percent. In contrast, capacity in indirect taxation, already in line with the European average at the start of the period, in the late 1980s was 20 and 65 percent higher than the European average in terms of GDP ratio and contribution to total revenue, respectively.
Tax revenue structure, 1965–1988. The European average is a weighted mean of 15 Western European countries (Austria, Belgium, Denmark, Finland, France, West Germany, Ireland, Italy, Netherlands, Norway, Portugal, Spain, Sweden, Switzerland and the UK). Country weights are based on the average share of total European GDP over the period. Source: OECD.Stat, Revenue Statistics, Comparative Tables (https://stats.oecd.org/index.aspx?DataSetCode=REV)
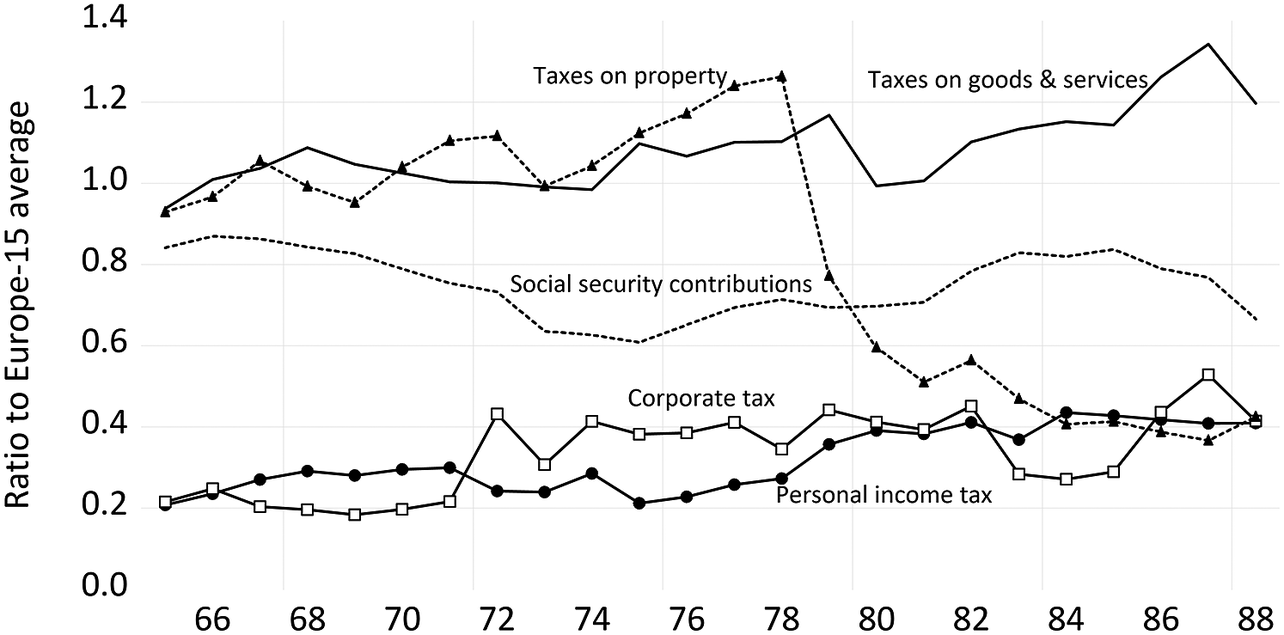
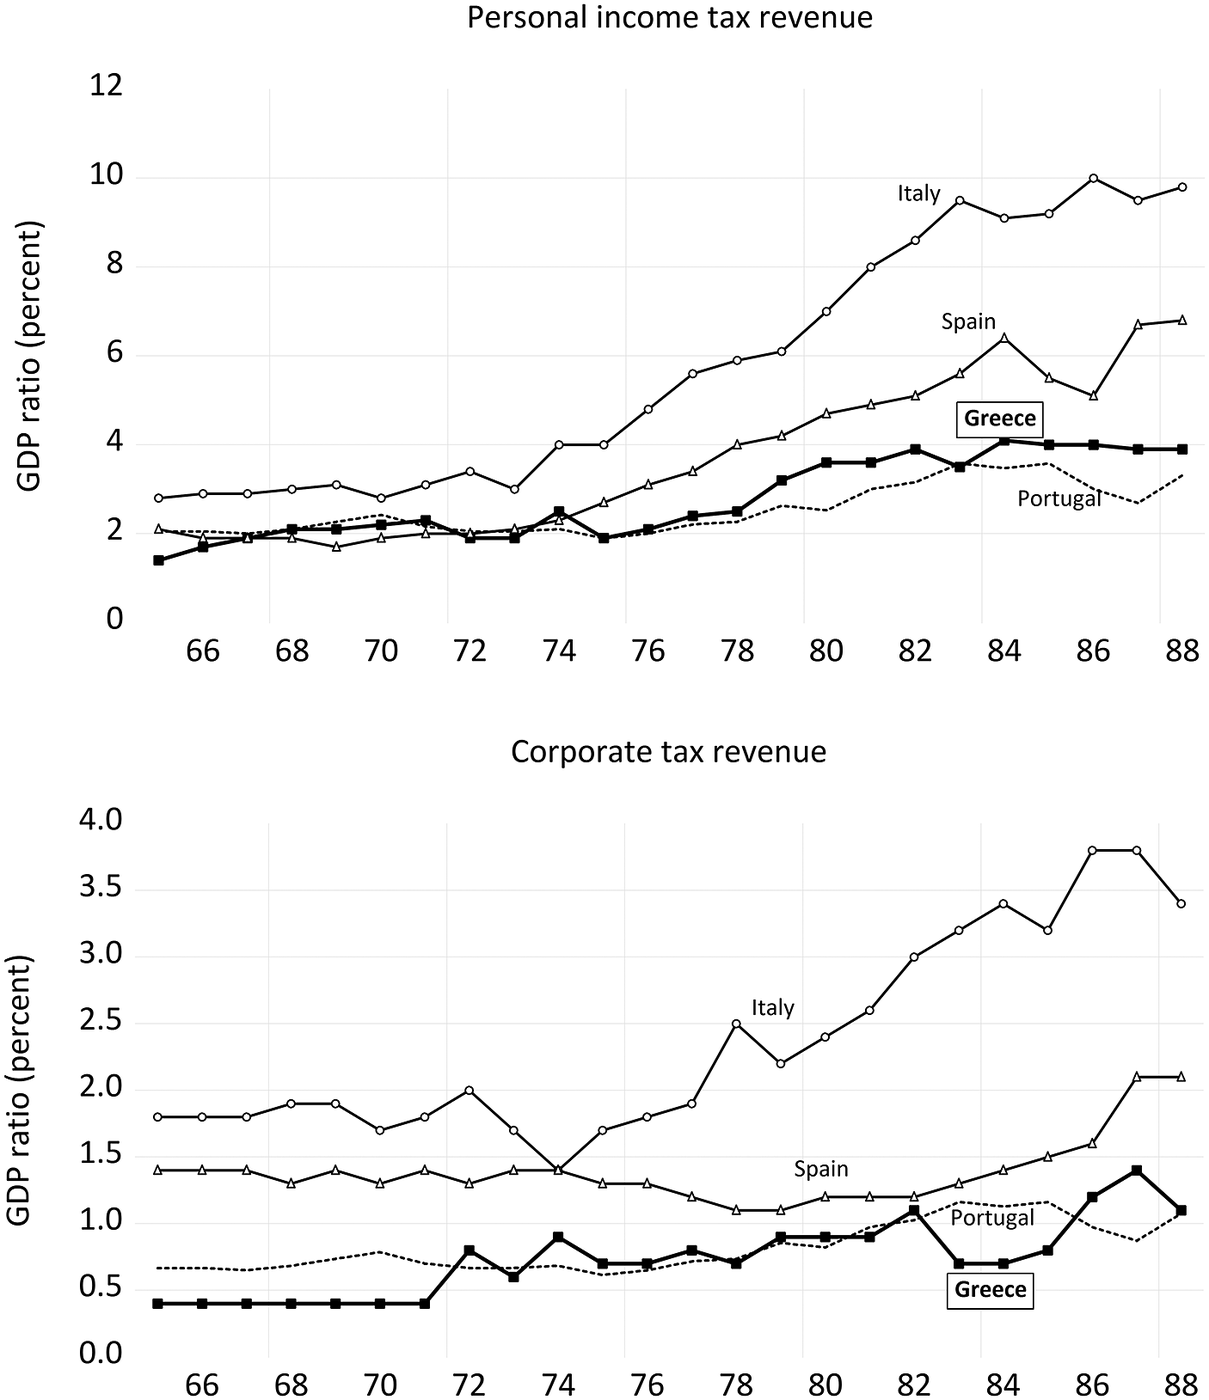
Moreover, as shown in Figure 2, catching-up in tax revenue from personal income was limited to a brief period (the decade between 1975 and 1985), while the gap in corporate tax revenue showed no steady progress since the early 1970s. Figure 3 shows that in the 1970s and 1980s Greece fell behind also with respect to other European countries (Italy, Spain, and Portugal) with structural similarities—such as a high incidence of self-employment, a high number of small and micro family-based firms, and a large underground economy—that facilitate tax evasion and depress income tax capacity.Footnote 134 In fact, over the last quarter of the 20th century, Greece had the smallest average firm size and the highest rate of self-employment among European countries (45 percent compared to 25-to-35 percent in Italy, Spain, and Portugal).Footnote 135 It also led the ranking of shadow economies in OECD countries, with 28.6 percent of the official GDP, closely followed by Italy, Spain, and Portugal (with 26.0, 22.4, and 22.1 percent, respectively).Footnote 136 This comparative perspective suggests that Greece should be seen as an extreme case of a vicious circle between poor fiscal institutions and structural weaknesses that undermined tax capacity in southern Europe.Footnote 137
The tax capacity gap to Western European average, 1965–1988. This figure shows the ratio of the GDP share of revenues from direct taxes (personal, income, corporate income, property), indirect taxes (goods & services) and social security contributions in Greece compared to a weighted average of 15 Western European countries (see Figure 1 for details). Source: OECD.Stat, Revenue Statistics, Comparative Tables (https://stats.oecd.org/index.aspx?DataSetCode=REV).
Income tax capacity in Southern Europe, 1965–1988. This figure shows the GDP ratio of revenues from personal income taxes and corporate taxes for Greece, Italy, Spain and Portugal. Source: OECD.Stat, Revenue Statistics, Comparative Tables (https://stats.oecd.org/index.aspx?DataSetCode=REV).
In order to assess more precisely the role of business in the poor performance of income taxation in Greece, we use the aggregate tax return statistics published by the Greek National Statistical Service since 1960 (see the Online Supplementary Material for further details).Footnote 138 Figure 4 shows indices of real revenues per capita of the personal income tax for different occupations and the corporate tax since the late 1950s.Footnote 139
Real tax revenues per capita by income categories. This figure shows an index (1959 = 1) of real tax revenue per capita by groups of head of household’s occupations. Unincorporated business includes entrepreneurs, merchants and artisans. Corporations includes Greek- and foreign-owned companies subjected to the corporate tax; cooperatives are excluded. Rentiers include households with income from property and financial assets. Fiscal years; nominal values are deflated by the corresponding Consumer Price Index. Periods are identified according to the government in charge of fiscal policy; e.g. since the military junta was in power from April 1967 to July 1974, its fiscal tenure spans the fiscal years 1967-1973. Sources. Tax revenues: National Statistical Service of Greece, Statistical Yearbook of Public Finance (Public Finance Statistics), 1962-1990: section IV (Income Taxation). Consumer Price Index: OECD data (1 = 2015), https://data.oecd.org/price/inflation-cpi.htm. Population: TED1 (Total Economy Database), https://www.conference-board.org/data/economydatabase/total-economy-database-productivity.
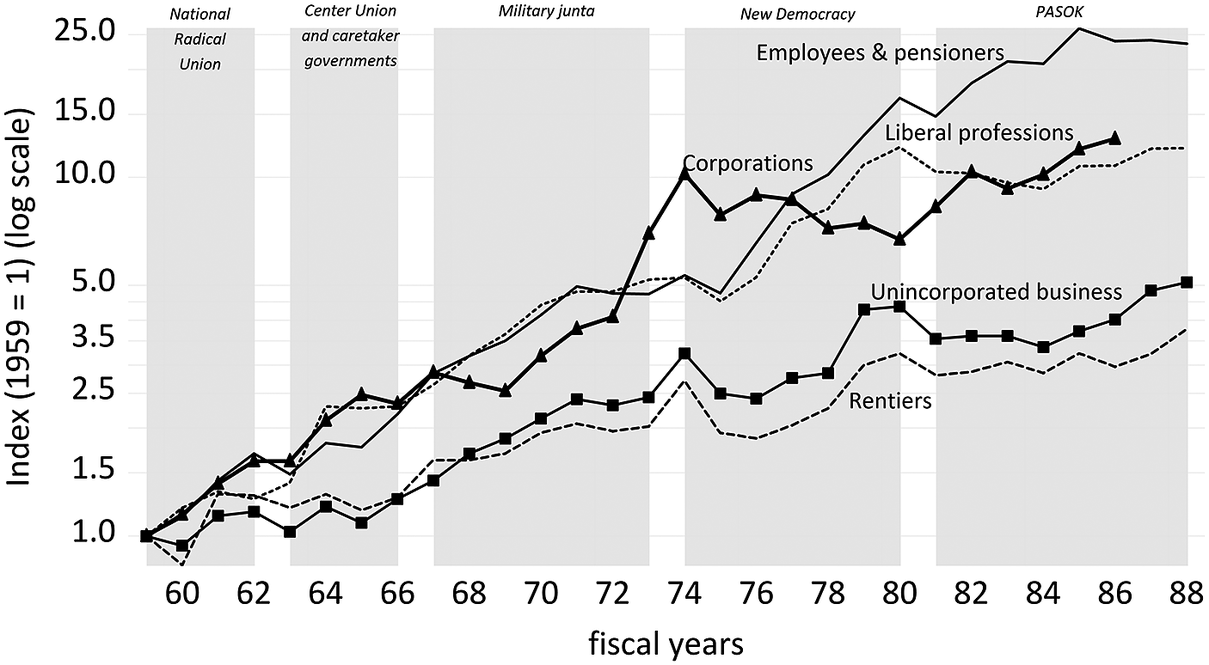
Compared to a steadily rising trend for employees and liberal professions (the latter was reversed in the 1980s, though), the trend for unincorporated business (entrepreneurs, merchants, and artisans) and rentiers remained extremely flat for the whole period, apart from occasional and mild spikes in coincidence with the fiscal emergencies of the 1970s. In comparison, the capacity to tax the corporate sector increased faster until the mid-1970s, but stabilized around its 1974 level for the rest of the period. In three decades, tax capacity increased only by a factor of 5 vis-à-vis income of unincorporated business and a factor of 13 vis-à-vis corporate income, against 25 vis-à-vis labor income.
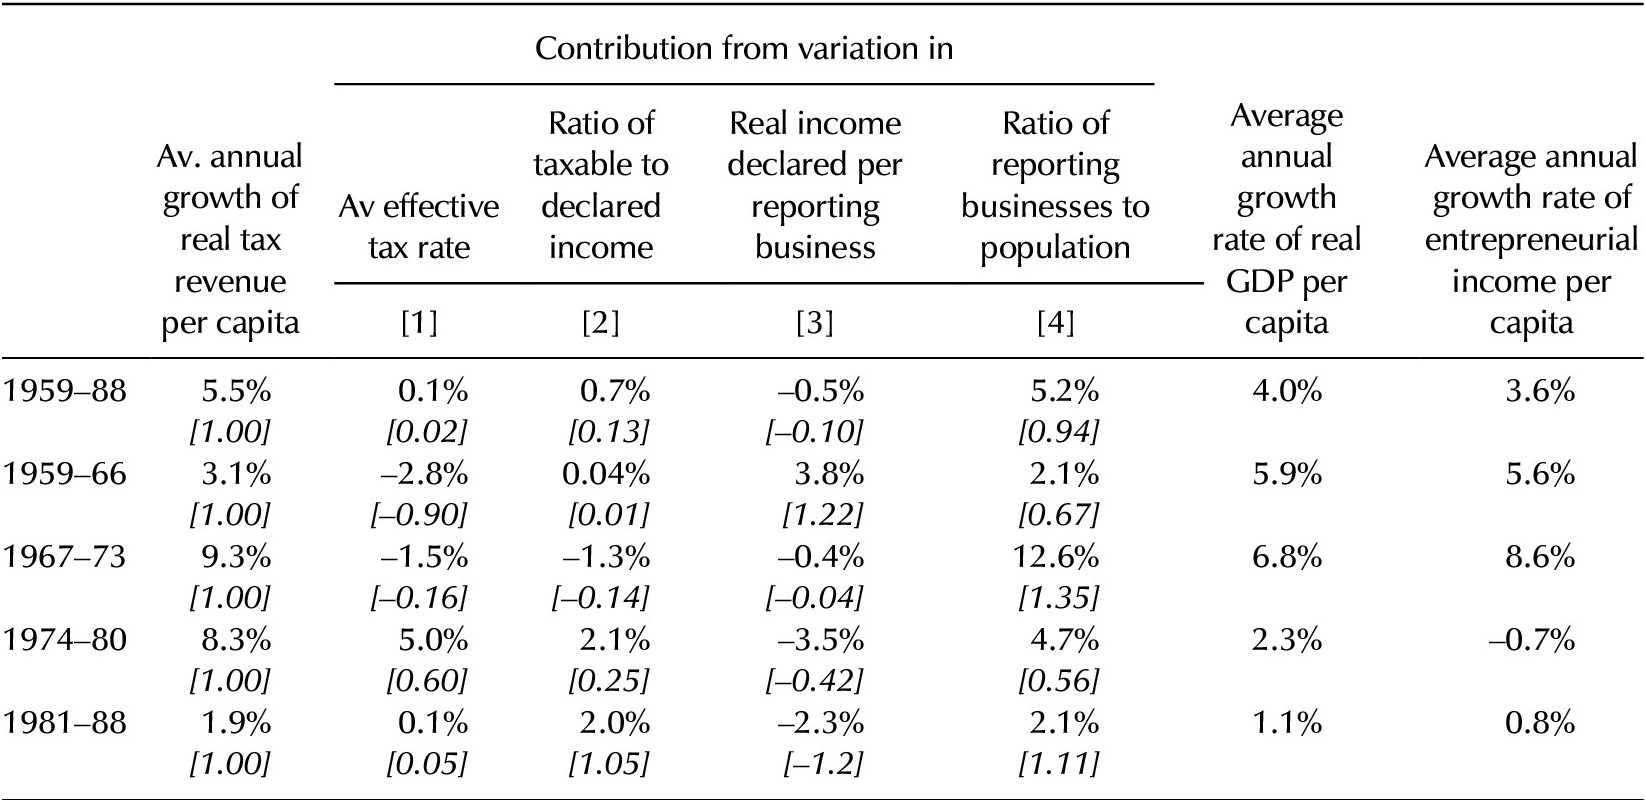
We can further explore at an aggregate level the response of businesses to variations in tax policy and enforcement in different periods by decomposing real tax revenue into its determinants, as follows:

The first two factors capture the impact of policy changes through [1] the average effective tax rateFootnote 140 and [2] the taxable share of declared income (i.e., after deducting exemptions and allowances from personal net income and distributed dividends and tax free reserves from corporate net income).Footnote 141 Factors [3] and [4] can be defined as the intensive and the extensive margins of the income tax base, respectively. Factor [3] measures the contribution of the average real income declared by each reporting business unit, that is, households for personal income and companies for corporate income. Changes in declared income are determined by variations in true earned income and in tax compliance (i.e., the share of true income not reported). Finally, factor [4]—that is, the number of business units filing tax records (normalized by population)Footnote 142—measures the contribution of the business base, which expands as new businesses are created and some of the existing ones decide to “emerge” under the pressure of tax enforcement. By expressing the equation above in annual growth rates, we can measure the contribution of each factor to the growth of tax capacity, measured as real tax revenues per capita.Footnote 143 Results for subperiods are presented in Table 2 (unincorporated business) and Table 3 (corporations), together with two proxies of true reportable income: the average real GDP per capita and real household income from property and entrepreneurship per capita (based on national accounts statistics).Footnote 144 (Annual results are included in the Online Supplementary Material.)
Determinants of tax capacity: personal income of unincorporated business. For each period, the first line of the Table reports the average growth rate of each variable, the second line (in italics) their contribution as a share of the growth of real tax revenue. Data refers to fiscal years; nominal values are deflated by the corresponding Consumer Price Index. Sources. Tax revenues: National Statistical Service of Greece, Statistical Yearbook of Public Finance (Public Finance Statistics), 1962-1990: section IV (Income Taxation). Consumer Price Index: OECD (1 = 2015), https://data.oecd.org/price/inflation-cpi.htm. GDP per capita and population: TED1 (Total Economy Database), https://www.conference-board.org/data/economydatabase/total-economy-database-productivity. Household income from property and entrepreneurship: National Statistical Service of Greece, National Accounts of Greece (various issues) and OECD Economic Surveys, Greece (various issues).
Determinants of tax capacity: corporate income. For each period, the first line of the Table reports the average growth rate of each variable, the second line (in italics) their contribution as a share of the observed growth of real tax revenue. Final year is 1986 as our sources do not report corporate tax statistics for 1987 and 1988. Data refers to fiscal years; nominal values are deflated by the corresponding Consumer Price Index. Sources. Tax revenues: National Statistical Service of Greece, Statistical Yearbook of Public Finance (Public Finance Statistics), 1962–1990: section IV (Income Taxation). Consumer Price Index: OECD data (1 = 2015), https://data.oecd.org/price/inflation-cpi.htm. GDP per capita and population: TED1 (Total Economy Database), https://www.conference-board.org/data/economydatabase/total-economy-database-productivity. Household income from property and entrepreneurship: National Statistical Service of Greece, National Accounts of Greece (various issues) and OECD Economic Surveys, Greece (various issues).
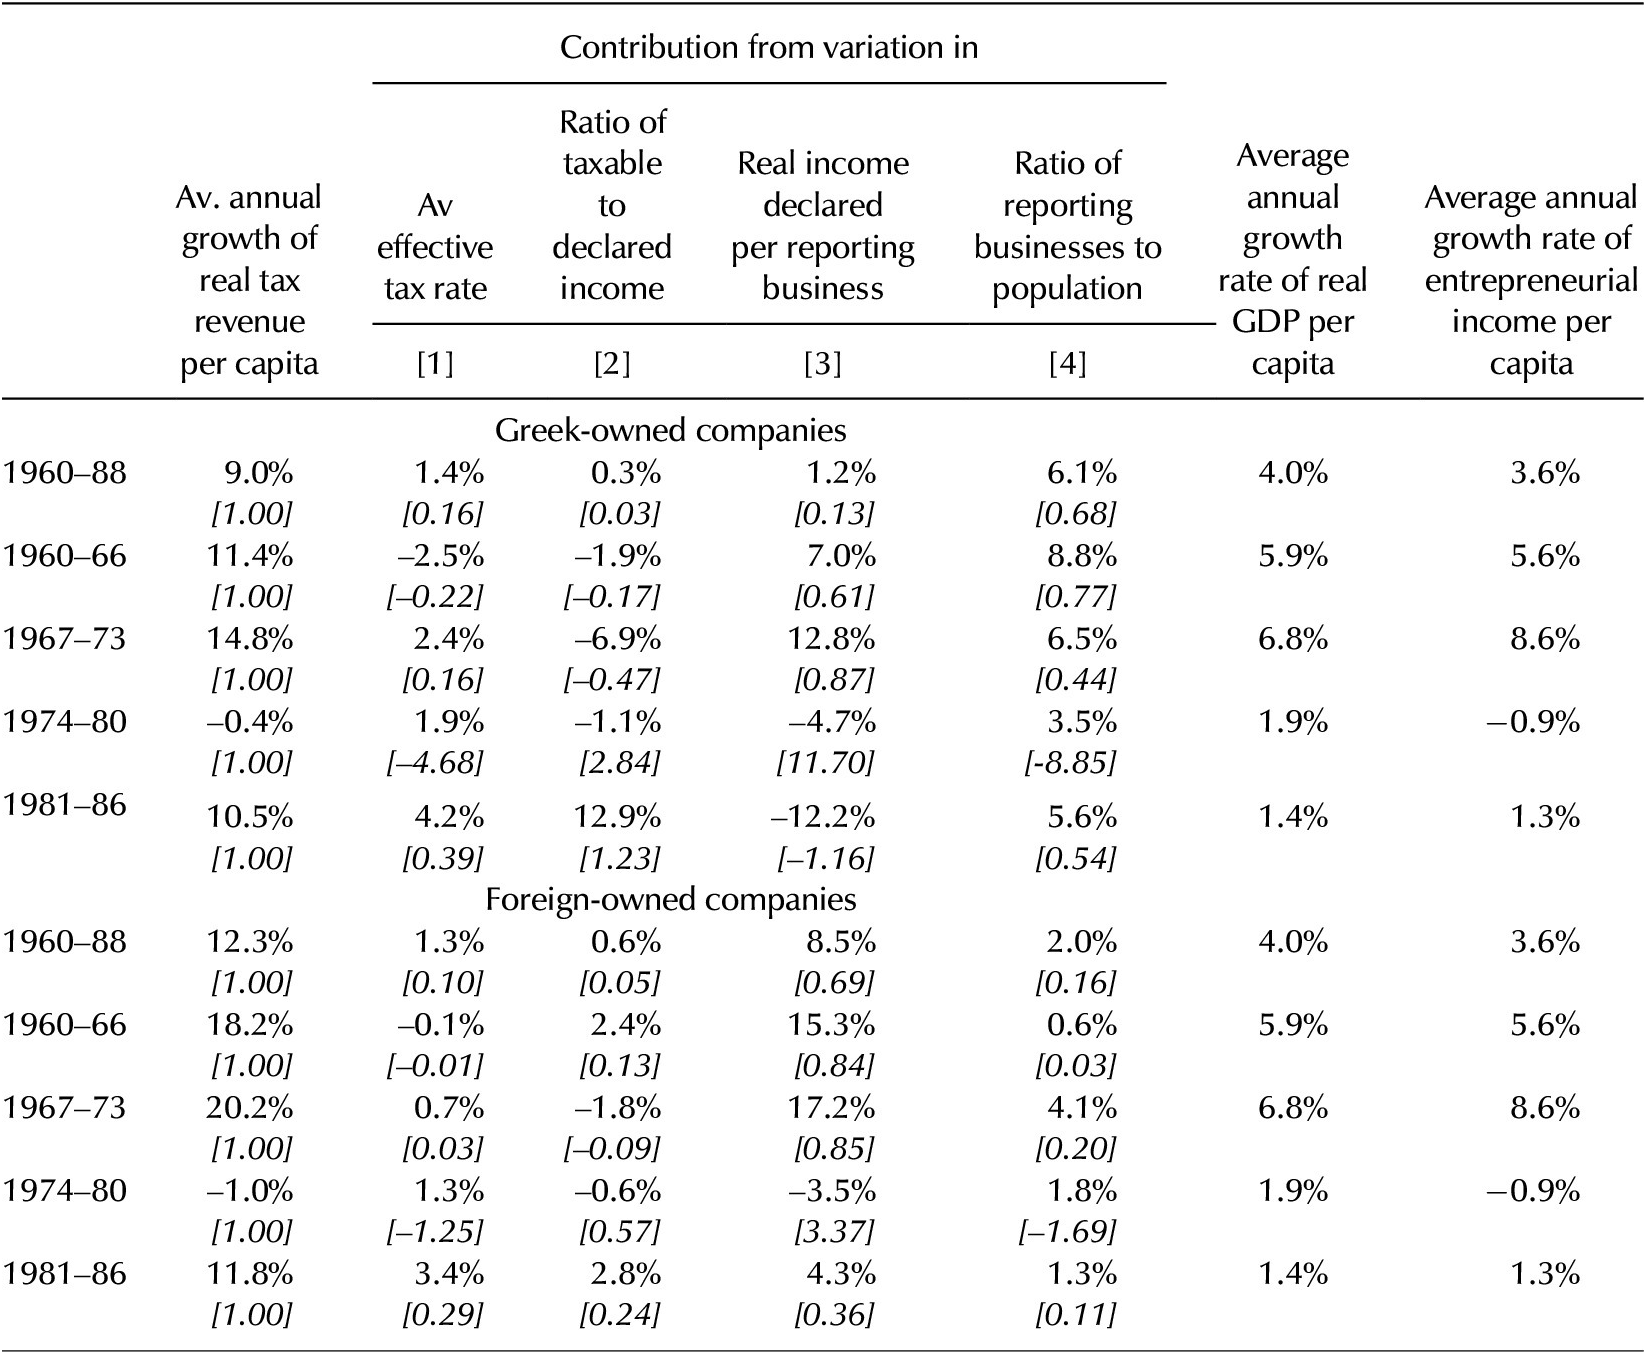
In the long run, tax capacity vis-à-vis unincorporated business grew at an average annual rate of 5.5 percent; this is almost exclusively explained by the extensive margin (reporting businesses) while the intensive margin (reported income) made a negative contribution. In comparison, the capacity to tax the corporate sector increased significantly faster vis-à-vis both Greek- and foreign-owned companies (9.0 and 12.3 percent, respectively), although the dynamics of the extensive margin dominated in the former and that of the intensive margin in the latter.
The analysis by subperiods sheds further light on important differences in the determinants of tax capacity. For unincorporated business, progress was slow in the first period, peaked between 1967 and 1980 and finally collapsed in the 1980s. The contribution of tax policy (average tax rates and the ratio of taxable-to-declared income) was negative in 1959–66 and 1967–73 and turned positive after the return to democracy, in line with our analytical narrative. The contribution of the intensive margin (reported income) was positive only until 1966 and turned persistently negative thereafter, especially so after 1974. The gap with respect to the growth of average and entrepreneurial income can be interpreted as a broad measure of the magnitude of underreporting, which is sizeable even taking into account the sharp slowdown in average income growth since the mid-1970s. The contribution of the extensive margin (reporting businesses) was always positive but extremely low until 1966 and after 1981, while it reached a peek under the military junta. This suggests that, in the early years of the reforms, many businesses preferred to remain in the shadow sector, but for those who decided to “emerge,” there was possibly a trade-off (conditional to a favorable business environment) between lower tax pressure and enhanced compliance. This interpretation is consistent with the expected sign of the elasticity of reported income to changes in the net-of-tax rate.Footnote 145 On the contrary, under the military junta, when failing to comply with the obligation to file tax returns could be interpreted as political disloyalty, repressive forms of coercion forced the emergence of many businesses but had a negative effect on their compliance. After 1974, this was further depressed by rising tax pressure and the consolidation of an antagonistic tax environment.
The pattern observed in the corporate sector is quite different. Tax capacity increased very fast until 1973, collapsed in the second half of the 1970s and bounced back in the 1980s. Although tax pressure fell in the early years of the reforms and began to rise since the second half of the 1960s, the taxable-to-declared income ratio tended to fall until 1980, suggesting that a clear discontinuity in tax incentive policy was achieved only under the socialist governments. The sharp fall in this ratio for Greek-owned companies under the military junta is also explained by a significant increase in the share of distributed profits;Footnote 146 this suggests that firms responded to higher tax pressure and more repressive enforcement by allowing shareholders, directors, and managers to appropriate a larger share of net income in forms that were more likely to elude taxation. The contribution of the extensive margin was always positive and much stronger for Greek-owned companies (though declining over time, also due to a significant increase in loss-reporting companies since the mid-1970s).Footnote 147 In turn, the contribution of the intensive margin (reported income) was very sustained and largely exceeded the growth rate of average and entrepreneurial income in the first two periods; this suggests that tax enforcement was comparatively more effective in pushing compliance in the corporate sector until the mid-1970s and especially so in the buoyant business environment during the years of the military junta. In the deteriorated macroeconomic and business environment that coincided with the return to democracy, we can observe a clear change in the tax behavior of Greek-owned companies, with an abrupt decline in the trend of reported income that accelerated toward the end of the period. Comparatively, a similar decline was limited to the late 1970s in foreign-owned companies.Footnote 148
Focusing on the intensive margin, Figure 5 compares trends in real declared income per reporting business in the unincorporated and the corporate sector; we include the same index for professional occupations for the sake of comparison.
Real declared income per reporting business. This figure shows the (log) index (1959 = 1) of real declared income per reporting tax unit (households for unincorporated business and liberal professions; companies for Greek- and foreign-owned incorporated business). Fiscal years; nominal values are deflated by the corresponding Consumer Price Index. Sources. Tax revenues: National Statistical Service of Greece, Statistical Yearbook of Public Finance (Public Finance Statistics), 1962-1990: section IV (Income Taxation). Consumer Price Index: OECD data (1 = 2015), https://data.oecd.org/price/inflation-cpi.htm. GDP per capita and population: TED1 (Total Economy Database), https://www.conference-board.org/data/economydatabase/total-economy-database-productivity. Household income from property and entrepreneurship: National Statistical Service of Greece, National Accounts of Greece (various issues) and OECD Economic Surveys, Greece (various issues).
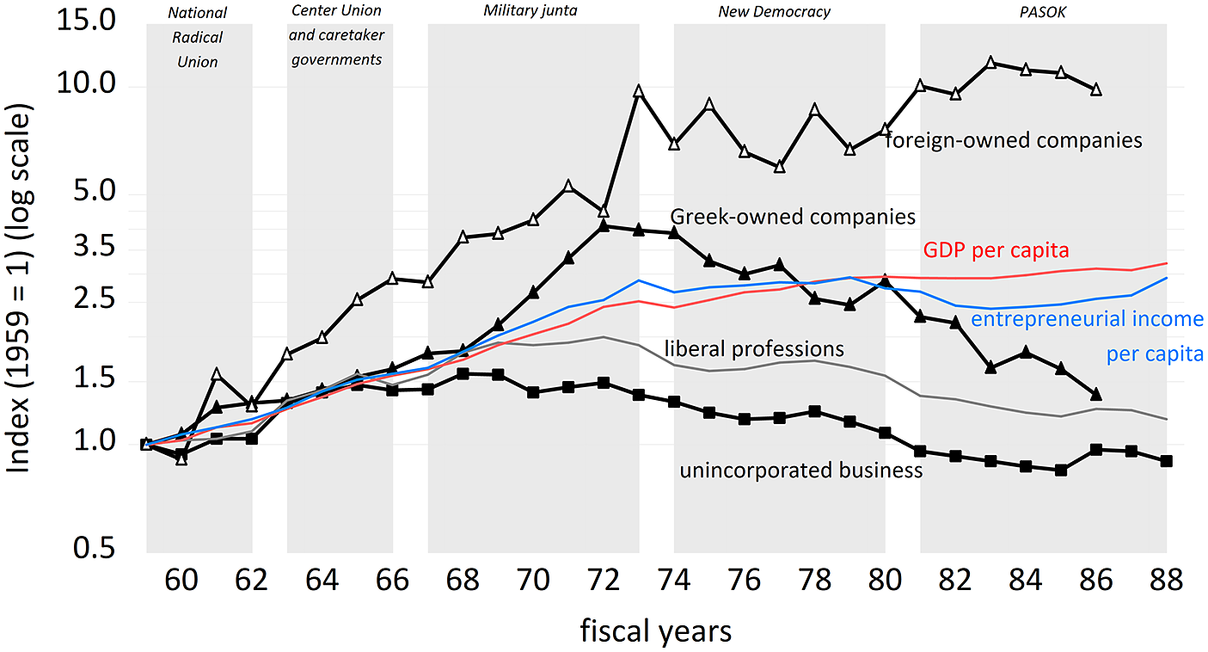
The figure shows that reported income of unincorporated business and Greek-owned corporations grew broadly in line with average and entrepreneurial income until the mid-1960s (but significantly faster in foreign-owned companies). Since then, however, the intensive margin of unincorporated business shows a declining path; by 1988, reported income had reverted back to its 1959 level in real terms. Net income reported by Greek-owned corporations shows a similar declining trend after 1974, reverting to its 1970 level by the end of the period. As shown in Figure 6, we observe the same pattern in sectoral trends of reported income (manufacturing, construction and commercial, financial and real estate services), which jointly accounted for 90 percent of total net income over the period.
Real declared income by sector of Greek-owned companies. This figure shows the (log) index (1959 = 1) of real declared income per reporting Greek-owned company by sectors. Fiscal years; nominal values are deflated by the corresponding Consumer Price Index. The weighted average is calculated using sector weights based on each sector’s average share of total net income over the whole period (manufacturing 43.3%, commerce banking insurance and real estate 39.1%, construction 6.8%, transport & storage 6.6%, mining 2.2%, other services 1.8%). Sources. Tax revenues: National Statistical Service of Greece, Statistical Yearbook of Public Finance (Public Finance Statistics), 1962-1990: section IV (Income Taxation). Consumer Price Index: OECD data (1 = 2015), https://data.oecd.org/price/inflation-cpi.htm.

The evidence is fully consistent with our slippery slope narrative. The intimidating strategy of coercive threats pursued by the military junta had only temporary effects on enforced compliance but backfired once the regime collapsed. Under democratic governments, the consolidation of an antagonistic tax climate and the poor credibility of ordinary enforcement strategies depressed compliance further in an increasingly adverse business environment. This interpretation is also consistent with recurrent concerns expressed by international observers, who raised doubts about the actual impact of stricter tax enforcement on tax compliance both under conservative and socialist governments.Footnote 149
Although we find the evidence of systematic underreporting quite compelling, we do not claim that the tax climate was its sole determinant. In fact, we cannot rule out that other environmental factors could contribute to a degradation of compliance in the 1970s and 1980s. On one hand, empirical studies show that changes in net-of-tax rates (i.e., income retained after tax) tend to affect both the personal and corporate income tax base because higher tax rates increase the profitability of underreporting on the margin.Footnote 150 Similarly, rising inflation gives households incentives to underreport income in order to preserve or restore real purchasing power, to offset the fall in the real value of nominal allowances and exemptions and to avoid the progressive effect of fiscal drag.Footnote 151 By the same token, higher inflation can give firms (especially if capital intensive) incentives to underreport net income because inflation reduces the real value of tax deductions (e.g., for depreciation and investment) based on historical cost accounting, thus increasing the real corporate tax burden.Footnote 152 On the other hand, rising labor and general costs and, to a much lesser extent, administered pricesFootnote 153 most likely led to lower profitability, which is generally associated with an increase in the proportion of underreported income in the business sector.Footnote 154 The actual impact of such factors remains an empirical question for future research.
Conclusions
Our paper used the slippery slope framework to explain why post-WW2 Greek governments failed to increase their capacity to tax income and profits of the business sector and reduce their gap in direct taxation with other European countries. We argue that both enforced and voluntary tax compliance of Greek entrepreneurs was undermined by the lack of a credible and consistent use of legitimate power and the overreliance on threats of coercive enforcement throughout the second half of the 20th century. Early experiments with income taxation in the interwar period elicited stiff resistance by the business sector. In the 1950s and early 1960s—a Golden Age of fast growth, macroeconomic stability and favorable business conditions—the modernization of income and corporate taxation was insufficiently supported by a credible reform of the tax administration and a sustained investment in earning the trust of entrepreneurs. The proliferation of special tax treatments across firms and sectors and the failure to implement neutral and transparent rules for tax enforcement reinforced business’ perceptions of tax power as unfair, arbitrary and extractive.
With hindsight, the reform of the 1950s were a once-in-a-century missed opportunity to enhance business’ acceptance of income taxation and build a more cooperative tax environment. Later on, adverse political and then macroeconomic developments favored the emergence of an increasingly antagonistic tax climate. Extreme threats of coercion under the military regime had virtually no effect on tax compliance of unincorporated business and only a limited and short-lived impact on incorporated firms, in spite of lower tax pressure and a buoyant economy. In the framework of a permanent fiscal emergency with declining growth that prevailed after the return to democracy, the combination of rising tax pressure and an intensification of coercive threats not only failed to improve but most likely contributed to a generalized deterioration of business tax compliance. Given the structural characteristics of the Greek economy, with a self-employment rate at 42 percent of total official employment still at the end of the 20th century, the systematic underreporting of income by business (and liberal professions) pushed the Greek economy further down the slippery slope of a low tax capacity equilibrium.
This historical failure continues to cast a shadow on the Greek economy. In the dramatic crisis of 2009–13, which put fiscal policy under strict international supervision, the short-run imperative of raising revenues from direct taxation was pursued through the same antagonistic approach that had failed in the 1970s and 1980s: the escalation of tax pressure and the intensification of threats of deterrence. However, the tax system still exhibits the structural weaknesses and distortions that depressed historically business’ compliance.Footnote 155 In line with the slippery slope predictions, the hard stance of tax authorities has led to a further deterioration in business’ perception about the fairness of the tax system and the effectiveness with which it is administered, with limited effects on tax evasion and the shadow economy.Footnote 156 Almost 70 years after the reforms that laid the foundations of its modern tax system, the Greek society has yet to find a way to earn business’ trust, broaden a historically narrow tax base and break the low income tax capacity trap.
Acknowledgments
We are grateful to two anonymous referees for their excellent comments and suggestions and to the editor of the journal for his clear guidance. We are also indebted to participants in the UPIER seminar (St. Hilda College, Oxford), the 2nd World Business History Congress and the Business History Online Seminar for their useful feedback. The usual disclaimer for remaining errors and omissions applies. Battilossi gratefully acknowledges funding support from HERA (Humanities in the European Research Area) and the European Commission under the research project “UPIER-Uses of the Past in International Economic Relations” (HERA.15.025). Funding for APC: Universidad Carlos III de Madrid (Agreement CRUE-Madroño 2023).
Supplementary Material
To view supplementary material for this article, please visit http://doi.org/10.1017/eso.2023.51.


 Open access