1. Introduction
It has recently been shown (Reference HammerHammer, 1977; Reference Hammer, Hammer, Clausen, Dansgaard, Gundestrup, Johnsen and ReehHammer and others, 1978), that enhanced levels of soluble acid impurity concentration in layers of Greenland ice cores deposited through the period a.d. 1770–1972 are due to violent volcanic eruptions mainly in the Northern Hemisphere. During such eruptions, large amounts of volcanic gases are injected into the atmosphere, for example SO2 that oxidizes and combines with water to form sulphuric acid. All volcanic aerosols are washed out by precipitation in the troposphere. Those originating from eruptions outside the high northern latitude belt reach Greenland only if the eruption is violent enough to inject substantial amounts of gases into the stratosphere, where they spread all over the hemisphere, re–entering the troposphere up to three years after the eruption. Estimates of the magnitude of the eruptions proved possible, provided the locality of the eruption is known. Year by year dating of the ice, and thereby absolute dating of past eruptions, has been described by Reference Hammer, Hammer, Clausen, Dansgaard, Gundestrup, Johnsen and ReehHammer and others (1978).
In principle, it may be possible to estimate the volcanic activity very far back in time by measuring a specific conductivity profile on melted samples along a deep ice core (Reference HammerHammer, 1977). A pH profile may serve the same purpose, at least within the last 10 000 years, and particularly if one accounts for non–acid soluble compounds, e.g. NH4 Cl and (NH4)2SO4, that sometimes contribute significantly to the volcanic fall–out. But it is not feasible with conventional techniques, because some 100 000 samples would be needed. The aim of this paper is to describe and discuss a technique that may bring the above–mentioned task within reach. Establishing a volcanic–activity record is one of the objectives of the joint American–Danish–Swiss Greenland Ice Sheet Program (GISP).
The ice–sheet locations mentioned in this work are: Crête (lat. 71.1° N., long. 37.3° W.), Camp Century (lat. 77.2° N., long. 61.2° W.), Dye 3 (lat. 65.2° N., long.43.8° W.), and Hans Tavsen (lat. 82.5° N., long. 38.8° W.).
2. Technique
The first step is to use a microtome knife to make a cut parallel to the axis of the ice core exposing a practically flat surface of ice that is chemically representative of the interior of the ice sheet. Even in the case of cores that have been in contact with hole liquid during drilling, it is usually sufficient to remove the outer 5 to 10 mm to reach “clean ice”.
A pair of brass electrodes are brought into contact with the ice establishing an electrical potential difference of 1 250 V over a distance of 1 cm (Fig. 1). The electrodes are then moved in a zig–zag (to minimize the influence of air bubbles and other causes of poor contact) at a velocity of 10–20 cm⁄s, at the same time as the current between them is recorded. Maximum resolution is obtained when the two electrodes are contacting the same layer at any time (if the layer orientation is not visible, it may be revealed by this effect). Finally, the current reading may be transformed into acidity by a calibration curve relating the two parameters in terms of μA (measured at –14°C) and μequivalents H3O+/kg respectively, the latter being derived from pH measurements on melted samples and corrected for CO2–induced ions (cf. Section 2.1).

Fig. 1. Two electrodes with a voltage difference of 1 250 V are moved along a cleaned surface of an ice core. A rapid movement ensures that new ice is continuously brought into the field preventing strong polarization (cf. Fig. 4), whereby the current becomes indicative of the acidity of the ice.
2.1. Calibration curves
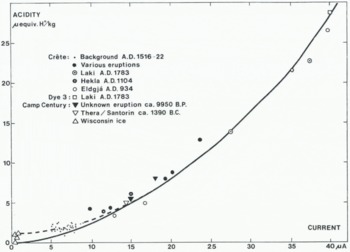
The relationship of acidity to current (Fig. 2) has been determined on increments selected from the entire 404 m long Crête core spanning the time A.D. 555–1974. The H+ concentration of the individual samples used in Figure (2) have been corrected for CO2–induced H+ corresponding to sample equilibration with ambient air (25°C), probably an insufficient correction due to the sampling procedure and the unknown content of CO2 in individual ice samples (see below). Currents above 10 μA generally occur only when the ice contains volcanic impurities, and currents above 25 μA have hitherto only been obtained in the two increments containing fall-out from the Laki eruption A.D. 1783 and from what is believed to be an eruption of another Icelandic volcano, Eldgjá A.d. 934 (cf. Section 4.2.5, p. 368). The low currents (5 to 18 μA) were all found in ice from a period (A.D. 1516–23) of low or no volcanic activity (cf. Fig. 3). Other data in this range will be presented in Section 4, but for various reasons (imperfect core, insufficient amount of ice material, etc.) they have not been used for calibration purposes. Extremely low currents (<1 μA) have only been measured in Camp Century ice from the Wisconsin glaciation.

Fig. 2. Square-law relationship of acidity to current. Currents higher than 10 μA only occur when the ice is doped by acid fall-out of volcanic origin. Solid line: proposed calibration curve. Broken line: H+ concentration including c. 50% surplus CO2 effect.

Fig. 3. Top section: Current profiles (1 and 2) measured on two different segments of the same increment of the Crête ice core. Mid section: Mean of currents 1 and 2 plotted with a resolution averaging twelve samples per annual layer. Lower section : δ(18O) profile with the original annual cycles re-established by Reference JohnsenJohnsen′s (1977) deconvolution technique. The time scale is determined by counting such cycles downwards from the surface.
Disregarding the Wisconsin data, the relationship of acidity [H+] to current i (in μA) may for practical purposes be expressed by
shown as a broken line in Figure (2).
The low currents do not correspond to low acidities, as the broken curve intersects the acidity axis at c. 1 μequiv. H+/kg. A probable explanation is a surplus CO2 effect which is only important for the low-acidity data: During melting the samples were encapsulated in beakers with some ambient air. The bulk of the melt had a temperature of 0°C for more than 10 min, which was sufficient time for CO2 equilibration with the enclosed air at the stated temperature. When the water had reached a temperature of 25°C, the beakers were opened, and the samples were allowed to “equilibrate” with ambient air at 25°C. A calculation for the samples in question shows that some 40% more CO2 may be dissolved in the samples than corresponds to equilibration between water at 25°C and ambient air (assuming no or little leakage from the outside air during the melting). As this surplus of CO2 only leaves the sample very slowly at 25°C, a correction may be necessary. Experiments using frozen purified water (pH = 7.1, not in contact with ambient air) as an artificial ice core, verified the above calculation.
According to Reference Raynaud and DelmasRaynaud and Delmas (1977), Holocene ice from Camp Century, Greenland, contains on the average 0.4 ml CO2 (STP)/kg of ice, but more recent data (Reference Stauffer and BernerStauffer and Berner, 1978, and personal communication) suggest, that ice from the Greenland ice sheet contains less CO2, probably some 0.1 ml CO2 (STP)/kg of ice. The latter CO2 content corresponds to a 50% surplus in the melt at 25°C.
It is therefore possible that correction of the acidities in Figure 2 for 50% surplus CO2, would result in a more realistic calibration curve, cf. the solid line in Figure 2, which may be expressed as
but it remains to be shown that 0. 1 ml CO2 (STP) /kg holds for the entire Holocene. In this work the broken line has been used, as the CO2 content of individual samples was unknown. Consequently, the low acidities are probably too high by some 0.7 μ equiv. H+/kg. The variable ratio of sample to air volume causes the relatively high scatter in the low acidity range of Figure 2.
A closer inspection of the data shows that a nearly parabolic function only holds for the higher acidities and becomes close to a linear relationship for the low acidities. Laboratory analyses of ice strongly doped with halogenic acids have shown that the acidity increases proportional to the second or, in one case, 2.5 power of the bulk static conductivity (Reference JaccardJaccard, 1959; Reference GrossGross, 1965; Reference Levi and ŌuraLevi, 1967; Reference Young and SalomonYoung and Salomon, 1968; Reference Gross, Gross, Hayslip and HoyGross and others, 1978). To some degree, the calibration curve resembles the relationship between Debye low-frequency conductivity and HF concentration found for doped single ice crystals at 258 K (Reference Camplin, Glen and ParenCamplin and others, 1978, Fig. 3). However, a close comparison between their absolute conductivities and the data obtained in this work is not possible, not only because the ice cores are poly-crystalline, but also because the effective area of the special electrodes as well as the initial electric field in the ice core are difficult to estimate to any reasonable accuracy. So far, no reproducible experiments have been reported on ice doped with H2SO4, which is an important component in this work (see Reference Levi and ŌuraLevi, 1967).
It has not been possible to detect any relationship between the current and the crystal size, nor the insoluble particle concentration, nor the salt concentration in Greenland ice cores. The salt concentration in the ice was estimated from measurements of the specific conductivity σ of melted samples as follows. The salt contribution σs can be expressed by
the three latter terms being the contributions of H+, obtained by pH measurements, and its anions. The anion concentration in μequiv./kg is of course equal to the H+ concentration, which allows the anion contribution to be determined with sufficient accuracy: Disregardinglow acidity samples, the concentration of HCO3- in μequiv./kg is negligible, i.e.X – μequiv./kg ≈ H+ μequiv./kg. As the equivalent conductance is nearly the same for the dominating anions, i.e. CI - and SO4- (Reference Cragin, Gragin, Herron, Langway, Klouda, Dunbar and MaxwellCragin and others, 1977; Reference Herron, Herron, Langway, Weiss and GraginHerron and others, 1977; Reference Wiss, Weiss, Bertine, Koide and GoldbergWeiss and others, 1975), σ(X -) can be calculated without knowing the anion composition. In case of low-acidity samples the error on σs is estimated at some 0.1 μS cm-1 due to the unknown amount of surplus CO2 in the samples.
It is concluded that the current in acid ice is heavily influenced and probably determined by the H+ concentration as measured in melted samples. In Section 4.2.1, it will further be shown that the salt concentration has little influence, if any.
2.2. Reproducibility
A number of experiments have been performed to check factors that may influence the current measurements.
-
a. The cut-off depth needed to obtain a clean surface generally increases with the storage time of the core. Thermally drilled cores are often finely wafered, which has no influence, provided that complete breaking and refreezing has not occurred. Usually 1 cm cut off is sufficient to reach representative ice.
-
b. The minimum thickness of the piece of ice to be measured is 4 cm, i.e. 1 cm cut off and 1 cm on the opposite side to allow for contamination, plus 2 cm “clean” ice as a measuring object. The measurement changes the electrical properties to a depth of 1-2 mm. Therefore, the measurement should not be repeated on the same surface. The width of the cleaned surface should be larger than 2 cm for convenience.
-
c. The voltage difference between the electrodes is not critical, as long as it is in the range of linearity between voltage and current at a practical sliding velocity of the electrodes. The value of 1250 V chosen is within this range, and is high enough to give a reasonable current at sliding velocities above 2 cm/s. Very high voltages probably make the current dependent on the velocity, and may give rise to field emission, etc., even at considerable sliding velocities, which would complicate the relationship of current to acidity.
-
d. Sliding velocities in the range from 2 to more than 100 cm/s have only little influence on the current at the chosen 1250 V. The reason for this will be discussed in Section 4.
-
e. The temperature of the ice influences the current. Warming from –22 to –7°C changes the current by some 100% for ice of low acidity and some 50% for ice of high acidity (corresponding to activation energies of 30–17 kJ/mol or 0.31–0.18 eV). The current profiles presented in this work have generally been measured at –14°C with a view to reasonable working conditions and to the desirability of keeping the temperature low enough essentially to avoid the influence of surface conductivity (Reference Macno and NishimuraMaeno and Nishimura, 1978).
-
f. The geometry of the electrodes is shown in Figure (1). They are shaped so as to ensure easy movement over the ice surface. Large contact areas give high currents, but low resolution and reproducibility. The electrodes used here have a contact area of 1.5 mm2, which is large enough to ensure a high current and small enough to give good contact, high resolution, and high reproducibility. The distance between the electrodes (here 10 mm) is not important, e.g.a change from 20 to 7 mm causes a change in the current of less than 20%.
The upper part of Figure (3) shows two current profiles measured on two separate segments of the same increment of the Crête core, spanning seven annual layers, deposited in the volcanically quiet period from the summer of A.D. 1516 to the summer of a.d. 1523, according to the absolute dating of the core (Reference Hammer, Hammer, Clausen, Dansgaard, Gundestrup, Johnsen and ReehHammer and others, 1978, p. 15). Most of the characteristic features are common to the two profiles, even in the fine structure if one accounts for a bit of uncertainty along the horizontal core axis.
3. Discussion of the Method
Prior to presenting some results obtained on Greenland ice cores, it is appropriate to look into the problem of why the current is independent of the velocity of the electrodes as long as the velocity exceeds 20 mm/s. Two experiments have been performed on Holocene ice:
a. With stationary electrodes, the current i typically varies with time after imposing the voltage difference as shown in Figure (4), disregarding the first 10 ms. The current keeps essentially constant at i 0 during a time period of τ, generally in the 0.1 to 0.5 s range, depending on the character of the ice. Thereafter, the current decreases rapidly, often exponentially, with a half life of the order of a second. After several seconds the current decreases much more slowly. This sequence of events resembles the current variations obtained by Reference Von Hippel, Von Hippel, Runck, Westphal, Whalley, Whalley, Jones and GoldVon Hippel and others (1973) in experiments on non-doped ice showing a fairly constant initial current i 0 during the first few tenths of a second. According to the same authors this is associated with a build-up of positive space charges by various types of conduction processes that gradually lead to a contraction of the applied voltage in a cathode fall. As the field strength at the cathode rises, field emission sets in, producing an almost constant current i f.

Fig. 4. Current i as a function of time t after bringing the electrodes into contact with the ice in a fixed position.
The presence of space charges in the experiment with stationary electrodes has been discussed by Reference Engelhardt, Whalley, Whalley, Jones and GoldEngelhardt (1973), who also pointed out, that during the primary charging of the crystal “electrons leave at the anode, discharging negative ions and freeing positive charges (protonic states) which move across the crystal”, and lead to a contraction of the applied field in the cathode region. Engelhardt used various metal electrodes (parallel-plate condenser) and impeded charge transfer was observed even with external potentials of 4500 V.
The processes of charge transfer impeded at the cathode, and electrons leaving at the anode are analogous to the space-charge build-up in alkali halide crystals containing colour centres (Reference Von Hippel, Von Hippel, Gross, Jelatis and GellcrVon Hippel and others, 1953), as pointed out previously in another context by Reference Maidique, Maidique, Von Hippel and WestphalMaidique and others (1971). One could of course pursue the analogy in order to explain the range of τ, but this is hardly justified in view of the complex electrical behaviour of ice and the special electrodes used in this work.
b. A second experiment was performed to determine the extent of the volume around the electrodes in which the electrical properties of the ice are permanently changed by application of the electrical field. The square-shaped electrodes (Fig. 1) were brought into contact with a cleaned surface of an apparently homogeneous piece of ice, and left in position A during time T. After a T of several hours the current had dropped to less than 1% of i 0 . The electrodes were then removed, and a pair of needle-shaped electrodes were brought into contact with the surface at distance L from A, giving a lower i 0 value due to the smaller contact area. The same i o value was obtained within ±10% for various values of L between 150 and 2.5 mm, showing that the ice was originally homogeneous. But i 0 decreased with L for L < 2.5 mm, showing that the potential difference applied at A changed the electrical properties of the ice up to 2.5 mm from A. With a T of several minutes, the damage only extended approximately 1 mm from A, but still in A itself (i.e. L = 0), the i0 obtainable with the needle-shaped electrodes was lower than originally. By gradually cutting away the surface layers around A, similar experiments proved the ice to have changed electrical properties to a depth of a few millimetres.
It is concluded that, in the case of sliding the square-shaped electrode area over the surface, a resolution close to the width of the electrodes (<2 mm) is to be expected. Since we want to take advantage of the practically constant current within the time τ (Fig. 4), the electrodes must be moved 2 mm in less than τ. Since τ is sometimes as low as 0.1 s, this corresponds to a minimum velocity of 20 mm/s, in agreement with the experience that the current generally decreases only when the sliding velocity gets lower than 20 mm/s. As mentioned in Section 2.2, the currents are independent of the velocity, at least up to 1 m/s, or 2 mm in 2 ms. This means that the current actually reaches the value i0 in less than 2 ms.
4. Results
This section will comprise results obtained on ice deposited in a volcanically quiet period, and in periods of violent volcanism. Most of the data are derived from the absolute-dated Crête core.
4.1. Absolute dating
In Figure 3 the two current profiles (upper part) from A.D. 1516 to 1523 have been combined into one (mid section) with a resolution averaging 12 data points per annual layer.
The basis for the absolute dating of the Crête core is an 18O concentration (δ18O) profile in the core (Reference Hammer, Hammer, Clausen, Dansgaard, Gundestrup, Johnsen and ReehHammer and others (1978)). Owing to diffusion processes during the firnification, the δ profile is considerably smoothed relative to the original seasonal δ variations in the deposited snow, which can be re-established, however, to a first-order approximation by a combined ice flow model and deconvolution technique (Reference JohnsenJohnsen, 1977). The resulting profile in the lower section of Figure 3 indicates that the core increment considered here comprises seven full annual layers, and counting annual δ cycles downward from the surface shows that the increment was deposited from the summer of a.d. 1516 to the summer of a.d. 1523.
The high summer δ values obviously match high currents. There are several possible reasons for the acidity being higher in summer snow than in winter snow in pre-industrial time. One of them is that considerable amounts of H2S (some 2 × 10⁸ tons/year according to Reference JungeJunge (1963, p. 70)) are released to the atmosphere from particular sea and coast areas. By photochemical reactions, etc., the H2S is oxidized, and part of it ends up as an H2SO4 aerosol. This is subsequently washed out by precipitation. In summer, the release of H2S and the intensity of light available for its oxidation is higher than in winter, while at the same time the wash-out of H2SO4 from moist air masses prior to their arrival in Greenland is lowest in summer.
There are probably other contributing factors to the seasonal acidity variations observed in Greenland, but most essential for the present work is the fact that these variations are easy to measure on an ice core, and they may therefore serve as a valuable means for stratigraphic dating, or at least for cross-checks of other methods, such as the δ(18O) method. In cases of violent volcanic eruptions, the extra input of acids to the atmosphere sometimes disturbs the seasonal acidity pattern in the precipitation.
Other features available for absolute dating are the high acidities in layers deposited soon after well-known, violent volcanic eruptions in the Northern Hemisphere. If the acidity reaches unusually high levels, these layers may be used as reference horizons. One example is the A.d. 1783 layer with debris from the Icelandic Laki eruption (Reference HammerHammer, 1977). Other examples will be mentioned in Section 4.2.
It should be added that these reference horizons are easy to detect in the field, even without a core. In the 1977 GISP season, several 100 m holes were drilled with a new core drill (Reference Johnsen, Johnsen, Dansgaard, Gundestrup, Hansen, Nielsen and ReehJohnsen and others, 1980). A simple device (a set of springs pressing the electrodes softly against the hole wall) was attached to the cable. The voltage was applied through the internal conductors, and the current signals were recorded at the surface, while hoisting the device up and down the hole. Since the ice was not freshly cut and, furthermore, the roughness of the wall caused poor contacts, the signal was more noisy than usual, but the Laki eruption stood out clearly, as well as other well-known volcanic events.
It should finally be emphasized that no increase in the bulk micro-particle concentration has been observed in any volcanic fall-out in Greenland.
4.2. Volcanic eruptions
As mentioned in the Introduction, a continuous profile of specific conductivity σ measured on melted samples along an ice core reveals the volcanic activity in the Northern Hemisphere, due to fall-out of soluble impurities originating from volcanic eruptions, i.e. H2SO4, HCl, HF, H2SiF6, etc. or salts of these acids. Some of the acid injection into the atmosphere is neutralized, mainly in the troposphere, forming various salts, of which the ammonium salts are probably the most important component in the fall-out of volcanic salts in Greenland, because tropospheric ammonia is the only source of a basic reacting compound able to neutralize substantial amounts of volcanic acids in the middle and upper troposphere, as indicated by the low background concentrations in ice of, e.g. Ca, Na, K, and Mg (Reference Langway, Langway, Klouda, Herron and GraginLangway and others, 1977). Unfortunately little is known about NH3 concentrations in polar air.
The degree of neutralization must therefore be expected to be higher if the volcanic material is transported to Greenland via the troposphere (in cases of high-latitude eruptions of moderate violence), than if the transport takes place mainly via the stratosphere (Northern Hemisphere eruptions), which is poor in ammonia (Reference Junge, Derco and TruhlarJunge, 1974). Acid as well as neutralized fall-out contribute to the specific conductivity of melted ice, whereas the current measured on solid ice as described in Section 2, is essentially an acidity index. In case of a high degree of neutralization, non-violent high-latitude eruptions may therefore be missing in a current profile along a Greenland ice core (non-violent low-latitude eruptions certainly are, owing to wash-out during the long transport in the troposphere). Another reason for a signal being lost could be a generally basic reaction of the ice, cf. Section 4.2.1. On the other hand, the main ice sheet in Greenland is generally acidic, and experience shows that the fall-out from volcanic eruptions always results in layers of elevated acidities, at least in the last 200 years. The only report of an exception (the Aleutian eruptions in 1795-96; cf. Reference HammerHammer (1977)) has later been shown to be based on analyses of a contaminated increment of the Crête core.
4.2.1. Katmai (Alaska), 1912
The detection of this eruption in an ice core from Hans Tavsen ice sheet, Peary Land, drilled with a Swiss shallow drill (Reference Rufii, Rufli, Stauffer, Oeschger and SplettstoesserRufli and others, [c1976]) by GISP in 1974 is particularly interesting. In contrast to the Greenland ice sheet, the Hans Tavsen ice is slightly basic in general, when the CO2 effect is corrected for. The ice core is only dated theoretically (Reference Dansgaard and JohnsenDansgaard and Johnsen, 1969), and the time scale turned out to be approximately one year off, because the signal rose in the layer dated at 1911. This has been corrected in Figure (5). The volcanic fall-out caused acidities (shaded) up to 5.2 μ equiv. H+/kg (4.8 μequiv. H+/kg at Crête) half a year after the onset of the eruption. After approximately 1.5 years the volcanic fall-out was too low or not acid enough to keep the precipitation acid. The heavy curve in Figure (5) shows that the current signal, obtained as described in Section 2, rises and dies out simultaneously with the acidity. The background salt content is almost an order of magnitude higher than at Crête, and yet the current (≈ 0.6 μA), in the neutral or basic ice deposited before and after the volcanic fall-out is an order of magnitude lower than in the corresponding, slightly acid ice at Crete (c. 7 μA), showing that the contribution of salts to the current is orders of magnitudes lower than that of protons. At Crête, the salt content in ice deposited during the Katmai eruption rose by a factor of five making the ratio of acid to salt (H+/X+) as low as 0.6. This may be explained by a high degree of neutralization of volcanic acids in the troposphere, because a substantial part of the acid gases did not reach the stratosphere, perhaps disregarding the first explosive phase of the eruption (cf. Reference MacdonaldMacdonald, 1972, p. 240–42).
4.2.2. Tambora (Indonesia), 1815
One of the greatest aerosol/gas injections into the stratosphere, at least since a.d. 1500 (Reference LambLamb, 1970). It is revealed in the absolute-dated Crête core as shown in Figure 6. The time lag of approximately one year is due to the long travel time of the eruption cloud on its way from low latitudes via the stratosphere to Greenland. Material injected into the low latitude troposphere never reaches Greenland due to wash-out. Therefore, only the stratospheric injection contributes to the fall-out in Greenland, and that only after considerable spreading. These are the reasons why the peak values of current and acidity are only twice as high as those of the much smaller Katmai eruption. The salt content (c. 2.7 μequiv./kg) is only slightly higher than the background value (c. 2 μequiv./kg) indicating a low degree of neutralization of volcanic acids, which is to be expected when they spend only a short time in the lower troposphere during their travel to Greenland. The mean current and acidity levels in the three years prior to 1816 are the same as those found in the Crête core through the volcanically quiet period 1920–60, and close to those for 1516–23 (Fig. 3).

Fig. 5. Acidity (shaded, scale on top) and current profiles along a core increment from the Hans Tavsen ice cap in Peary Land (82.5° N.), including the 1912 layer with acid fall-out from the eruption of Katmai, Alaska.

Fig. 6. Acidity (shaded, scale on top) and current profiles along the A.D. 1814–20 increment of the Crête core with acid fall-out from the great 1815 eruption of Tambora, Indonesia. The approximately 1 year time lag is dtu to the long distance to Greenland.
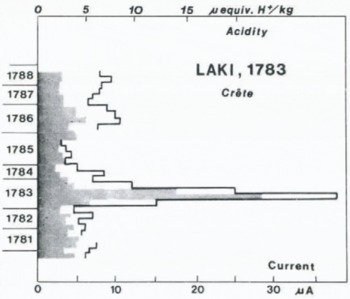
4.2.3. Laki (Iceland), 1783
One of the greatest lava extrusions on Earth in historical time (c. 12 km3, Reference ThorarinssonThorarinsson (1969)). Figure 7 shows the acidity and current variations in the a.d. 1781–88 increment of the Crête core. The peak values in the 1783 layer are higher than any others in the last thousand years, which makes the 1783 layer an easily detectable reference horizon all over Greenland (Reference HammerHammer, 1977). The acid fall-out lasted less than a year, and the elevated acidity level in the adjacent years is due to other volcanic activity. New measurements have shown that at least 50% of the acid fall-out was H2SO4, the total cation concentration in the peak consisting of 23 μequiv. H+/kg and 11 μequiv. X+/kg, which accounts for the measured 23 μquiv. SO4 – /kg and only 11 μequiv./kg of other anions (probably Cl–, cf. Section 4.2.5)
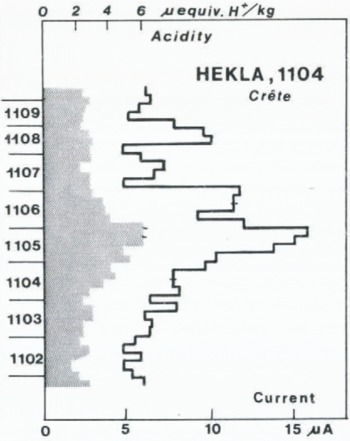
4.2.4. Hekla (Iceland), 1104
One of the greatest Hekla eruptions in historical time. The onset of the signals shown in Figure 8 occurs in a layer, originally dated at a.d. 1105. No other signal high enough to be indicative of a high northern-latitude eruption of considerable magnitude occurs in the ice deposited from a.d. 1060 through a.d. 1170. The signals in Figure 8 must therefore be interpreted as fall-out from Hekla 1104, and the original time scale has been corrected accordingly by –1 year, assuming very short time lag in view of the proximity of Hekla to Crête. According to Reference ThorarinssonThorarinsson (1949) the eruption was explosive, and the nearly three years’ duration of acid fall-out at Crête (Fig. 9) shows that the eruption cloud must have reached far up into the stratosphere. This agrees with the salt content being close to the background value, suggesting mainly stratospheric transport.
4.2.5. Eldgjá (Iceland)
According to S. Thorarinsson (personal communication), Eldgjá had a violent eruption, most probably of the same magnitude as Laki 1783, some time in the period a.d. 830–950, probably after a.d. 900. The a.d. 934 layer at Crête is the only one within the 830–950 period that gives a signal as high as that of Laki 1783 (cf. Fig. 2). At least 65% of the acid fall-out was HCl, the total cation concentration in the peak consisting of 22 (μ equiv. H+/kg and 27 μ equiv. X+/kg, which accounts for a measured 41 μ equiv. Cl–/kg and only 8 μ equiv. SO4 – – / kg (cf, Laki 1783, Section 4.2.3). Further details will be reported elsewhere, jointly with S. Thorarinsson and G. Larsen.

Fig. 7. Acidity (shaded, scale on top) and current profiles along the A.D. 1781–88 increment of the Crête core with acid fall-out from the 1783 eruption of Laki, Iceland.

Fig. 8. Acidity (shaded, scale on top) and current profiles along the A.D. 1102–09 increment of the Crête core with acid fall-out from the 1104 eruption of Hekla, Iceland.

Fig. 9. Left: Mean acidity of c. 1.5 m increments of the Camp Century ice core spanning the period 1190–1830±50 B.C. Right: Detailed acidity profiles along the four 1.5 m increments containing the highest acidity peaks. The very highest one is probably due to fall-out from the great, historically well known but poorly dated eruption of Thera (Santorin), Aegean Sea, that appears to have occurred 1390±50 years B.C., according to the non-absolute dating of the Camp Century ice core (Reference Hammer, Hammer, Clausen, Dansgaard, Gundestrup, Johnsen and ReehHammer and others, 1978).
4.2.6. Thera I Santorin (Aegean Sea)
The well known great eruption of Thera took place some 1500 years b.c. and perhaps played a role in the destruction of the Minoan empire (Reference MarinatosMarinatos, 1939). The caldera is more than five times greater than that of Krakatoa, the ash layer (10–40 m) up to 100 times thicker. The eruption is therefore believed to have been at least of the same magnitude as Tambora a.d. 1815, i.e. perhaps one of the greatest on Earth in historical time. Hence, it should be detectable in the Greenland ice, in particular because it occurred at higher latitude (38° N.) than Tambora (8° S.). So far historical and archaeological evidence (cf. Reference MarinatosMarinatos, 1950; Reference PagePage, 1970), and 14C analyses (Reference Olson and BroeckerOlson and Broecker, 1959) have not led to a precise dating of the eruption, yet it is agreed to have taken place between 1700 and 1300 b.c. The Camp Century ice core is the only Greenland core available for a search for fall-out from Thera. Due to the small amount of ice available for these analyses, and to the generally poor quality of the Camp Century deep core, current profiles are encumbered by relatively high scatter on values close to the background. In order to suppress the background scatter, the current profiles are given here in terms of acidities derived from the broken curve in Figure 2. The profile to the left in Figure 9 gives mean acidity values in approximately 1.5 m increments, each of which spans some 12 annual layers. According to the (non-absolute) dating of the Camp Century core (Reference Hammer, Hammer, Clausen, Dansgaard, Gundestrup, Johnsen and ReehHammer and others, 1978, p. 20) the total profile spans the period 1195–1825±50 years b.c., and it should therefore include fall-out from the Thera eruption. The four increments containing the highest peaks are shown in greater detail to the right. Only one of them is big enough to be interpreted as fall-out from an unusually great eruption at mid latitudes such as that of Thera which may therefore be dated at 1390±50 b.c. It is one of the 15 highest Holocene signals at Camp Century, of which several are undoubtedly due to smaller high-latitude eruptions, and no other signal of nearly this magnitude is found between 1100 b.c. and 2900 b.c. The acidity peak value, 5.0 μequiv. H+/kg (from a pH measurement on part of the peak sample in Fig. 9), corresponds approximately to a measured 54±0.6 μequiv. SO4 – – /kg, which suggests that most of the acid fall-out was H2SO4. However, the material available was too sparse to prove this statement, and more accurate chemical analyses on the remaining part of the core are needed.
4.3. Internal radio-echo layers
As previously suggested (Reference HammerHammer, 1977) the high acidities of layers containing volcanic fall-out influence the dielectric constant of the ice sufficiently to make such layers a possible explanation of the internal reflection horizons encountered in radio echo-sounding (Reference Robin, Robin, Evans and BaileyRobin and others, 1969; Reference GudmandsenGudmandsen, 1975) and hence chronological reference horizons (Reference Wiss, Weiss, Bertine, Koide and GoldbergWhillans, 1976).
This explanation is further supported by the analyses in this work, in so far as the four most acid layers hitherto found in the Crête core, i.e. at 75 m true depth (Laki, 1783), 220 m (probably Iceland, c. 1260), 241 m (Katla, 1179?), and at 306 m (Eldgjá, 934) are all associated with strong radio echoes within the ±5 m uncertainty on the depth estimates (Reference Gudmandsen and OvergaardGudmandsen and Overgaard, 1978, Fig. 4, in which the latter echo has been overlooked, according to a personal communication, cf. their Fig. 3)
5. Conclusions
Most, if not all violent volcanic eruptions that have occurred in the Northern Hemisphere in the last 10 000 years can be detected by moving two electrodes with some 1000 V potential difference along the cleaned surface of an ice core. Elevated current signals indicate acid fall-out, mainly H2SO4 and HCl. The four most acid layers in the Crête core are found at depths giving strong radio echoes, which suggests volcanic fall-out as the cause for the internal reflections. In non-volcanic periods, the current varies with the season of deposition of the ice, which may be used as a back-up for other methods for absolute dating.
Acknowledgements
The author is indebted to W. Dansgaard for enthusiastic help with the manuscript and for many valuable suggestions, to Henrik B. Clausen for his never-ceasing energetic help during the measurements, and to C. C. Langway, Jr, for permitting us to measure a continuous profile along the Camp Century deep core, which will later be the subject of a joint paper.
The work was supported by grants from the Ministry of Greenland and took place within the framework of GISP.