


Introduction
Relationships between climate-induced glacier change and runoff yield have been the concern of several studies (e.g. Reference Braun, Weber and SchulzBraun and others, 2000; Reference Aizen, Aizen and KuzmichenokAizen and others, 2007; Reference Huss, Farinotti, Bauder and FunkHuss and others, 2008; Reference Masiokas, Villalba, Luckman, Lascano, Delgado and StepanekMasiokas and others, 2008; Reference Mernild, Hashold and ListonMernild and others, 2008) and reports (e.g. Reference Bajracharya, Mool and ShresthaBajracharya and others, 2007; Reference Bates, Kundzewicz, Wu and PalutikofBates and others, 2008). Climate-induced water-resource shortages pose an urgent problem in some arid and glacier-meltwater supplied regions (Reference Kaser, Juen, Georges, Gomez and TamayoKaser and others, 2003), for example in northwest China (Reference Shi and ZhangShi and Zhang, 1995; Reference Yao, Wang, Liu, Pu, Shen and LuYao and others, 2004). In some glacierized high-mountain regions exhibiting recent glacier fluctuations due to climate warming, local hydrological and ecological environments are experiencing remarkable changes (e.g. Reference Ruiz, Moreno, Gutierrez and ZapataRuiz and others, 2008; Reference MooreMoore and others, 2009), generally accompanied by a high frequency of natural hazards (Reference Richardson and ReynoldsRichardson and Reynolds, 2000; Reference Kääb, Reynolds, Haeberli, Huber, Bugmann and ReasonerKääb and others, 2005), such as glacier lake outburst floods (Reference Cenderelli and WohlCenderelli and Wohl, 2003; Reference Ng, Liu, Mavlyudov and WangNg and others, 2007) or glacier-induced debris/mud-flows (Reference Stoffel and BenistonStoffel and Beniston, 2006; Reference Chiarle, Iannotti, Mortara and DelineChiarle and others, 2007).
Monsoon temperate (or maritime) glaciers are more active than cold or continental glaciers, and are characterized by high accumulation and ablation and high mass-balance amplitude (Reference Braithwaite and ZhangBraithwaite and Zhang, 2000; Reference He, Zhang, Theakstone, Chen, Yao and PangHe and others, 2003; Reference Kaser, Cogley, Dyurgerov, Meier and OhmuraKaser and others, 2006). Reference Braithwaite and ZhangBraithwaite and Zhang (1999) found that there is a clear relationship between glacier mass-balance sensitivity and amplitude. Glaciers in arctic and continental regions (e.g. the high mountains of Asia), with small mass-balance amplitudes, have a low sensitivity, whereas monsoon temperate glaciers have higher sensitivity (Reference Braithwaite and ZhangBraithwaite and Zhang, 1999), leading to high local hydrological variability with regional climate change.
Monsoon temperate glaciers in China are mainly distributed in the southeastern part of the Qinghai–Xizang (Tibetan) Plateau (Reference Shi and LiuShi and Liu, 2000), with an area of 13 200 km2 and accounting for 22.2% of China’s total glacier area (Reference Shi, Liu, Ye, Liu and WangShi and others, 2008). These glaciers are more sensitive to climatic changes than polar or continental glaciers (Reference Shi and LiuShi and Liu, 2000; Reference Liu, Ding, Li, Shangguan and ZhangLiu and others, 2006). Since the maximum extent during the Little Ice Age, the area covered by monsoon temperate glaciers in China has decreased by 3920 km2 (Reference Su and ShiSu and Shi, 2002). With a decrease in precipitation, glacier retreat will be even faster (Reference Shi and LiuShi and Liu, 2000). During prolonged periods of net mass loss, specific runoff will first increase until the glacier has retreated, then the decrease in glacier area will lead to reduced flow rates (Reference Braun, Weber and SchulzBraun and others, 2000; Reference Jansson, Hock and SchneiderJansson and others, 2003).
Most temperate glaciers on Mount Gongga have retreated continuously throughout the 20th century (Reference Su and ShiSu and Shi, 2000). After a relatively slow or stationary retreat of the terminus during the 1970s, Hailuogou glacier underwent accelerated recession in response to increasing climatic warming since the mid-1980s (Li and others, in press). Reference HeimHeim (1936) first reported the glaciers in Mount Gongga after his expedition to Sichuan, China, in 1930. Based on his description of the terminal position and by comparing aerial photos and field investigations, Reference Su, Liu, Wang, Shi, Xie and KotlyakovSu and others (1994) and Reference HeHe and others (2008) concluded that Hailuogou glacier retreated 1150 m during the period 1930–66, 200 m during 1966–83, 147 m during 1983–89, 274 m during 1990–2004 and 50 m during 2004–06. The first systematic Glacier Inventory of China in the Gongga mountain ranges was based on topographic maps (Reference PuPu, 1994, p.117–129) derived from aerial photographs acquired in 1960 by the Chinese military geodetic service. Mass-balance measurements conducted during 1990–98 showed that Hailuogou glacier had an average mean specific mass balance of −6.41 m during that time (Reference Zhang, Su, Li and ZhongZhang and others, 2001). However, these measurements were conducted only in the lower ablation areas. In the accumulation areas, the available data are much sparser because of the steep topography and difficulty in accessing the glacier accumulation areas.
On the catchment scale, no previous studies have assessed glacier change impacts on local hydrological regimes in this monsoon-controlled environment. This study presents the result of a remote-sensing based investigation of the recent recession of seven glaciers in a catchment located on the east slope of Mount Gongga. We analysed the variation over a decade of runoff from the glacierized catchment, by comparing it with runoff of an adjacent nonglacierized catchment. We then calculated the glacier catchment hydrological balance, relating it to recent changes in climatic conditions and glacier mass loss.
Study Area
Mount Gongga (or Minya Konga; 29.6° N, 101.9° E) is located in the centre of the Hengduan Shan on the southeastern edge of the Tibetan Plateau. There are 74 glaciers distributed around Mount Gongga (Reference PuPu, 1994, p. 117–129), which is within the Indo-Chinese region of monsoons prevailing in the summer (Reference Aizen, Loktionova, Xie and KotlyakovAizen and Loktionova, 1994). The glaciers are noted as summer-accumulation type (Reference Su, Song and CaoSu and others, 1996; Reference Shi and LiuShi and Liu, 2000; Reference Xie, Su, Shen and FengXie and others, 2001).
Hailuogou glacier is the largest valley glacier on the east slope of Mount Gongga. It is labelled ‘glacier No. 3’ (Reference Shi, Liu, Ye, Liu and WangShi and others, 2008) in the Hailuogou catchment (HLG), above the town of Moxi (Fig. 1). In 1994 it was 12.16 km long and 250–1200 m wide, with an area of 24.83 km2. It comprises a cirque-shaped accumulation area from 7556 to 4980 m a.s.l., a nearly 1300 m high icefall from 4980 to 3700 m a.s.l., and a glacier tongue stretching into forest at 2990 m a.s.l. The six other glaciers in the HLG catchment are much smaller (Table 1).

Fig. 1. Map showing catchment location (inset) and glacier distribution (glacier extent is based on the First Glacier Inventory of China and 1994 Landsat TM). Black squares a and b are runoff gauge stations for the HLG and HBLG catchments respectively. Black triangle shows location of meteorological station monitored by the Chinese Ecological Research Network (CERN). Contours show elevation (m a.s.l.) at 100 m intervals.
Table 1. Geomorphologic characterization of seven glaciers in the HLG catchment. Glacier extent is based on 1994 Landsat TM image, DEM is based on 1989 topographic map (see Table 3)
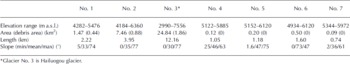
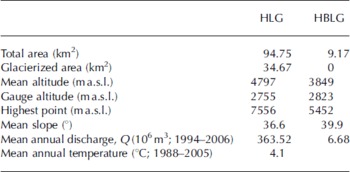
The HLG catchment altitude ranges from 2756 to 7556 m, with a mean elevation of 4714 m. It covers an area of 94.75 km2, of which 34.67 km2 (36.6%) was glacierized in 1994. The non-glacierized area of the catchment is mainly forested by Faber’s Fir (Abies fabri Craib; Reference Shen, Lui and FankShen and others, 2004). In addition to this highly glacierized catchment, a small non-glacierized but forested catchment, the Huangbengliugou catchment (HBLG) northeast of Hailuogou glacier (‘Gauged sub-basin’ in Fig. 1), is also hydro-analysed in this study. The basic geographical and hydrometeorological characteristics of the two studied catchments are listed in Table 2.
Table 2. Main characterizations of the HLG and HBLG catchments
Data and Methods
Glacier inventory
Within the working group of the Second Glacier Inventory of China, we have recently used new-generation remote sensors such as the Advanced Spaceborne Thermal Emission and Reflection Radiometer (ASTER) and the Landsat Thematic Mapper/Enhanced Thematic Mapper Plus (TM/ETM+) to identify glacier changes in many areas. However, most images of Mount Gongga suffer from snow, shadow and cloud contamination. As a validation and extension of remote-sensing methods, we carried out detailed GPS measurements in 2008, which covered the lower ablation areas of Hailuogou glacier (Fig. 2a). The measurements were conducted using real-time kinematic (RTK) GPS technology. Similar fieldwork was also carried out at other glaciers in China (e.g. Xiao Dongkemadi glacier (Reference Shangguan, Liu, Ding, Zhang, Du and WuShangguan and others, 2008)).

Fig. 2. (a) RTK-GPS measurement tracks (grey points) with base reference points (dark points) and (b) DEM difference elevation changes in the lower ablation area of Hailuogou glacier tongue.
The area and boundaries of glaciers in the HLG catchment were derived from topographic maps of 1966 and 1989, Landsat images of 1975 and 1994, and ASTER images of 2007 (Table 3). The raw L1A ASTER images were orthorectified using ENVI software. Ground-control points were collected from the 1989 topographic map identified on ASTER images. A digital elevation model (DEM) based on the 1989 topographic map was used to make a topographic correction for ASTER images data. GPS survey data define the 2008 outline of the Hailuogou glacier tongue, and were used to generate a DEM of the glacier surface with a pixel resolution of 15 m and vertical accuracy of ±0.19 m (Reference Zhang, Fujita, Liu, Liu and WangZhang and others, 2010). Using the GPS-derived DEM-2008 minus the topographic-map derived DEM-1989, the elevation changes in the lower ablation area of Hailuogou glacier are shown in Figure 2b.
Table 3. Topographic maps and satellite remote-sensing data

All datasets were spatially referenced to the local Universal Transverse Mercator coordinate system (UTM zone 47N, WGS84) and were incorporated as grids into a Geographical Information System database for analysis. Glaciers were visually interpreted and outlines were manually delineated. The 2007 outline of the Hailuogou glacier tongue was shape-adjusted by GPS points from 2008 fieldwork. Error estimation is quantified based on the image spatial resolution or map scale (1 : 100 000 and 1 : 50 000 are equated respectively to spatial resolutions of 30 and 15 m in pixel size). To calculate changes between two images, an average spatial resolution of these two maps is assumed for error determination.
Hydro-climatic observations
Meteorological and hydrological data were measured by Gongga Alpine Ecosystem Observation and Research Station (GAEORS), Chinese Ecological Research Network (CERN; http://www.cern.ac.cn). Two meteorological stations (Fig. 1) were established at 3000 and 1600 m a.s.l. close to the glaciers and have been monitored since 1988 and 1991 respectively. Precipitation, temperature, evaporation, humidity, radiation, etc., were collected at these stations. Temperature and precipitation lapse rates were calculated between 1600 and 3000 m a.s.l. The total area of the catchment was divided into a glacierized catchment (the HLG catchment) and a lower non-glacierized catchment (the HBLG catchment). Runoff of the HLG and HBLG catchments was gauged from 1994 and 1995 respectively, to 2006. We present the continuous daily streamflow data (Fig. 3) for the glacierized HLG catchment for the period 1994–2005 and for the nonglacierized HBLG catchment for the period 1995–2005. Climatic records from the 3000 m meteorological station from 1988 to 2005, including mean daily air temperature and precipitation, are also shown in Figure 3.

Fig. 3. Raw data recorded by the CERN showing evolution of (a) daily mean air temperature and precipitation at 3000 m, (b) mean discharge rate from HLG (black) and HBLG (grey) catchments and (c) annual (black bars) and summer (July–September; white bars) discharge.
Catchment water balance
A remarkable increasing trend in runoff from the HLG catchment is shown in Figure 3c. The water balance of this glacierized catchment was calculated to show how glacier mass loss contributes to runoff. The elements of water balance for a watershed depend upon watershed characteristics and processes. The usual formulation of the water-balance equation for a glacierized catchment is
where P is precipitation input from snow and rain, E is evaporation/sublimation output, R is runoff, ΔG is change in water storage with the catchment from glacier and groundwater and η is the balance discrepancy (error term).
Reference Mark and SeltzerMark and Seltzer (2003) assumed that evaporation and condensation over the glacier surface are zero or cancel each other out and that groundwater discharge is negligible. In monsoonal temperate conditions over the glacier, net evaporation and condensation is negligible. However, evapotranspiration (ET) from the forested non-glacierized region should be reassessed in the water-balance calculation. According to a modelling result of Reference Cheng and GuirongCheng and Guirong (2003), mean monthly ET is about 20% of precipitation. In the HLG catchment, precipitation was regularly observed at the 3000 m weather station, but the observation excludes the horizontal precipitation, a component recently estimated by Reference Cheng, Xinxiao and YutaoCheng and others (2002) to comprise about 7–10% of annual precipitation in this region. High horizontal precipitation and condensation, dew and hoar-frost in the forest area reduce the errors to a certain extent, without taking into account ET in the water-balance calculation. Loss to the groundwater system and liquid water storage in the glacier system is not considered significant. This error was small compared to the observed precipitation, glacier- and snowmelt and runoff.
Neglecting ET, liquid water storage within the glacier system and groundwater, semiquantification of the contribution of glacier meltwater to the runoff is achieved by separating the daily rainfall component, P, from the daily total discharge, Q, observed at the gauge site. Based on the method of Reference Mark and SeltzerMark and Seltzer (2003), a basic water-balance model with monthly discharge from the HLG glacierized catchment and total monthly precipitation were used to compute the change in glacier storage from 1994 to 2005. The change in monthly glacier storage, ΔG, is given by
where Pi (mm) is the total monthly precipitation over the elevation band i (i = 1−10), Si (mm2) is the area of i, and Q h (mmw.e.) is depth calculated from the discharge rate, ΔQ (m3 s−1), over the specific time interval (∼1 month here) and normalized by the area of the glacierized catchment.
To calculate Pi for each elevation band, the catchment (2755–7556 m a.s.l.) was divided into ten elevation zones from 3000 to 7500 m, spacing at 500 m. Generally, mountain precipitation increases to a maximum at a transition height, then declines with increasing elevation. The transition height is about 3000 m in the Eastern Himalaya, and higher in the Karakoram mountains (Reference BarryBarry, 2008). However, Reference ChengCheng (1996) reported that a maximum precipitation at about 3000 m (or higher) does not seem applicable in our study region. Annual precipitation continues to increase with elevation increase (Fig. 4a). Precipitation lapse rate was calculated monthly based on the 1600 and 3000 m meteorological station records. Using these monthly lapse rates, the precipitation of the total basin was then the area-weighted sum of the precipitation over each elevation band. Figure 4b shows the calculated monthly precipitation for the total basin, as an average value from 1994 to 2005.

Fig. 4. (a) Annual precipitation variation with elevation according to the results of Reference ChengCheng (1996). (b) Calculated average monthly precipitation (1994–2005) over the total catchment, and precipitation at 1600 and 3000 m.
Results
Glacier changes
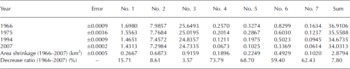
Total glacier area in the HLG catchment decreased by 2.9 km2 (7.8%), from 36.9 km2 in 1966 to 34.0 km2 in 2007. In particular, small glaciers (especially those on south-facing slopes) show a significant shrinkage (Fig. 5; Table 4). For instance, the area of glacier No. 4 decreased by 73.8% during the study period. Conversely, the change in area of larger glaciers, with sufficient accumulation area at high elevation, is less pronounced. The surface area of Hailuogou glacier decreased by only 0.92 km2 (3.6%) during our study period.

Fig. 5. (a) Surface-area changes of glaciers in the HLG catchment, 1966–2007. (b) Retreat of Hailuogou glacier terminus since 1930; the 1930 outline is based on Reference HeHe and others (2008) from Reference HeimHeim (1936). (c) Band 1 of ASTER images (15 m resolution) in 2007 showing Hailuogou glacier terminus, and trimlines (white dashed) showing glacier shrinking.
Table 4. Glacier area change since 1966 (km2)
The terminus retreats of Hailuogou glacier were 295 ± 60, 252 ± 45 and 181 ± 23 m for the periods 1966–75, 1975–94 and 1994–2007 respectively. Our results agree well with those of Reference Su, Liu, Wang, Shi, Xie and KotlyakovSu and others (1994) and Reference HeHe and others (2008), which were based mostly on field investigations. The agreement is better in recent years, since the spatial resolution of the sensors has been improved (Fig. 6).

Fig. 6. Terminus retreat distance history since 1930 based on remote sensing and results of previous studies.
For glacier ice thinning, Zhang and others (2009) present recent ice-velocity and elevation changes over the ablation area of Hailuogou glacier. They indicate that the mean rate of surface elevation change over the ablation area for the 43 years 1966–2009 is −1.1 ± 0.4 m a−1; since 1989, glacier thinning has significantly accelerated. The thinning rate increases from 1966 to 2008. In the lower reaches, net glacier thinning as a fraction of the total thickness is larger than glacier area loss as a fraction of total glacier area (Fig. 2b).
Changes in climatic conditions and runoff
As indicated by Figure 7, based on the record from the 3000 m meteorological station, mean daily air temperature and minimum temperature show significant increases from 1988 to 2005, at rates of +0.2°C (10 a)−1 and +0.4°C (10 a)−1 respectively. The mean daily diurnal air-temperature range decreased by −0.4°C (10 a)−1.

Fig. 7. Variations of (a) mean daily air temperature, (b) mean daily minimum temperature, (c) mean daily diurnal range of air temperature and (d) positive degree-day sum (°C) at the 3000 m meteorological station (1988–2005) and calculated annual precipitation (mm) for the HLG catchment (1994–2004), based on the 3000 m meteorological station data (1988–2005).
Data presented in Figure 3b indicate that runoff of the HLG catchment shows a continuously increasing trend from 1994 to 2005, while for the HBLG catchment (non-glacierized) there is a slightly decreasing trend. These trends can be easily recognized from the total annual and summer (July–September) runoff variations (Fig. 3c). Annual discharge in the HLG catchment shows a dramatic increase from 232.4 × 10⁶ m3 (1994) to 684.5 × 10⁶ m3 (2007). In particular, total discharge during the summer also exhibited a significantly increasing trend during 1994–2005. The remarkably warm summer in 1998 did not lead to a significant increase in runoff. It is possible that higher temperatures in 1998 were offset by lower precipitation (Fig. 7d). A significant increase occurred in 1999, probably due to the global extreme climate event of 1997/98 (Reference Parker and HortonParker and Horton, 1999), which is also represented in Figure 7a and b.
Changes in water balance in the glacierized catchment
For the HLG catchment, glacier storage was calculated monthly from 1994 to 2005 based on Equation (1) (Fig. 8). Basin precipitation is the only component showing no significant trend over this period, whereas the change in glacier storage leads to continuously rising discharge amounts. The change in glacier storage, ΔG, provides an estimate of the mean monthly contribution of glacier melt to stream discharge. Positive values of ΔG represent storage gain (net accumulation), and negative values represent storage loss (net melt) (Reference Mark and SeltzerMark and Seltzer, 2003). Net melting usually occurs during the ablation season despite the catchment experiencing high precipitation in summer (Reference Xie, Su, Shen and FengXie and others, 2001). From Figure 7, extremely high precipitation during summer 1997 induced positive storage gain: calculated ΔG was positive during the whole year. Since 1999, however, consecutive negative ΔG values have occurred, with a maximum glacier storage loss of 1209 mm in August 2003.
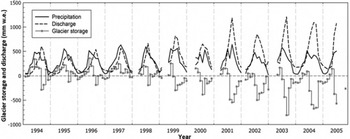
Fig. 8. Monthly glacier storage and discharge, 1994–2005.
Discussion
The difference between the glacierized and non-glacierized catchments is that the runoff derived from the non-glacierized catchment is precipitation-dominated while the glacierized catchment is energy-dominated (Reference Chen and OhmuraChen and Ohmura, 1990). The main contributions to runoff in the catchments are glacier- or snowmelt and rainfall. Of a mean annual precipitation of 1956 mm from 1988 to 2005, an average of 79.9% is concentrated in the ablation season (May–October) and 43.9% in the summer season (July–September) (Fig. 9a). Due to the summer-monsoon dominated climatic conditions (concurrence of ablation and precipitation) on Mount Gongga, the HLG and HBLG catchments have similar annual runoff distribution patterns (Fig. 9b). Over the whole ablation season, in terms of volume, the total discharges for the HLG and HBLG catchments were 306.58 × 10⁶ and 5.26 × 10⁶ m3 respectively, accounting for about 80% and 82% of the mean annual discharges of 363.52 × 10⁶ and 6.68 × 10⁶ m3 respectively. A slightly larger offset (∼1 month) between maximum precipitation and runoff of the HBLG catchment (see Fig. 9a) indicates that the water conservation function of the forest is significantly more evident in the non-glacierized catchment than in the glacierized catchment.
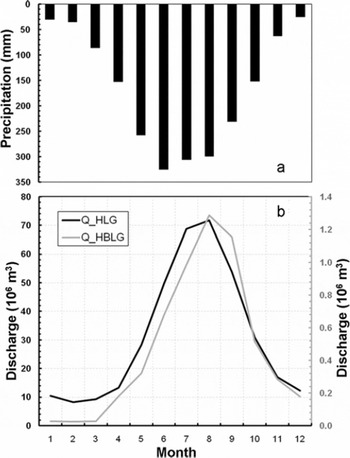
Fig. 9. Intra-annual distribution of (a) precipitation and (b) monthly total discharge of HLG (dark curve) and HBLG (grey curve) catchments, averaged over the period 1994–2005.
We found interannual changes in the water-balance terms as presented in Figure 10 (changes in evaporation and/or sublimation and groundwater were neglected). For missing measurements of runoff during some winters between 1998 and 2003, we interpolate by considering a mean discharge proportion of the annual value for each month. During the calculation period (1994–2004), cumulative loss of glacier storage was 5.93 m w.e. (6.59 m ice).

Fig. 10. Interannual change in glacier storage, precipitation and discharge, 1994–2005.
Ice elevations from DEMs show highly accelerated ice thinning in the lower ablation area of Hailuogou glacier in recent years (Zhang and others, 2009). Ice thinning in the lower part of the ablation area is the main glacier shrinking process, compared with terminus retreat (1.5%) and surface area decrease (3.5%). The thinning accounts for ∼30% of local ice thickness (an average of 125 m measured in 1994; Reference Huang, Wang, Song, Li and ShenHuang and others, 1996). Considering that the thinning rate in the upper part of Hailuogou glacier was less than −1. ± 110.4 m a−1 (1966–2009) but has accelerated in recent years (Reference Zhang, Fujita, Liu, Liu and WangZhang and others, 2010), we assume the total glacier thinning rate was ∼0.5 ± 0.4 to 0.7 ± 0.4 m a−1 during our water-balance calculation period, 1994–2004. That is, the mean total glacier elevation has decreased by ∼5–7 m. This result compares well with that of the water-balance approach (thinning of 6.59 m ice) and indicates that our method of calculating water balance without considering changes in evaporation and/or sublimation and groundwater is probably acceptable.
Given no glacier-wide mass-balance monitoring networks (ablation stakes have been drilled only in the lower ablation part of the glacier), we are still investigating modelling approaches to reconstruct the mass-balance history of Hailuogou glacier. Since the glacier meltwater stream has been well documented since 1994, a hydrological method will probably be our first consideration to reconstruct glacier mass balance of the HLG catchment. Such model results will be compared with the geodetic method (interannual mass loss determined by DEMs; Reference Cox and MarchCox and March, 2004) and may also be validated by specific ablation observations in the ablation area.
The long-term monitoring programme of the CERN has produced a comprehensive database which assists the study of global warming impacts on the hydrology of high alpine environments. The trend towards more negative glacier mass balance makes it necessary to continue this monitoring and modelling effort in order to assess the consequences of glacier mass changes on runoff yield and flood potential.
Summary
Topographic maps, Landsat and ASTER images, combined with detailed RTK-GPS measurements, were used to identify extent and length changes of glaciers in the Hailuogou catchment since 1966.
During the past 20 years (1988–2008), air temperature in the HLG catchment underwent an increasing trend of +0.2°C (10 a)−1, whereas a comparatively steady precipitation trend was observed. Temperature changes, rather than precipitation variability, are probably the controlling factor of glacier mass balance in the HLG catchment. Small glaciers have lost most of their areas (73.8% maximum) due to increasing air temperature in recent decades, and some small glaciers will probably vanish within a few years. Glacier thinning is more marked than changes of glacier area and length, and we can confirm that the main glacier mass loss process is ice thinning.
Remarkable mass loss in the glacierized catchment of HLG leads to variations in runoff for the two catchments. The glacierized HLG catchment exhibits a significant increasing trend in annual and summer runoff, while the non-glacierized HBLG catchment did not experience such significant change.
Glacier storage in the HLG catchment was calculated monthly by separating the daily rainfall component from the daily total discharge. We estimate a thinning rate of 0.5 ± 0.4 to 0.7 ± 0.4 m a−1(1994–2004) for the whole area of Hailuogou glacier. We calculated the glacierized catchment water balance using a hydrological method for the same period. Both these approaches result in nearly the same value for glacier mass loss (in terms of ice thinning, 5–7 m using the geodetic method and 6.59 m using the hydrological method).
Acknowledgements
Helpful reviews of this paper were provided by two anonymous reviewers and we greatly appreciate manuscript improvement suggestions from T.H. Jacka and T. Scambos. We thank the Gongga Alpine Ecosystem Observation and Research Station, CERN, China, for hydroclimatic data collection and field assistance. This work was funded by the Major State Basic Research Development Program of China (973 Program) (2007CB411506) and the Innovation Project of the Chinese Academy of Sciences (Kzcx2-yw-301). In addition, we acknowledge grants from the National Natural Science Foundation of China (grant Nos. 40801030 and 40801025) and the National Basic Work Program of Chinese MST (Glacier Inventory of China II, grant No. 2006FY110200). Zhao Jingdong, Li Xiangying, Li Gang and others assisted in the field.


