


Introduction
Several techniques are routinely employed to observe and chemically characterize minerals at the micro- and nanometer scale. X-ray diffraction, scanning electron microscopy with energy-dispersive X-ray spectroscopy (SEM-EDS) and electron microprobe (EPMA) are useful for mineral bulk compositional estimates, whereas transmission electron microscopy (TEM) and high-resolution TEM (HRTEM) become methods of choice when investigating defects, interfaces, and atomic arrangements in confined spaces. More recently, atom probe tomography (APT), historically used for the analysis of conductive materials, has been successfully applied to study the chemical composition and the 3D structure of insulator minerals, thanks to the implementation of the laser-assisted field evaporation technique (Saxey et al., Reference Saxey, Reddy, Fougerouse, Rickard, Mose, Corfu, Darling, Reddy and Tait2018). From the early applications of laser-assisted APT on minerals and biominerals (e.g., Gordon & Joester, Reference Gordon and Joester2011; McMurray et al., Reference McMurray, Gorman and Diercks2011; Arey et al., Reference Arey, Perera, Kovarik, Qafoku, Felmy and Gorman2012; Gordon et al., Reference Gordon, Tran and Joester2012; Bachhav et al., Reference Bachhav, Danoix, Hannoyer, Bassat and Danoix2013; Heck et al., Reference Heck, Stadermann, Isheim, Auciello, Daulton, Davis, Elam, Floss, Hiller, Larson, Lewis, Mane, Pellin, Savina, Seidman and Stephan2014; Valley et al., Reference Valley, Reinhard, Cavosie, Ushikubo, Lawrence, Larson, Kelly, Snoeyenbos and Strickland2015), APT is becoming a more widely used technique in geosciences (Reddy et al., Reference Reddy, Saxey, Rickard, Fougerouse, Montalvo, Verberne and van Riessen2020), including diverse fields such as biomineralogy (DeRocher et al., Reference DeRocher, Smeets, Goodge, Zachman, Balachandran, Stegbauer, Cohen, Gordon, Rondinelli, Kourkoutis and Joester2020; Pérez-Huerta et al., Reference Pérez-Huerta, Walker and Cappelli2020) and planetary science (Daly et al., Reference Daly, Lee, Bagot, Halpin, Smith, McFadzean, O'Brien, Griffin, Hallis and Cohen2020; Lewis et al., Reference Lewis, Floss, Isheim, Daulton, Seidman and Ogliore2020; Darling et al., Reference Darling, White, Kizovski, Černok, Moser, Tait, Dunlop, Langelier, Douglas, Zhao, Franchi and Anand2021). Still, some fundamental aspects of APT application to minerals must be addressed to further improve the data quality. The nominal accuracy of chemical characterization by APT can diminish due to phenomena related to the mineral-laser interaction and resolution limitations of the technique. Isobaric interferences (i.e., overlap of species with the same mass-to-charge state ratio) (Larson et al., Reference Larson, Prosa, Ulfig, Geiser and Kelly2013b; La Fontaine et al., Reference La Fontaine, Piazolo, Trimby, Yang and Cairney2017; Reddy et al., Reference Reddy, Saxey, Rickard, Fougerouse, Montalvo, Verberne and van Riessen2020), ion pile-up, neutral molecules formation and molecular species dissociation (Saxey, Reference Saxey2011; Karahka & Kreuzer, Reference Karahka and Kreuzer2013; Meisenkothen et al., Reference Meisenkothen, Steel, Prosa, Henry and Prakash Kolli2015; Santhanagopalan et al., Reference Santhanagopalan, Schreiber, Perea, Martens, Janssen, Khalifah and Meng2015; Pedrazzini et al., Reference Pedrazzini, London, Gault, Saxey, Speller, Grovenor, Danaie, Moody, Edmondson and Bagot2017; Peng et al., Reference Peng, Vurpillot, Choi, Li, Raabe and Gault2018), and preferential (direct current) or late ion evaporation between laser pulses (Bachhav et al., Reference Bachhav, Danoix, Danoix, Hannoyer, Ogale and Vurpillot2011; Saxey, Reference Saxey2011; Mancini et al., Reference Mancini, Amirifar, Shinde, Blum, Gilbert, Vella, Vurpillot, Lefebvre, Lardé, Talbot, Pareige, Portier, Ziani, Davesnne, Durand, Eymery, Butté, Carlin, Grandjean and Rigutti2014) are examples of detrimental processes, which depend on the experimental parameters, yet are primarily related to the nature of the analyzed material. In the same way, spatial reconstructions of APT specimens may be affected by trajectory aberrations and atom migration (Larson et al., Reference Larson, Gault, Geiser, De Geuser and Vurpillot2013a; Devaraj et al., Reference Devaraj, Perea, Liu, Gordon, Prosa, Parikh, Diercks, Meher, Kolli, Meng and Thevuthasan2017; Oberdorfer et al., Reference Oberdorfer, Withrow, Yu, Fisher, Marquis and Windl2018; De Geuser & Gault, Reference De Geuser and Gault2020) that are strongly linked to the mineral crystallography and its chemical composition.
The relationship between crystallography, ion density distribution, and atom loss during the field evaporation process has been previously reported for semiconductors and insulators (Gault et al., Reference Gault, Moody, De Geuser, La Fontaine, Stephenson, Haley and Ringer2010b; Diercks et al., Reference Diercks, Gorman, Kirchhofer, Sanford, Bertness and Brubaker2013; Du et al., Reference Du, Burgess, Tjing Loi, Gault, Gao, Bao, Li, Cui, Kong Yeoh, Hoe Tan, Jagadish, Ringer and Zheng2013; Morris et al., Reference Morris, Cuduvally, Melkonyan, Zhao, van der Heide and Vandervorst2019; Cappelli & Pérez-Huerta, Reference Cappelli and Pérez-Huerta2020). A recent study by Cappelli & Pérez-Huerta (Reference Cappelli and Pérez-Huerta2020) investigated the possible influence of the crystallographic orientation on the spatial reconstruction and the chemical composition estimate of standard isotropic minerals (spinel and galena), reporting negligible differences among the performed APT analysis. Yet, different results are expected for anisotropic minerals with higher compositional and structural complexity, which are probably more representative of the natural diversity of the geological materials.
In this study, for the first time, a mica has been analyzed by APT with the main purpose of generating preliminary data showing how anisotropic minerals, such as phyllosilicates, can be characterized by this technique. Micas are nonswelling potassium clay minerals with a high negative charge (~0.9–1.0). These materials are of importance to petrological processes, for their ubiquity in metamorphic, sedimentary and igneous rocks, the variability in the chemical composition, and their ability to incorporate minor and trace elements (Yavuz, Reference Yavuz2003; Ottolini et al., Reference Ottolini, Schingaro, Scordari, Mesto and Lacalamita2010). Considered petrogenic indicators, they provide information about magmatic processes such as partial melting or crystal fractionation (Fabre et al., Reference Fabre, Boiron, Dubessy, Chabiron, Charoy and Martin Crespo2002; Lepore et al., Reference Lepore, Bindi, Pedrazzi, Conticelli and Bonazzi2017). In addition to a characteristic layered crystal structure [tetrahedral–octahedral–tetrahedral (TOT) phyllosilicate type] (Fig. 1; e.g., Brigatti et al., Reference Brigatti, Galan, Theng, Bergaya, Theng and Lagaly2006), the surface charge and the wide crystal size ranging from nanometers to meters, make micas suitable for numerous applications involving inorganic and organic molecules adsorption, and cation exchange (Pastré et al., Reference Pastré, Hamon, Sorel, Le Cam, Curmi and Piétrement2010; Kan et al., Reference Kan, Tan, Wu, Si and Chen2015; Osuna et al., Reference Osuna, Cota, Pavón, Pazos and Alba2018; Hussein & Vegi, Reference Hussein and Vegi2020; Pazos et al., Reference Pazos, Bravo, Ramos, Osuna, Pavón and Alba2020; Wu et al., Reference Wu, Lin, Cheng, Chen, Ji, Xu and Kang2020). Furthermore, micas have been employed in the production of nanocomposites, which make use of the optical and electrical properties of these minerals, for many industrial applications (e.g., microelectronic, insulators, aerospace industry) (Zhang et al., Reference Zhang, Dang, Xin, Daoud, Ji, Liu, Fei, Li, Wu, Yang and Li2005; Krzesińska et al., Reference Krzesińska, Celzard, Grzyb and Marêché2006; Verbeek & Christopher, Reference Verbeek and Christopher2012; Zhao et al., Reference Zhao, Xu, Song, Chen and Liu2019). The study of mica minerals at the atomic scale will improve understanding of the structural and chemical properties of these materials (e.g., defects, cation substitutions) and the molecular processes (e.g., adsorption) associated with them. Moreover, APT, with high spatial resolution (up to 0.15 and 0.06 nm for lateral and longitudinal, respectively; Larson et al., Reference Larson, Gault, Geiser, De Geuser and Vurpillot2013a), overcomes some limitations of other conventional nanotechniques (e.g., nano-SIMS) for targeting analysis of phyllosilicate needed, for example, to study rare materials, such as chondrite serpentine (Daly et al., Reference Daly, Lee, Darling, McCarrol, Yang, Cairney, Forman, Bland, Benedix, Fougerouse, Rickard, Saxey, Reddy, Smith and Bagot2021).
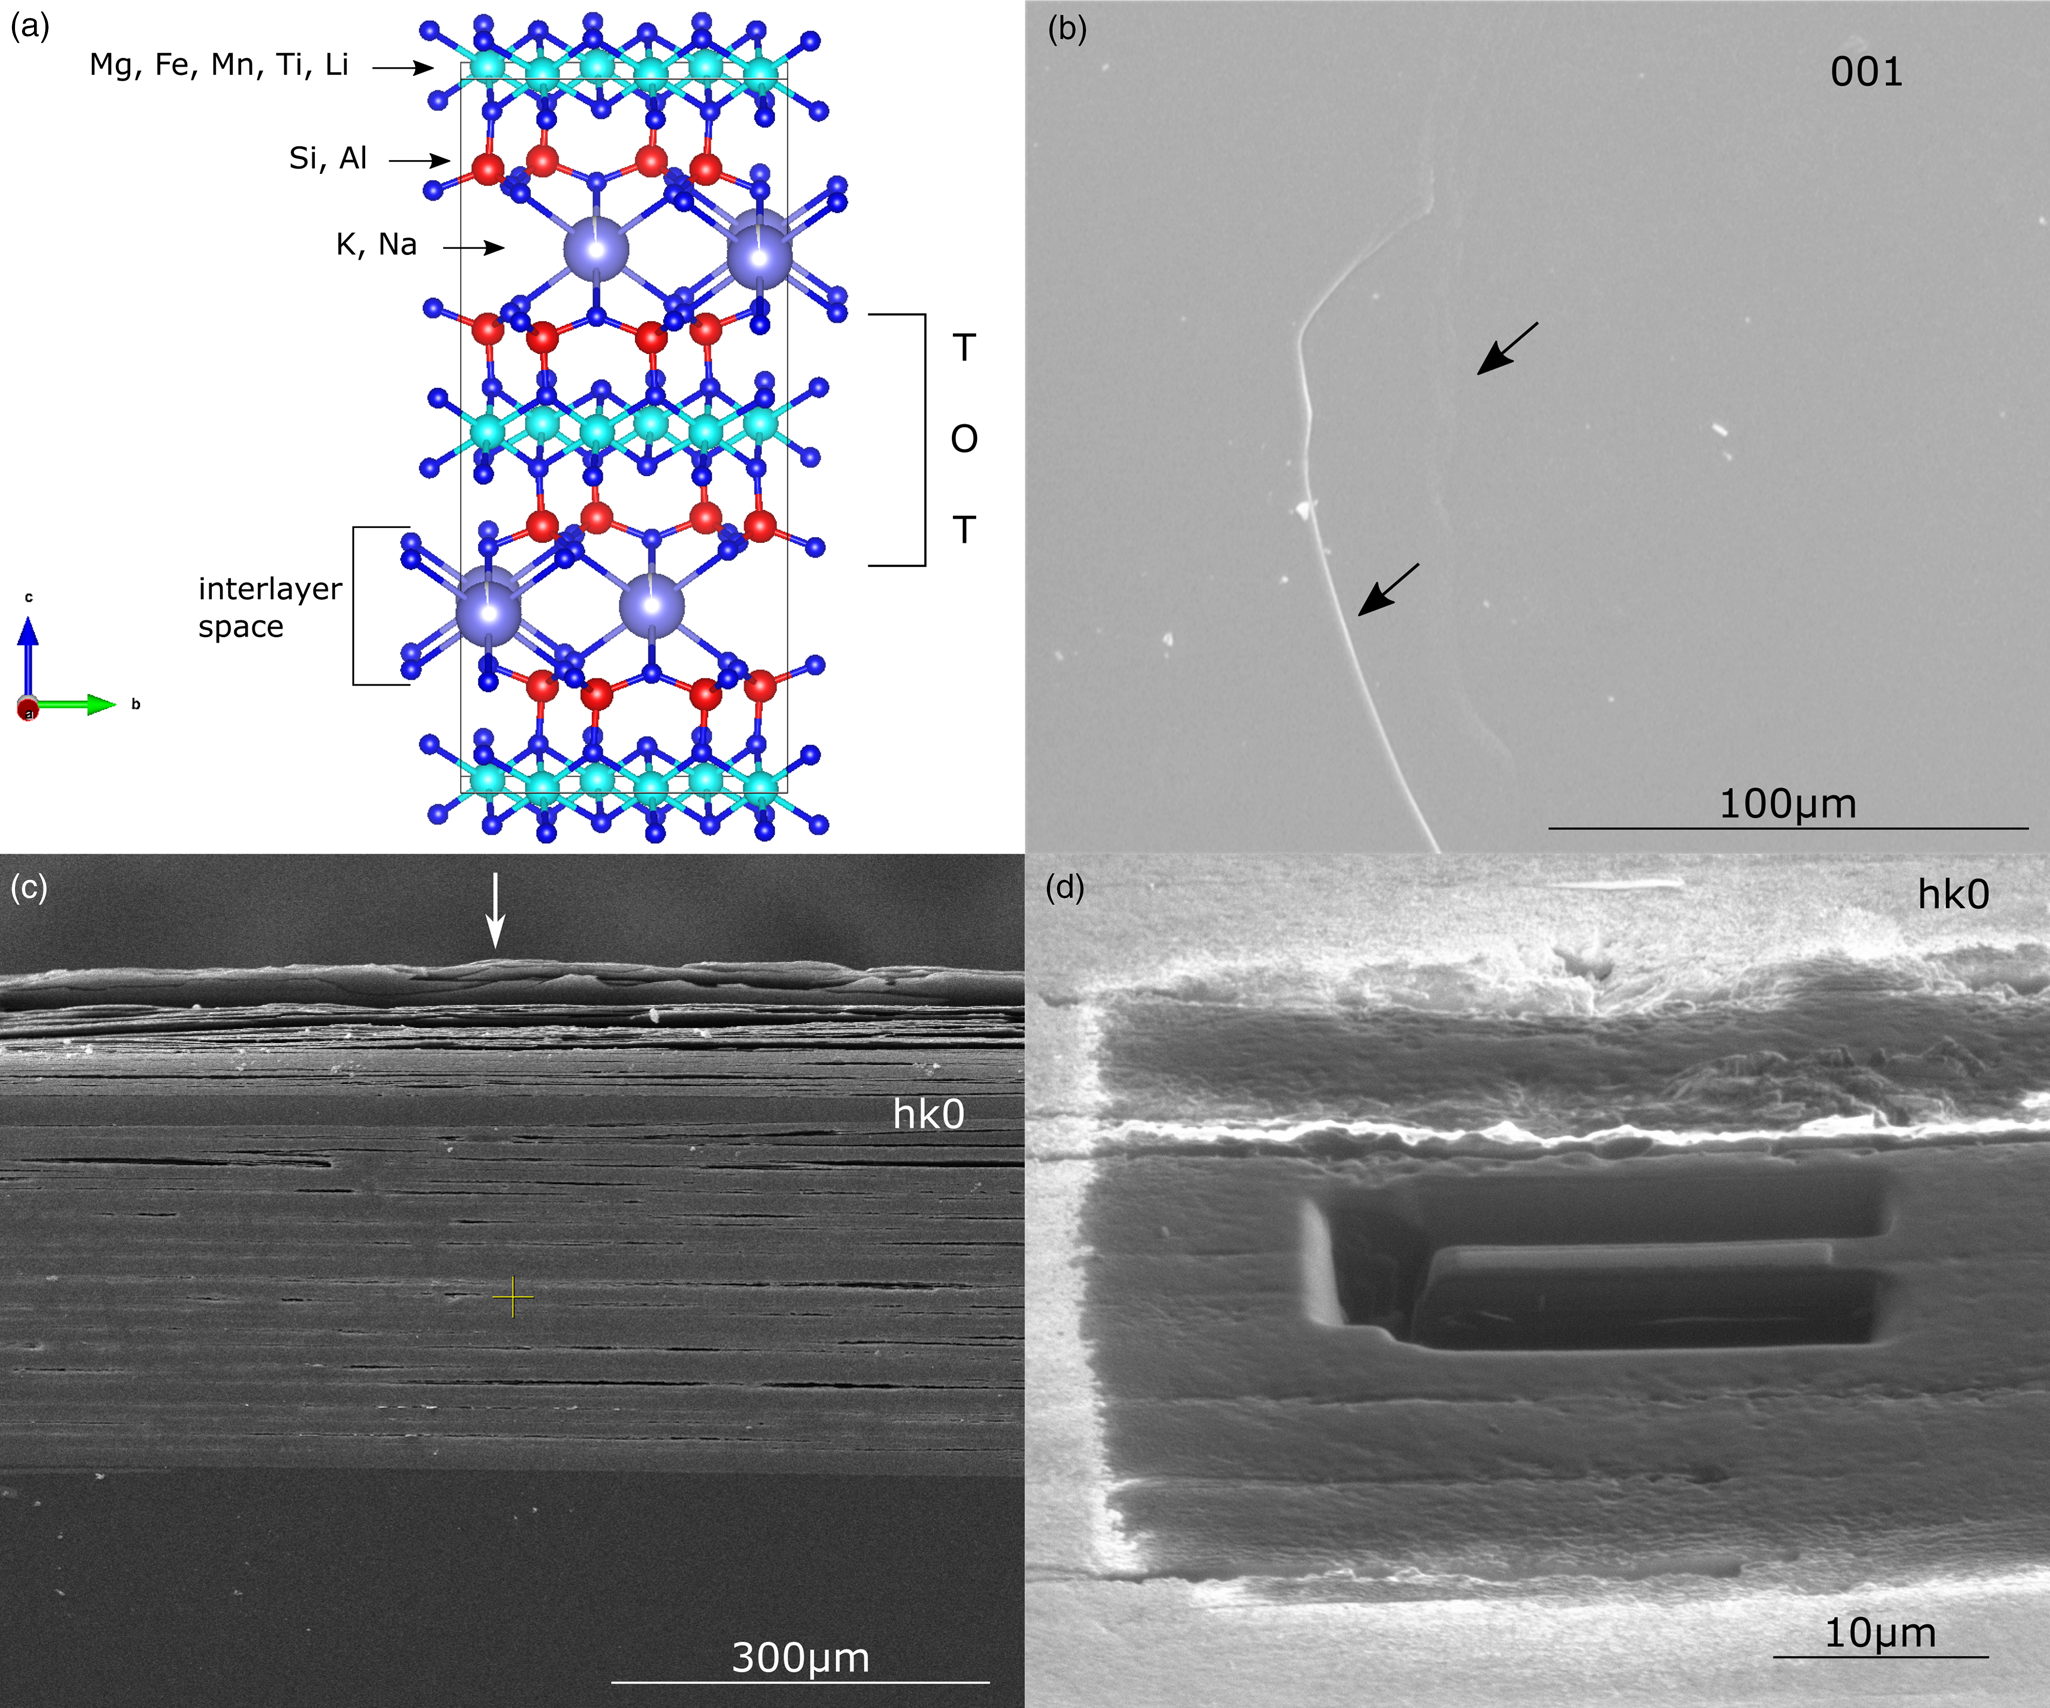
Fig. 1. (a) Simplified model of a mica structure showing the tetrahedral–octahedral–tetrahedral layer, the interlayer space and the typical cations occupying the different coordination position in the crystal lattice. SEM (b,c) and FIB (d) images of Mg-dominant biotite surface. (b) View of the (001) basal surface (black arrows indicate the edges of the mineral sheets). (c,d) View of the (hk0) surface where the layered structure is readily visible. White arrow in (c) indicates the exposed side of the sample undergoing delamination. In (d), wedge ready for lift-out.
Material and Methods
Mineral Characterization
The mica used in this study was provided by the Alabama Museum of Natural History of the University of Alabama. The sample was analyzed by different techniques and compared to reference data for the correct interpretation of the APT results. A general structural formula was obtained by microprobe analysis [JEOL 8600 EPMA hosted at the Alabama Analytical Research Center (AARC)] and assuming all iron was ferrous:
 $${\rm K}_{0.89}{\rm N}{\rm a}_{0.06}{\rm M}{\rm g}_{1.59}{\rm M}{\rm n}_{0.05}{\rm F}{\rm e}_{1.16}{\rm T}{\rm i}_{0.10}{\rm A}{\rm l}_{1.02}{\rm S}{\rm i}_{3.00}{\rm O}_{10}( {{\rm F}, \;{\rm OH}} ) _2.$$
Trace elements (Cr, Zn, Ni, Sr) were also identified while a percentage of fluorine was detected by EDS bulk analysis (JEOL 7000 FE SEM equipped with EDX hosted at the AARC) (see Supplementary Tables SI1 and SI2 for analysis details). According to the estimated chemical composition, the sample is a magnesium-rich biotite.
A biotite lamella was prepared and imaged utilizing scanning transmission electron microscopy in high-angle annular dark-field mode (HAADF-STEM) with an aberration-corrected Thermo Scientific Titan Themis Cubed hosted in the Sensitive Instrument Facility of the Ames Laboratory. The preparation of the sample is described in the Supplementary material. The TEM half grid with the prepared sample was loaded in a double-tilt holder, and images were recorded with the Cs-corrected probe with current of 20 pA at 200 kV. Before recording images, the biotite lamella was oriented on the zone-axis by parking the probe on the thickest region and recording and centering the Kikuchi band intersection visible in the Ronchigram. An expected value of 10 Å defining the d-spacing typical for biotite mica was determined (Fig. 2).
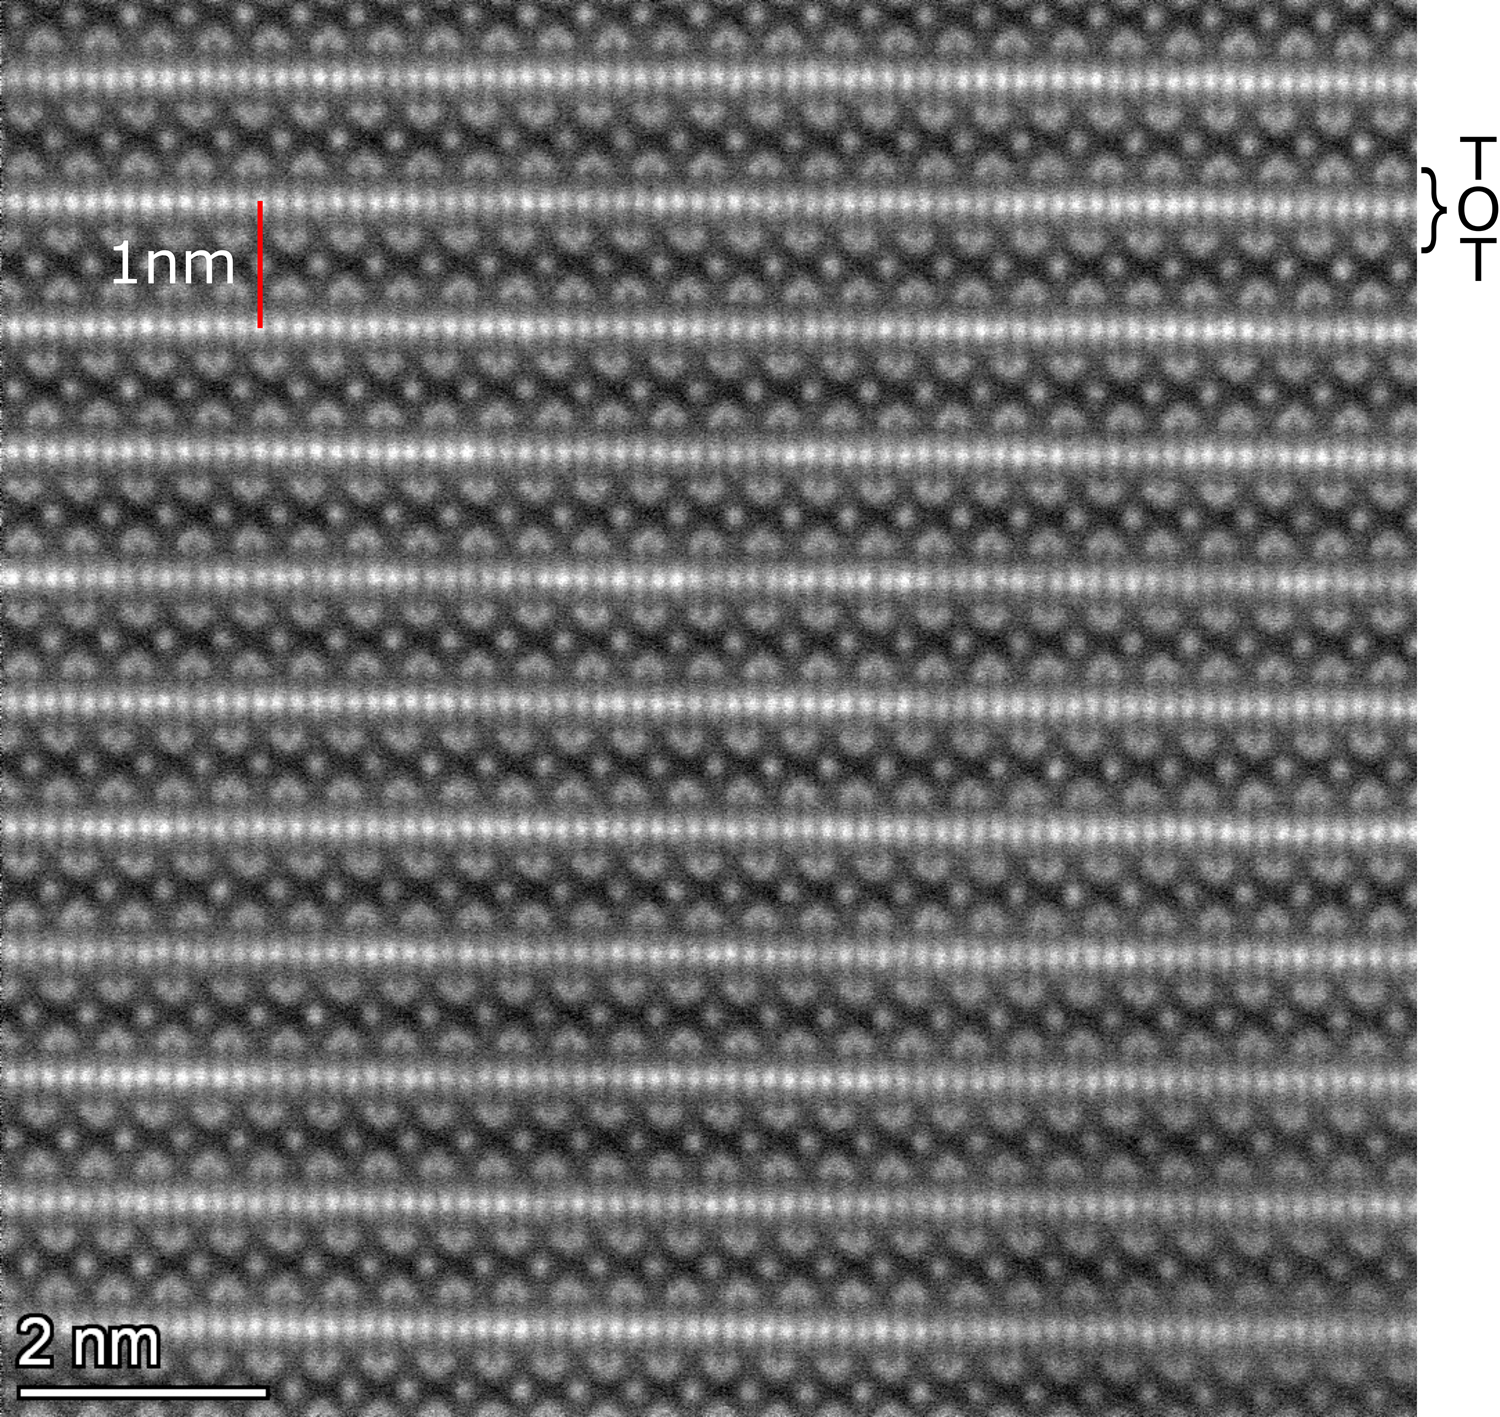
Fig. 2. High-angle annular dark-field scanning transmission electron microscopy (HAADF-STEM) image of (hk0) mica surface. A typical d-spacing of 10 Å (c-dimension) was measured and the tetrahedral–octahedral–tetrahedral (TOT) layers bound together by interlayer cations were revealed.
X-ray diffraction results are consistent with the sample characterization performed with the other techniques. Figure 3 shows a typical diffractogram of a biotite obtained by a Bruker D8 Discover XRD (hosted at the AARC) using a Co anode source with the average wavelength of 1.79 Å.
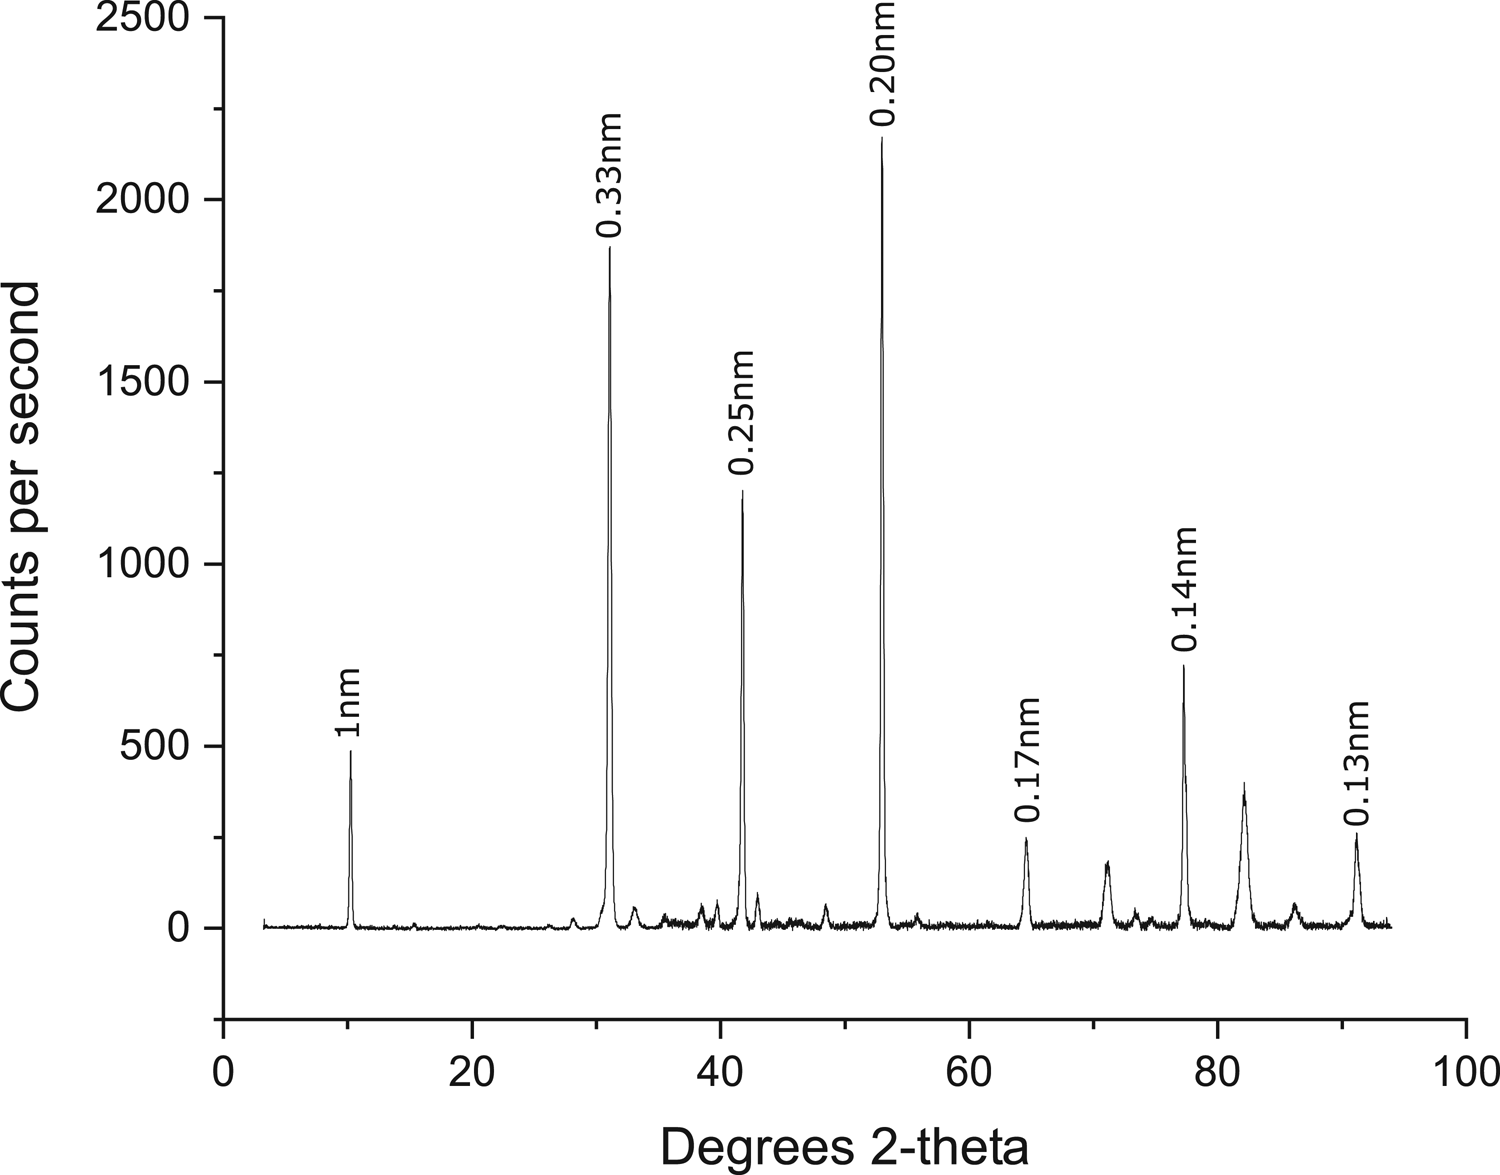
Fig. 3. Diffractogram of the mica sample showing the main reflections arisen from different pairs of layers of the mica crystallographic structure. Note the peak at 2θ–10.25° depicting the c lattice parameter dimension.
Sample Preparation for APT
Two different crystal orientations were considered, normal to [001] and [hk0] directions, respectively (Figs. 1b–1d). For the (001) basal surface specimens, a small mica flake (~1 × 1 cm and ~0.5 mm thick) was placed on a stub by gluing it with a carbon tape, the first few layers were peeled off by using regular adhesive tape, and the sample was coated with ~ 20 nm of gold to minimize surface charging effects during scanning microscopy (SEM) imaging and focus ion beam (FIB) milling. Due to the layered structure of mica (Fig. 1) and its easy delamination during manipulation, a sample flake (~1 × 1 cm and ~0.4 mm thick) was first placed in epoxy resin (001) surface-oriented, then the resin block was cross-cut by a diamond blade to expose the (hk0) surface. Finally, the sample was carefully polished by grinding paper, cleaned with MilliQ water and gold coated.
The needle-shaped specimens for APT were prepared following a conventional FIB protocol (Miller et al., Reference Miller, Russell, Thompson, Alvis and Larson2007) using a dual-beam scanning electron microscope (Tescan Lyra FIB-FESEM or FEI Quanta 3D Dual Beam hosted at the AARC). Three specimens for each orientation were analyzed (total of six runs, Table 1). The radius of curvature and the shank angle ranged from 32 to 60 nm and 32° to 54°, respectively. For an overview of the different steps of the specimen preparation and the final tip shape, see Supplementary Figure SI1.
Table 1. Instrument Settings and Input and Output Experimental Parameters.

Local Electrode Atom Probe
In this study, a Local Electrode Atom Probe (LEAP) 5000 XS with a nominal flight path of 100 mm (housed at the AARC) was used in laser mode to analyze mica specimens. The laser pulse energy (PE) and the laser pulse rate (PR) were varied in the range 10–50 pJ and 100–200 kHz, respectively. In addition, a range of 0.2–0.3% for the detection rate (DR) was tested. Finally, the best parameter values were fixed and a total of six successful run were obtained (three for each crystallographic orientation) (Table 1). Since good resolution and low background were obtained, no further parameter's testing was performed, also taking into account that the increase of laser energy could lead to higher uneven tip heating [already observed for hk0 surface analysis (see the “Spatial reconstruction analysis” section in Results and Discussion)], higher detection to early fracture and higher pulse rates to larger thermal tails. Furthermore, it is worth noting that all the specimens extracted from the (001) surface suffered early fracture. This might be due to the specific layer's orientation normal to the analysis axes that in general decreases the analysis yield in layered materials (Kelly & Larson, Reference Kelly and Larson2012; Larson et al., Reference Larson, Prosa, Ulfig, Geiser and Kelly2013b).
The software IVAS 3.8.0 (Integrated Visualization and Analysis Software) from CAMECA was used for spectra creation and 2D and 3D reconstructions of the data sets. Individual spectrum peaks were associated with ion species consistent with the mineral bulk composition and the mass-to-charge state ratios.
Results and Discussion
APT Spectra and Chemical Composition
An APT spectrum of a representative mica specimen extracted from the (001) surface (Fig. 4a; Supplementary Fig. SI2) shows the characteristic peaks of the main species evaporated from the tip surface. Besides the structural cations already identified by EPMA, two minor elements appeared: lithium, whose peaks are associated with Li+ isotopes with mass-to-charge state ratios 7 and 6 Da, and gallium (Ga++ and Ga+ isotopes with mass-to-charge state ratios 34.5–35.5 and 69–71 Da, respectively). The presence of gallium was not unexpected and is ascribed to the use of the focused ion beam. Although Ga implantation during the milling process is minimized by the platinum sample screening, it is not always avoidable. Hence, Ga is not considered part of the mica structure but coming from an external source. Contrarily, lithium must undoubtedly be a structural cation, which was not detected by EPMA because of its low atomic mass. The determination of Li content in mica minerals has been a central issue in the past. Empirical relationships between Li2O and SiO2, Al2O3, MgO and other minor elements in mica have been used to formulate regression equations enabling the estimation of lithium content from EPMA analysis (Tischendorf et al., Reference Tischendorf, Gottesmann, Foerster and Trumbull1997; Yavuz, Reference Yavuz2001). Most recently, laser-induced breakdown spectroscopy (Fabre et al., Reference Fabre, Boiron, Dubessy, Chabiron, Charoy and Martin Crespo2002), laser ablation inductively coupled plasma mass spectroscopy (Breiter et al., Reference Breiter, Vaňková, Galiová, Korbelová and Kanický2017; Rosing-Schow et al., Reference Rosing-Schow, Müller and Friis2018), and SIMS (Ottolini et al., Reference Ottolini, Schingaro, Scordari, Mesto and Lacalamita2010) have been successfully applied for the identification of mica light and trace elements. APT not only provides the estimate of the concentration and isotopic ratios of those elements but, potentially, allows the assessment of their spatial distribution. In addition to Li, characteristic peaks of Ni+ (58 Da), Cu+ (63 Da), and Zn+ (64 Da) have been identified in mica spectra (Fig. 4).

Fig. 4. Representative APT spectra of the studied Mg-biotite: (a) 001 specimen spectrum and (b) overlapped 001 and hk0 specimen spectra, normalized to the higher peak (i.e., 24Mg2+ isotope).
In this study, numerous overlapping peaks were well resolved by the peak decomposition tool of the IVAS software on the basis of the isotopic ratios. Although, in some cases, the deconvolution was either very difficult or not viable. In fact, despite the high sensitivity of APT chemical analysis, the overlap of different element peaks is still an issue for the characterization of a mineral's composition by this technique (Reddy et al., Reference Reddy, Saxey, Rickard, Fougerouse, Montalvo, Verberne and van Riessen2020). For example, the estimate of Sr, previously detected in our sample by EPMA, was complicated by the overlap of its main peak at 44 Da (Sr2+) with 28Si16O+ and the presence of a very low peak of 87Sr2+ isotope at 43.5 Da from which the total element concentration was estimated. For a similar reason, Cr was not detectable by APT due to the overlapping of the main peaks with other elements and the very low concentration of this element leaving its nonoverlapping isotopes below the background. Likewise, the APT estimate of Ti concentration is not accurate because of the overlapping of almost all its main peaks [Ti2+ with Mg+ (24 Da); 48Ti16O2+ with O2+ and Zn2+ (32 Da)]. In addition, while the deconvolution of Si+ and Fe2+ (28 Da) is quite reliable thanks to their isotope counts, it is difficult to discern between Fe+ and 24Mg16O2+ (main peak 56 Da) whose isotopes are below the background level and hence almost or totally absent.
Despite these limitations, a general chemical composition was defined for the studied mica by APT for both the crystallographic orientations considered (Table 2). The first observation is the higher relative amount of Li, Na, and K cations and molecular species (e.g., SiO+, AlO+) obtained for the specimens extracted from the (001) surface with respect to (hk0) surface (001 and hk0 specimens hereinafter), as shown in Figure 4b where the normalized spectra of representative 001 and hk0 specimens were compared. Also, the total oxygen concentration is higher for the hk0 specimens, although always in deficit. The loss of oxygen during APT analysis has been already documented for several minerals in previous works (Gordon et al., Reference Gordon, Tran and Joester2012; Fougerouse et al., Reference Fougerouse, Reddy, Saxey, Erickson, Kirkland, Rickard, Seydoux-Guillaume, Clark and Buick2018; Saxey et al., Reference Saxey, Reddy, Fougerouse, Rickard, Mose, Corfu, Darling, Reddy and Tait2018; Cappelli & Pérez-Huerta, Reference Cappelli and Pérez-Huerta2020).
Table 2. Elements Abundance Measured by APT for Each Mica Specimen and Crystallographic Orientation.
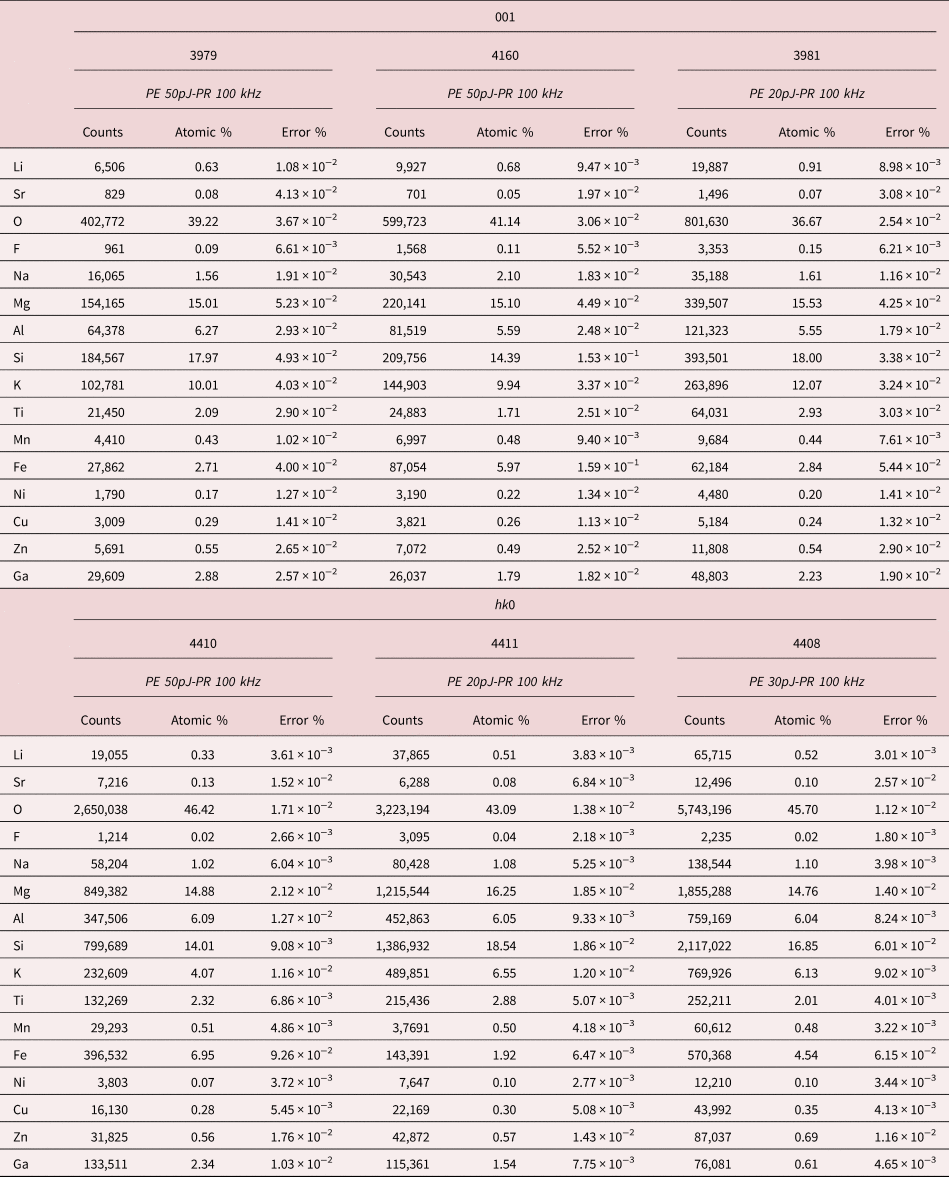
To simplify the assessment of the mineral stoichiometry, stoichiometric ratios (M/Si with M structural cation) for APT analysis and EPMA estimate were calculated (Table 3). Interestingly, the tetrahedral cations ratio (Al/Si) is near the stoichiometric value estimated by microprobe, for all the specimens analyzed by APT. To the contrary, interlayer cations, Na and K, are in excess for the 001 specimens and close to the stoichiometry ratio in the case of (hk0) surface. Mg appears always in excess. This behavior has been already observed during spinel and garnet APT characterization (Cappelli et al., Reference Cappelli, Smart, Stowell and Pérez-Huerta2021) and for Mg oxide at specific laser pulse energy conditions (Devaraj et al., Reference Devaraj, Colby, Hess, Perea and Thevuthasan2013). This reveals a higher apparent APT efficiency in Mg detection or, conversely, the deficit of other structural elements of the mineral, which bias the estimate of the chemical composition. Different processes may have caused the observed element's deficit, including ion pile-up effect, neutral molecules formation or preferential evaporation (Saxey, Reference Saxey2011; Karahka & Kreuzer, Reference Karahka and Kreuzer2013; Mancini et al., Reference Mancini, Amirifar, Shinde, Blum, Gilbert, Vella, Vurpillot, Lefebvre, Lardé, Talbot, Pareige, Portier, Ziani, Davesnne, Durand, Eymery, Butté, Carlin, Grandjean and Rigutti2014; Meisenkothen et al., Reference Meisenkothen, Steel, Prosa, Henry and Prakash Kolli2015; Peng et al., Reference Peng, Vurpillot, Choi, Li, Raabe and Gault2018). All these events may prevent atoms from being detected because they are either in the background or lost before they can even reach the detector, leading de facto to a decrease of the nominal atom detection efficiency.
Table 3. Main Elements Stochiometric Ratios (M/Si) for EPMA and APT Mica Analysis.

Spatial Reconstruction Analysis
3D and 2D Plots
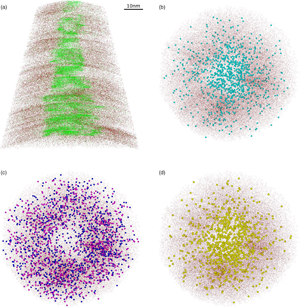
The spatial reconstruction of the mica tip-shaped specimens shows a nonuniform distribution of the main elements, especially for the 001 specimens (Fig. 5). At this orientation, the concentration of interlayer cations (K, Na) as well as that of molecular species (e.g., SiO, AlO, MgO) is much higher toward the center of the tip (Figs. 5a, 5b), whereas tetrahedral and octahedral cations are distributed along the edges of the specimen (Fig. 5c). Interestingly, the spatial distribution of Li follows the same pattern of the interlayer cations. Because the atom distribution appears to be consistent among the different identified ionic species, it is reasonable to infer that the encountered Li does not substitute octahedral cations, as one would expect for natural micas (Fig. 1a), but it is positioned in the interlayer (Fig. 5d). Otherwise, it is important to note that, similarly to K and Na, Li has a quite low evaporation field value. The low ionization energy of these cations could explain their similar behavior when a specimen is subjected to a high electric field and a laser pulse is applied. Additional experiments and analysis are needed in order to establish Li position in the crystal lattice of the studied mica.
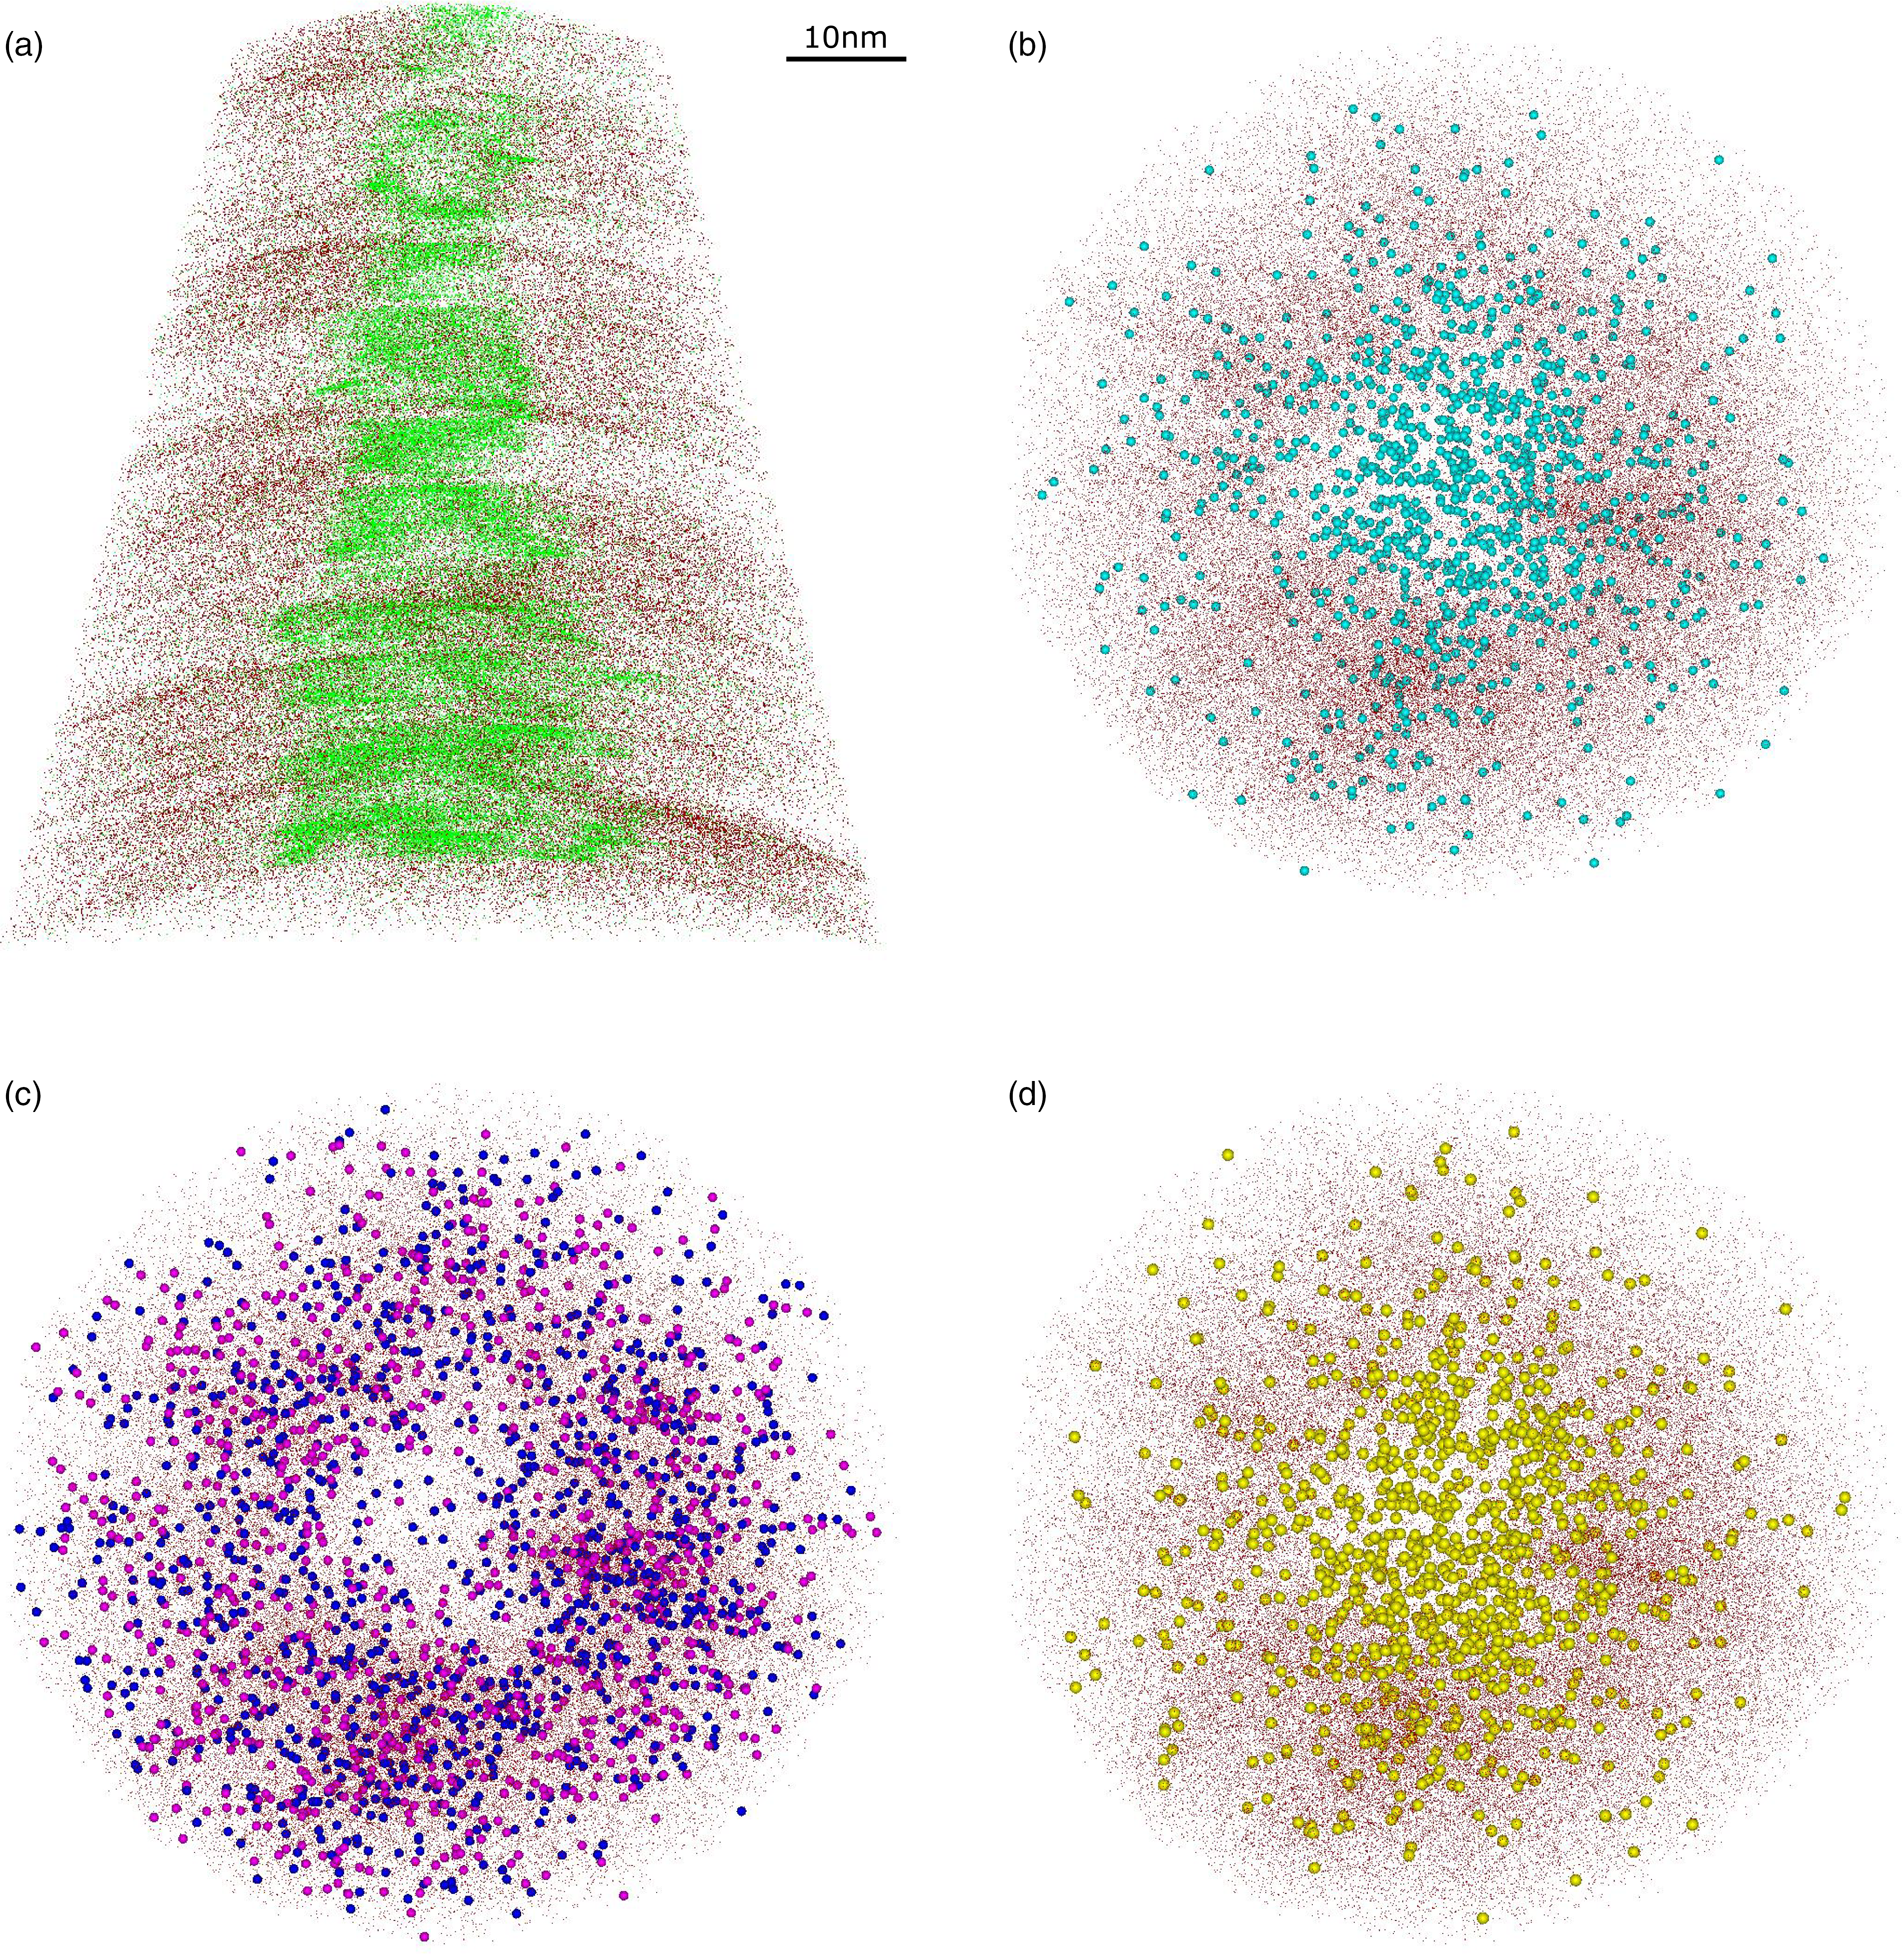
Fig. 5. 3D reconstructions of representative 001 specimen. Si atoms (dark red dots) are projected in the z–x plane (x-ortho projection) with (a) K (green dots) and in the x–y plane (z-ortho projection) with (b) MgO (light blue spheres), (c) Mg (dark blue spheres) and Al (pink spheres), and (d) Li (yellow spheres).
The uneven distribution of ionic species along the tip-shaped specimen is related to the nonuniform electric field strength over the surface which, in turn, depends on the nature of the mineral and the sample crystallography (Yao et al., Reference Yao, Gault, Cairney and Ringer2010; Morris et al., Reference Morris, Cuduvally, Melkonyan, Zhao, van der Heide and Vandervorst2019). Specific areas of low ionic density (pole and lines zones) are revealed in 2D density plots of mica tetrahedral and octahedral cations (Fig. 6a). In general, the lower the ionic density, the higher the local electric field, and the lower the crystallographic plane order. The pole at the center of the tip apex (Fig. 6a) should, indeed, correspond to the ⟨001⟩ plane. It is also worth noting that the density variation through the tip length may also depend on the asymmetric distribution of the laser pulse (Müller et al., Reference Müller, Smith, Gault and Grovenor2012).
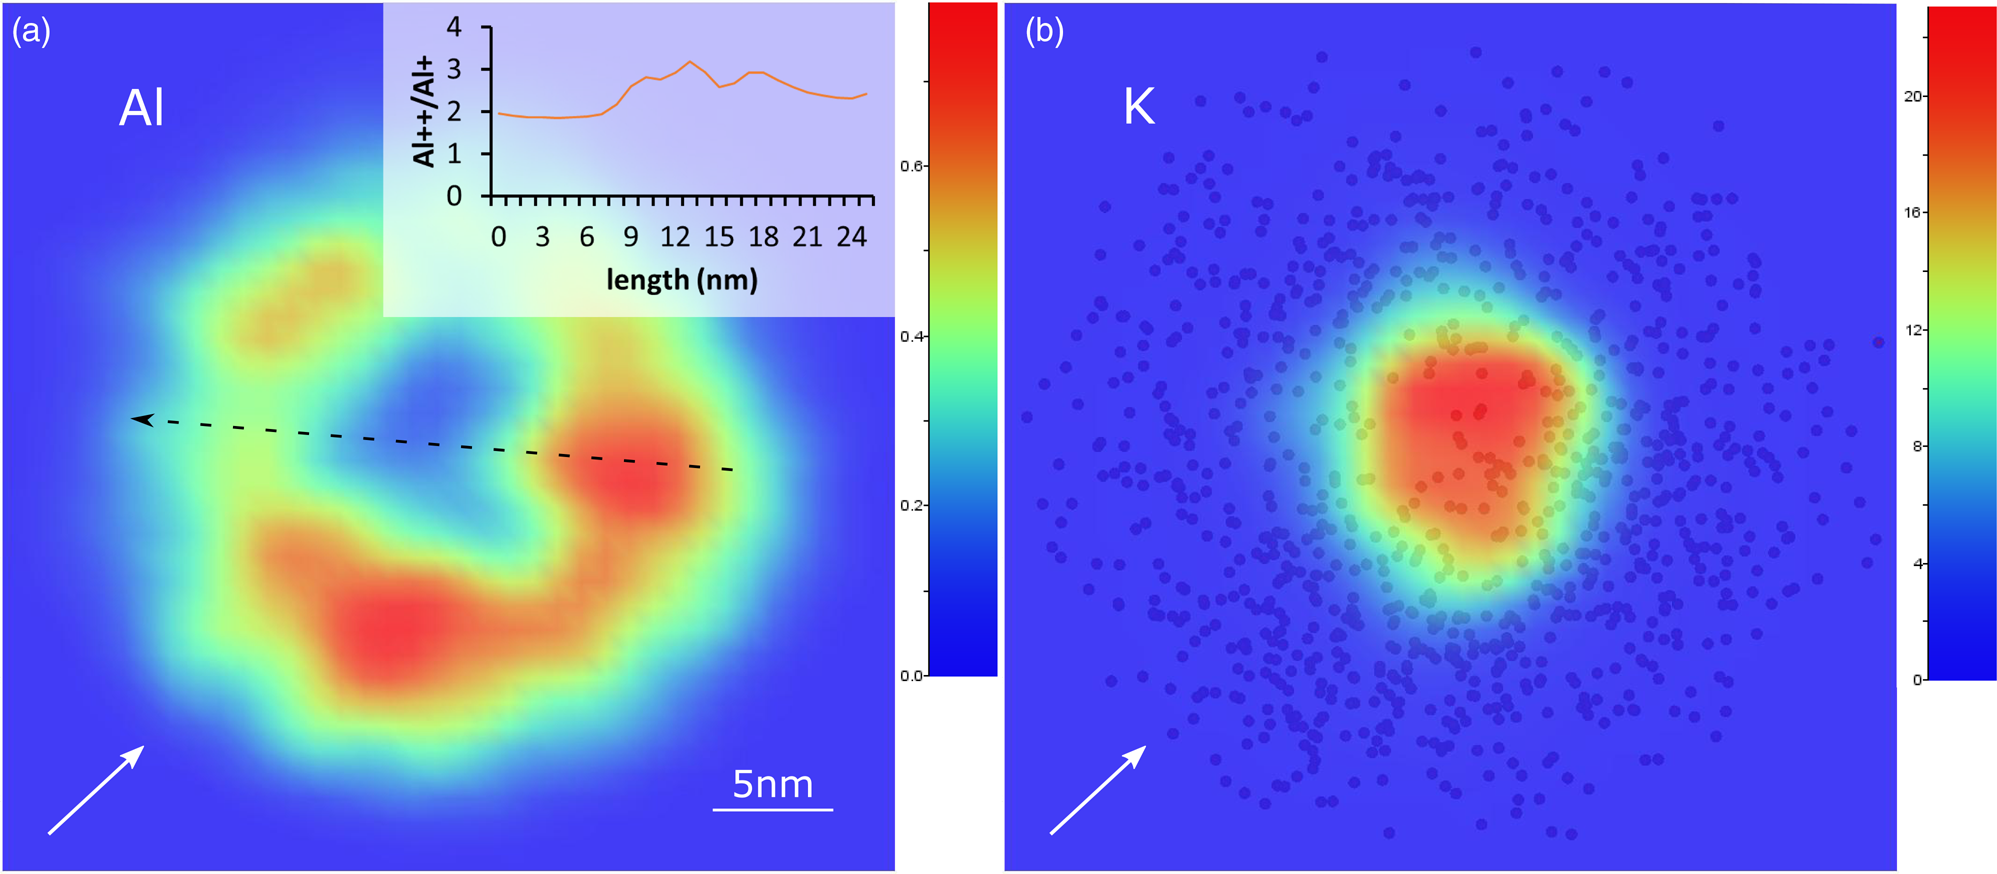
Fig. 6. 2D ion density plots (z-ortho projection) of a representative 001 specimen. (a) Al plot: the graph on the up-right shows the CSR measured along interlines, pole and line zones (black arrow) at a tip depth of 20 nm. (b) K plot: the spheres in the background are Si atoms. White arrows indicate the laser-beam direction.
To verify the existence of the electric field variability throughout the mica specimens, the charge state ratio (CSR) (M2+/M+, with M = ionic species), that has previously proved to be a good surface field indicator (Mancini et al., Reference Mancini, Amirifar, Shinde, Blum, Gilbert, Vella, Vurpillot, Lefebvre, Lardé, Talbot, Pareige, Portier, Ziani, Davesnne, Durand, Eymery, Butté, Carlin, Grandjean and Rigutti2014), was calculated over pole and line regions. Aluminum was taken as a representative element because it has clear peaks that are not affected by overlapping isotopes. The Al CSR value along a profile taken at a tip depth of 20 nm shows an increase from the inter-lines zone to a low-density line region with a maximum at the pole (inset in Fig. 6a). This supports the initial assumption regarding the local electric field distribution.
However, the density distribution of interlayer and molecular ionic species show an opposite pattern with respect to tetra and octahedral cations (Fig. 6b), consistent with the 3D reconstructions. This indicates that: first, the different bonding and coordination of the tetra/octahedral and interlayer cations affects the field evaporation; second, evaporation of molecular ionic species is favored at certain surface electric field conditions. High density at crystallographic poles has been previously reported for solutes in alloys (Oberdorfer et al., Reference Oberdorfer, Withrow, Yu, Fisher, Marquis and Windl2018) and is indicative of the fact that atom positions are somehow displaced after a field evaporation events, and that such a displacement depends on the crystallographic structure and chemistry of the mineral (Yao et al., Reference Yao, Withrow, Restrepo, Windl and Marquis2015).
Previous studies demonstrated that APT reconstruction artifacts can arise from (1) the actual displacement of atoms throughout the surface and (2) the change in the local electric field direction that leads to trajectory aberrations. It has been proposed that, after the field evaporation of an atom, a roll-up effect prompts the migration of nearest-neighbors toward positions of lower coordination (i.e., higher field) by atomic relaxation (Gault et al., Reference Gault, La Fontaine, Moody, Ringer and Marquis2010a, Reference Gault, Danoix, Hoummada, Mangelinck and Leitner2012a; Oberdorfer et al., Reference Oberdorfer, Withrow, Yu, Fisher, Marquis and Windl2018). The pre-requisite for this kind of mechanism is a preferential retention of the migrating atoms. In the case of mica, interlayer cations are subject to electrostatic forces and the nature of their bonding is predominantly ionic. In addition, K and Na as well as Li, as previously mentioned, have in theory very low evaporation field energies (Gault et al., Reference Gault, Moody, Cairney and Ringer2012b). For these reasons, it is more probable that these cations undergo a preferential evaporation.
On the other hand, the layered nature of mica suggests that a change in the charge distribution must occur when the sheets of the TOT structure are progressively evaporated during APT analysis of 001 mica specimens. The charge density distribution of a surface atom depends on the electric field as well as the local chemistry (nearest neighbors). When an atom is removed from the surface, a rearrangement of the partial charges occurs and a change of the main electrostatic field direction can happen (Katnagallu et al., Reference Katnagallu, Dagan, Parviainen, Nematollahi, Grabowski, Bagot, Rolland, Neugebauer, Raabe, Vurpillot, Moody and Gault2018; Klaes et al., Reference Klaes, Lardé, Delaroche, Parviainen, Rolland, Katnagallu, Gault and Vurpillot2021). Artifacts of registered atom positions would then derive from the change of the electric field configuration, leading to trajectory aberrations, and would reflect only an apparent atom's displacement. The configuration of the charge density of a material immersed in an electric field also redefines the bonding character between atoms (Loyola et al., Reference Loyola, Peralta, Broderick and Rajan2016) and justifies the tendency of some elements to evaporate as molecular species for a certain value of the local field, as in the case of Mg, Fe, Al, and Si oxide species for mica. Likely, the bonds breaking of such molecules is energetically favored over the breaking of a single bond for the specific local charge density distribution.
Specimens extracted from the (hk0) surface showed a different ion spatial distribution and 2D density plot (Fig. 7), compared with 001 specimens. Interlayer and tetra/octahedral cations are more uniformly distributed (Fig. 7a), although a strong laser effect on the ion density distribution is apparent (Figs. 7b, 7c). High pulse energies may induce a nonuniform heating of the tip-shaped specimen, which promotes the appearance of a field strength gradient across the tip apex and eventually the formation of apex asymmetries (Müller et al., Reference Müller, Smith, Gault and Grovenor2012). The alteration from an ideal spherical tip apex and, consequently, the variation of the local evaporation field, leads to apparent compositional anisotropy across the field of view, as the observed case of mica hk0 specimens.
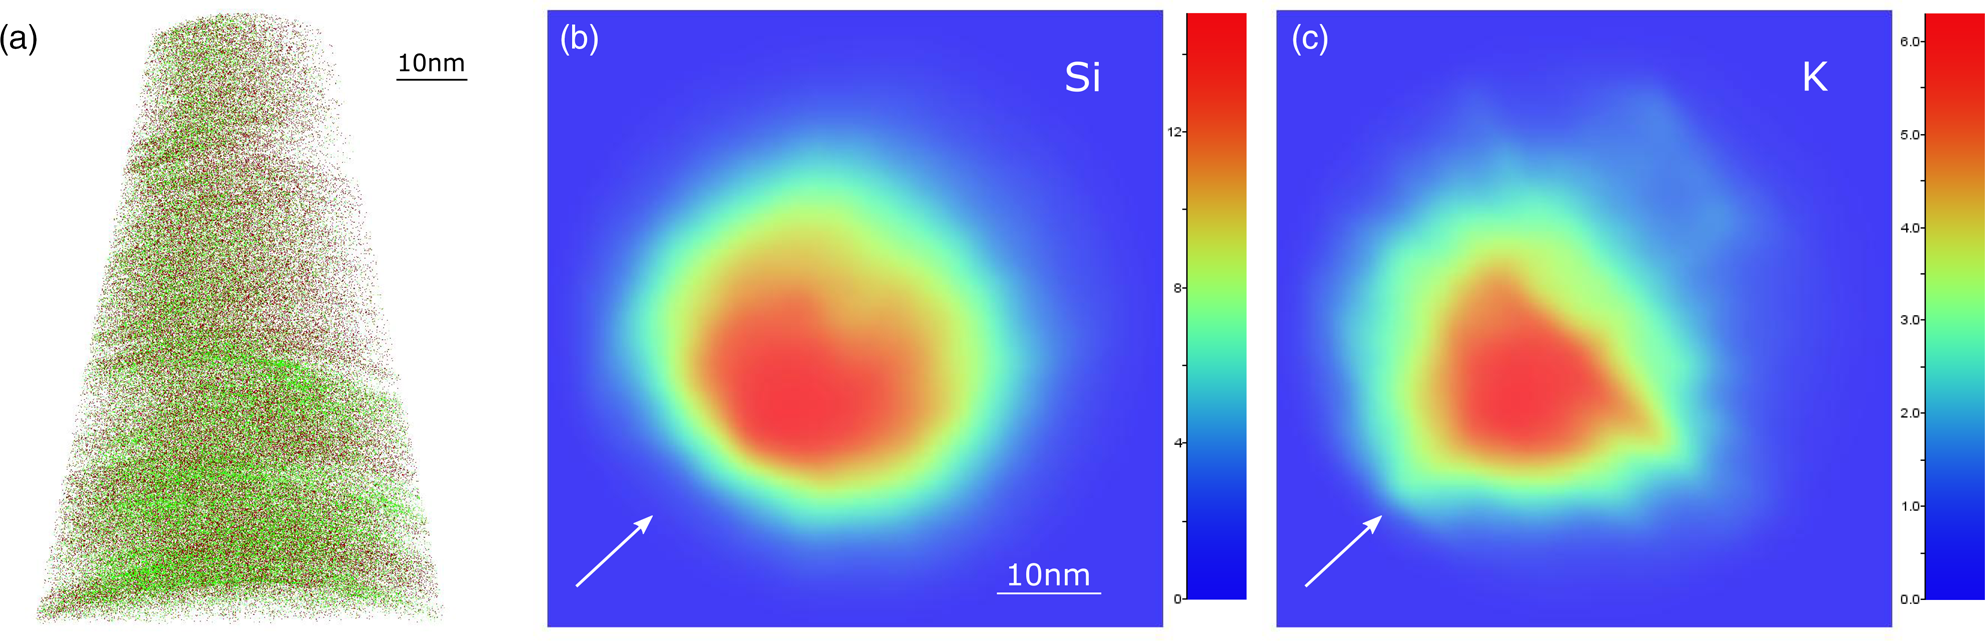
Fig. 7. 3D reconstruction (a) and 2D ion density plots (z-ortho projection) of Si (b) and K (c) of a representative hk0 specimen. In (a), Si atoms (dark red dots) are plotted (x-ortho projection) with K (green dots). White arrows indicate the laser-beam direction.
The extent of Ga implantation along the specimen's edges during sample milling is also different for the 001 and hk0 specimens. Figure 8 shows a 3D reconstruction of representative tips, where isosurfaces are plotted to depict the boundaries between elements. Ga (in yellow) is distributed around the edge surface of the 001 specimens (Fig. 8a) while it follows the exposed edge side in hk0 specimens (Fig. 8b). The implantation of Ga during sample preparation is still an issue for APT analysis since it can cause damage and amorphization of the crystalline material and can promote fractures in brittle materials (Miller et al., Reference Miller, Russell, Thompson, Alvis and Larson2007). Despite the minimization of this detrimental event, thanks to Pt protective deposition and low voltage specimen cleaning, mica seems particularly affected by Ga, likely due to its highly reactive edge surface where ions can be easily adsorbed.
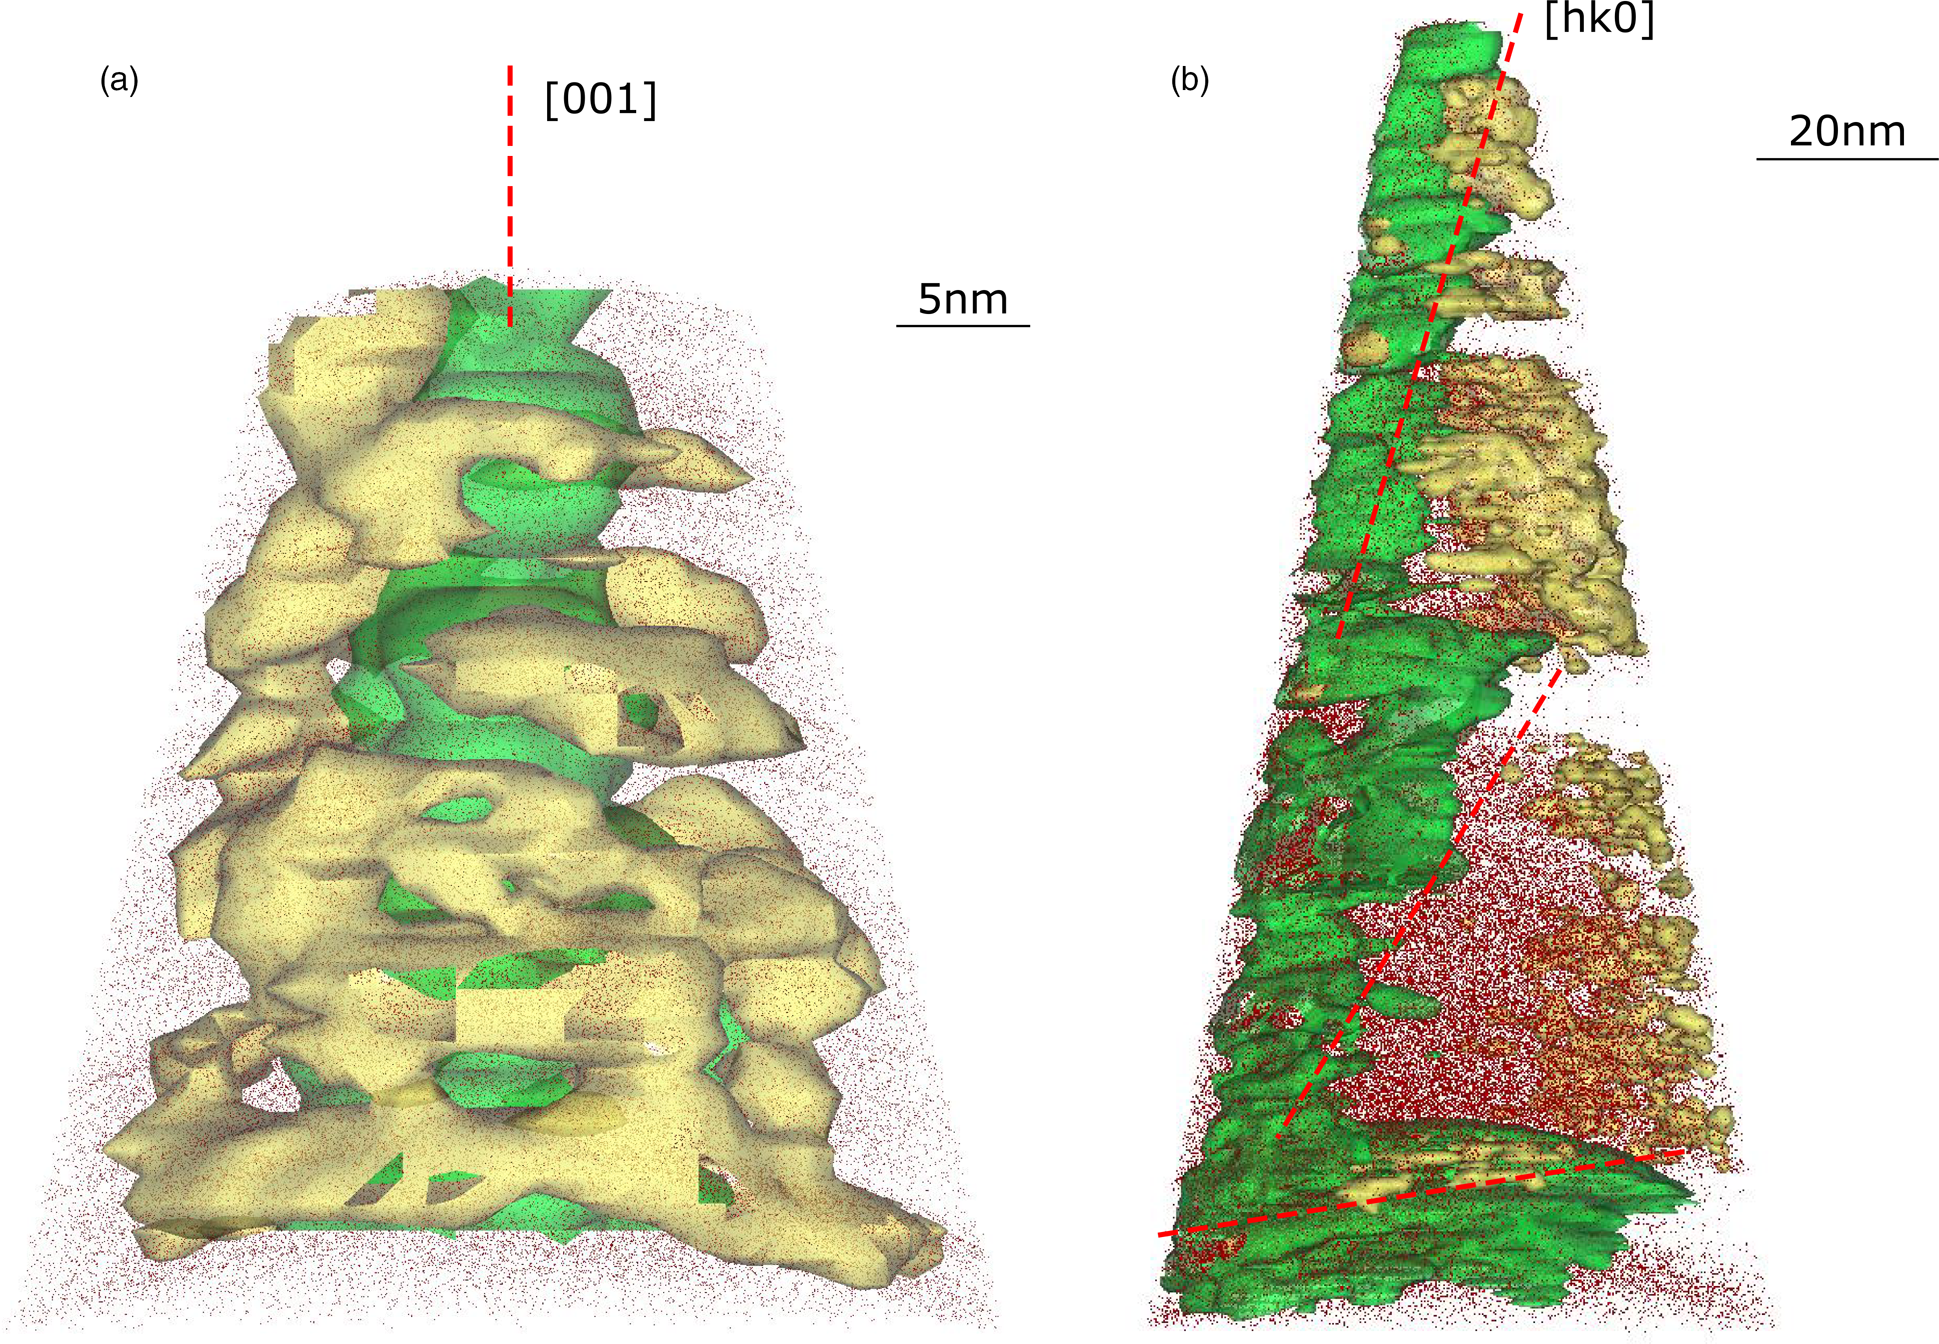
Fig. 8. 3D reconstructions of representative (a) 001 and (b) hk0 specimens. Si atoms (dark red dots) are plotted (x-ortho projection) with K (green) and Ga (yellow) isosurfaces. Red dashed lines indicate crystallographic orientation which for the hk0 specimen changes along the tip depth.
Interestingly, the isosurfaces highlight a progressive variation of the mica platelets tilt in hk0 specimens (Fig. 8b). Apparently, the initial orientation is almost normal to the [hk0] direction and changes to a near to (001) surface-oriented platelet at ~120 nm tip depth.
Layered Structure and d-Spacing
The layered structure of mica is immediately apparent especially in the 001 specimen 3D reconstructions (Fig. 5a). Interlayer cations as well as tetrahedral and octahedral elements form series of layers that are sometimes interrupted by voids (Figs. 6a, 8a). This spatial distribution suggests that platelets of mica likely detach after a particular field evaporation event, breaking the continuity of the analysis (Fig. 8b). The discontinuous atom evaporation from the tip surface is well reflected in the voltage (direct current) curve from which the same reconstruction takes place (Supplementary Figs. SI3, SI4). In fact, laser tracking loss events occurred during some LEAP runs. It is unclear if the accommodation of mica platelets toward a (001) surface orientation occur during the tip preparation, or it was driven by the intrinsic discontinuity of the sample and the intense applied electric field during analysis.
The trajectory aberrations and poor continuity of the ion evaporation reduced the reconstruction resolution and prevented an accurate estimate of the mica d-spacing. However, a good approximation of the expecting c dimension value of 10 Å was measured by spatial distribution maps (SDM) (IVAS tool) for some regions of both 001 and hk0 specimens where several layers were depicted (Fig. 9). It is worth noting that the choice of the value of reconstruction parameters, namely the k field factor and the image compression factor (Lefebvre et al., Reference Lefebvre, Vurpillot and Sauvage2016), is fundamental for the ion spatial distribution optimization and the knowledge of the crystallographic dimensions is useful in this regard.
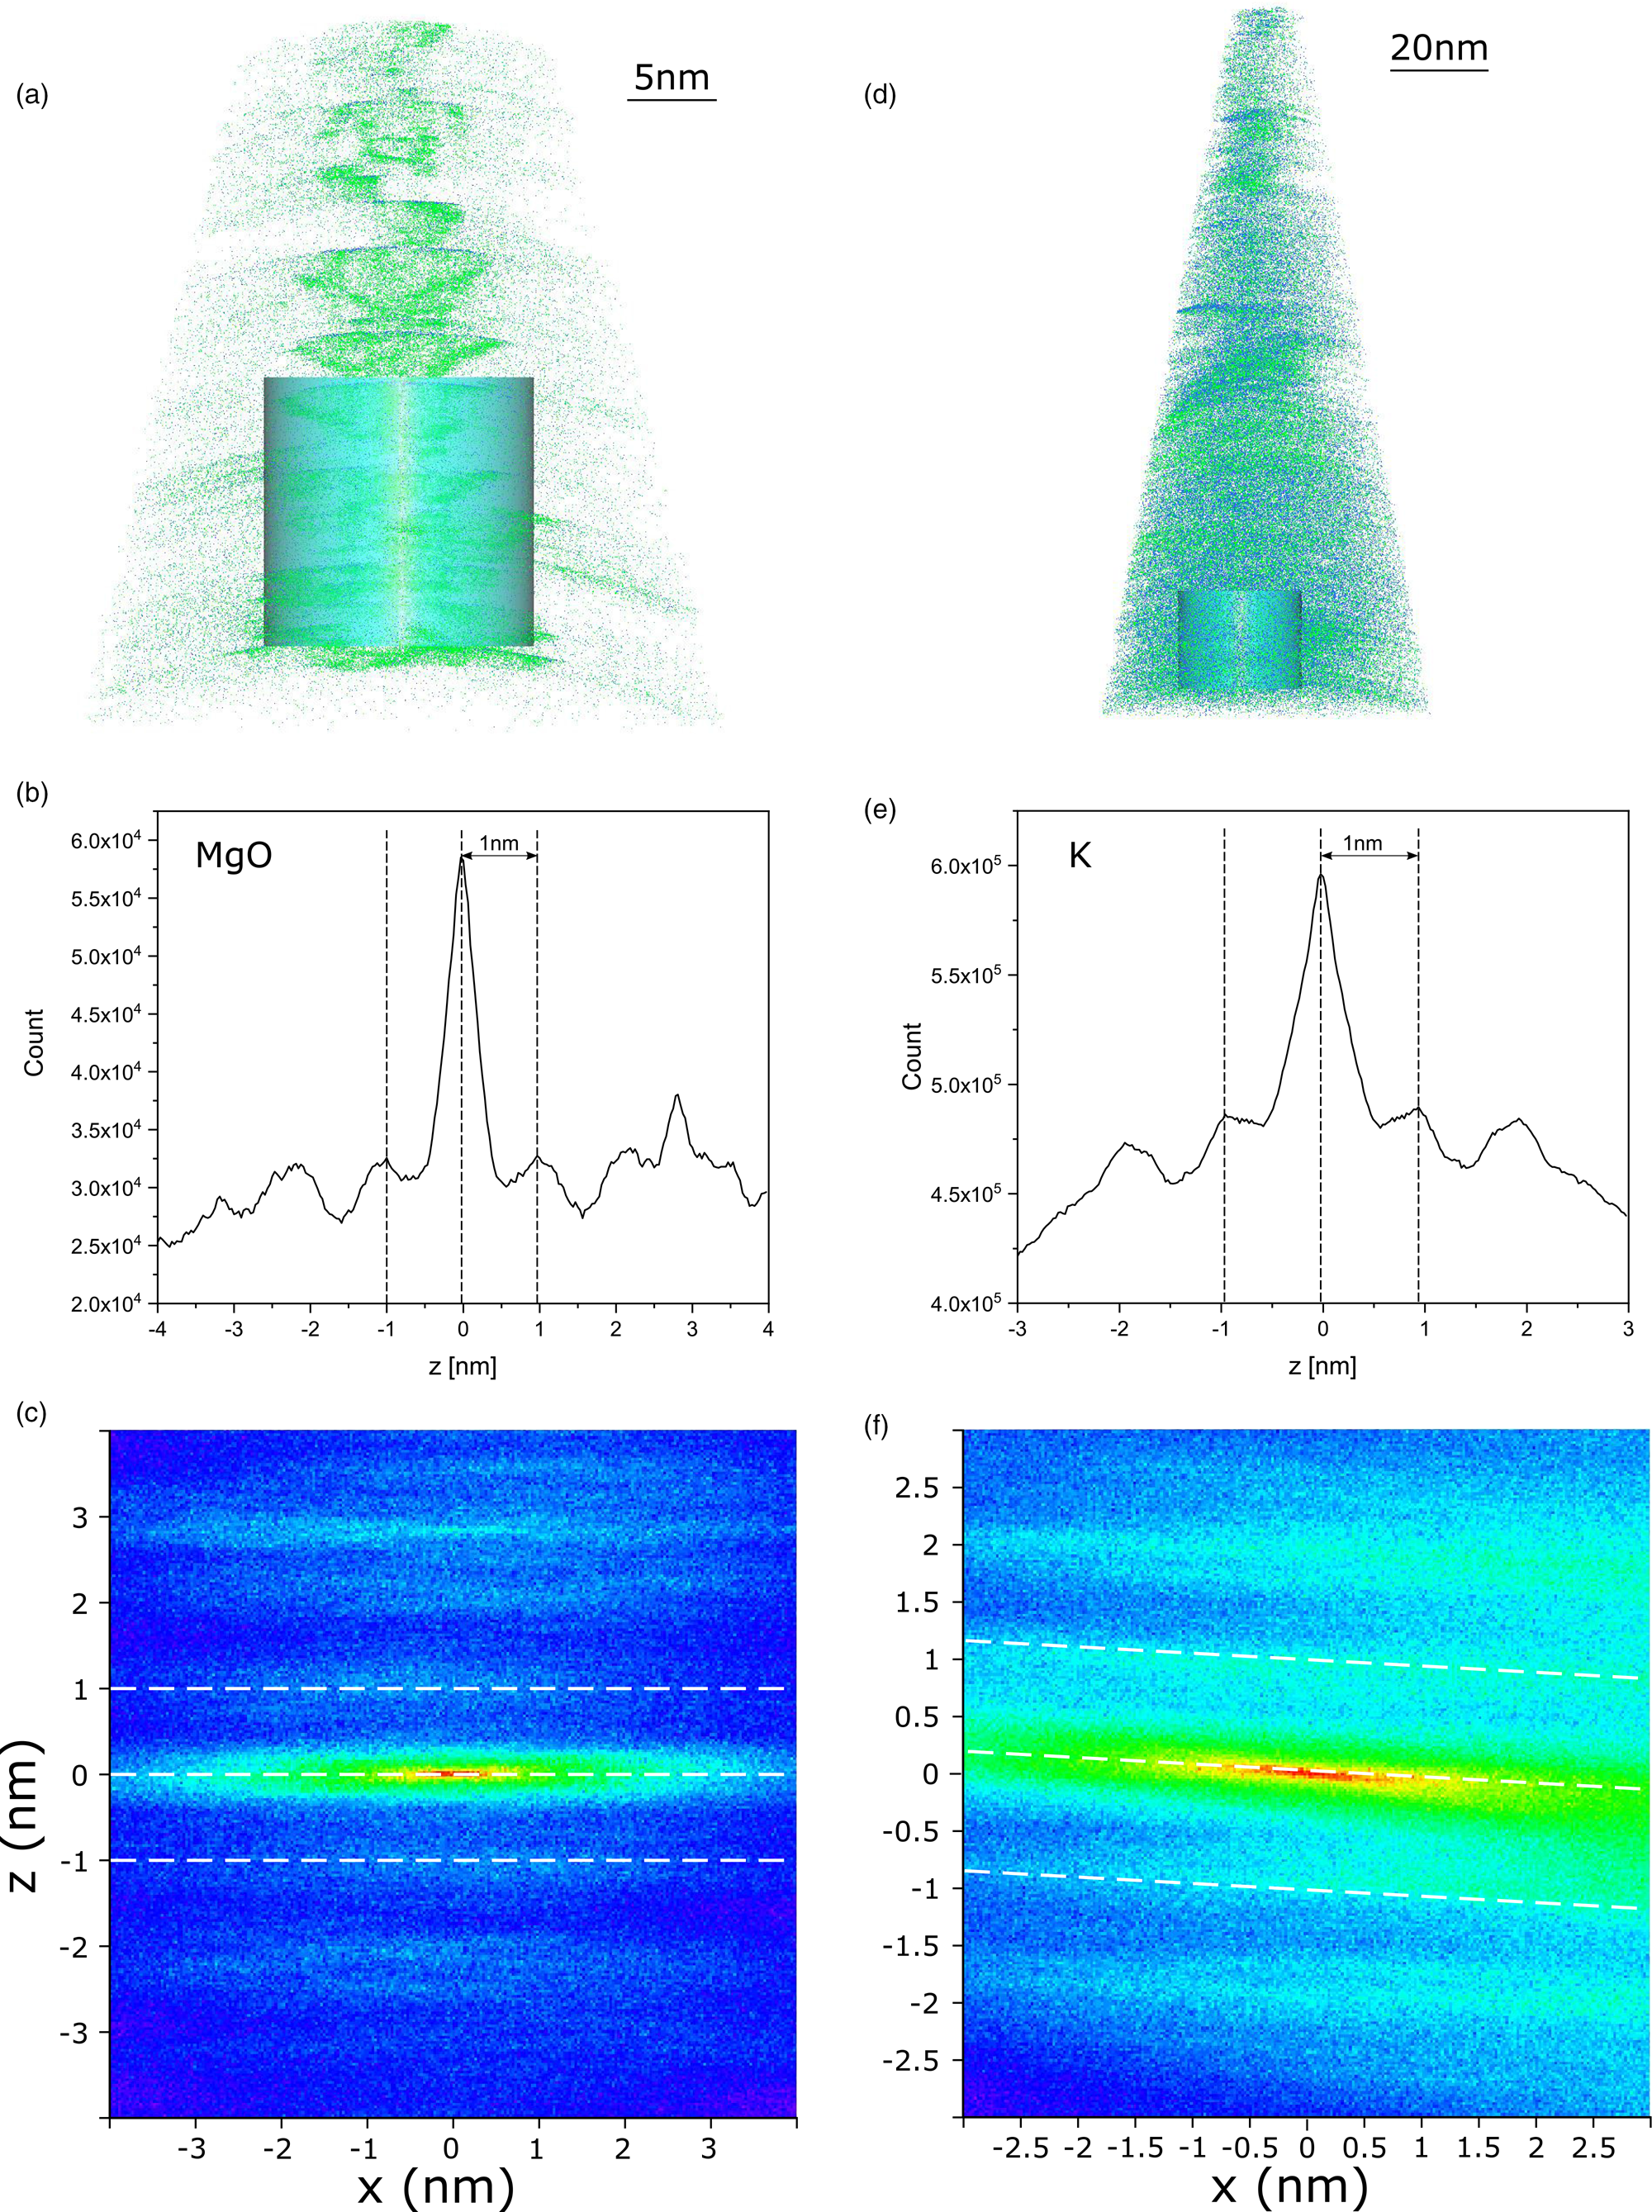
Fig. 9. 3D reconstructions (a,d) and spatial distribution maps (SDM) (b,c,e,f) of representative 001 and hk0 specimens. In (a,d), MgO (blue) and K atoms (green) are projected in the z–x plane (x-ortho projection); light blue cylinders are regions of interest where the SDMs were performed. In (b,e), intensity distribution of MgO and K, respectively, along the z-axis. In (c,f), view down the y-axis of the same data in (b,e), respectively. For the SDMs, the z-plane offset was 0 nm, and the cut in xy was 0.01 nm. Black and white dashed lines highlight the distance between atomic planes of the {001} family.
Summary and Conclusion
Atom probe tomography is opening a new pathway for mineral investigation at the nanoscale level, enabling further insights in mineral structure and composition that will complement the knowledge gained by other techniques such as HRTEM or SIMS. In this study, APT was used, for the first time, to analyze a highly anisotropic mica mineral. Several observations were made that can be summarized as follows:
1. Both chemical and structural analysis of the studied Mg-rich biotite show significant differences between the two considered crystallographic orientation, highlighting the importance of the knowledge of the mineral physicochemical properties and their relationship with the mineral crystallography for the correct interpretation of the APT data set.
2. Apparent high-efficiency detection of Mg was observed regardless of the crystallographic orientation leading in all cases to biases in the mineral composition estimation. Also, an oxygen deficit was registered, especially for 001 specimens. Furthermore, peak overlap deconvolution was in some cases unattainable, hindering the correct concentration estimate of some elements. Still, stoichiometric ratios similar to those calculated by EPMA were obtained for Si, Al, Mn, Na, and K.
3. Ion spatial distributions show peculiar patterns that are artifacts of field evaporation. Displacements of atom positions in the reconstructions were probably due to trajectory aberrations arising from a rearrangement of the electric field after the first evaporation events (for 001 specimens) or a deviation of the tip apex from an ideal spherical geometry (for hk0 specimens).
Important questions remain to be answered about mica behavior subjected to an intense laser pulse under high electric field conditions, however the preliminary results obtained are extremely promising. Yet, some strategies could be employed for improving APT analysis of mica minerals. Analysis parameters not explored in the present study could be investigated. For example, higher temperatures could favor the analysis yield avoiding early fracture as it has been proved in the case of brittle materials. Furthermore, specimen preparation with a plasma focused ion beam (e.g., Xe+ Plasma FIB-SEM dual-beam microscope) would avoid Ga implantation leading to a more representative reconstruction of the ion's spatial distribution.
Despite the limitations rising from the instrument technology (e.g., nominal efficiency, resolution) and issues related to the field evaporation process in nonconductive materials, basic investigation on both APT technology (e.g., terahertz-driven APT, Vella et al., Reference Vella, Houard, Arnoldi, Tang, Boudant, Ayoub, Normand, Da Costa and Hideur2021; new generation of APT detectors, Bacchi et al., Reference Bacchi, Da Costa, Cadel, Cuvilly, Houard, Vaudolon, Normand and Vurpillot2021) and data processing [e.g., by new copyrighted (APT Suite 6 from CAMECA) and open source software (Kühbach et al., Reference Kühbach, Bajaj, Zhao, Çelik, Jägle and Gault2021)] is developing fast, providing analytical methods and atomic models needed to explain, predict, and correct the bias in mineral composition estimates and the inaccuracy in spatial reconstructions. Hence, future applications of APT for clay minerals are already in sight, with fundamental implications in geosciences, and other fields of study, including biosciences and materials sciences.
Supplementary material
To view supplementary material for this article, please visit https://doi.org/10.1017/S1431927621012940.
Acknowledgments
This research was funded by the U.S. National Science Foundation (NSF), grant numbers EAR-1647012 and EAR-2019870. T.P. and A.B.S. acknowledges support of Laboratory Directed Research and Development Program through Ames Laboratory. Microscopy work (FIB-SEM and STEM imaging) was performed using instruments in the Sensitive Instrument Facility at the Ames Laboratory, which is operated for the U.S. DOE by Iowa State University under contract # DE-AC02-07CH11358. Finally, this study utilized resources owned and maintained by the Alabama Analytical Research Center (AARC), supported by The University of Alabama.


 Open access