


Introduction
The way cancer has been considered and investigated over the last century has been mainly as a genetic disease primarily characterised by dysregulated cell growth. A variety of aberrations in oncogenes leading to gain of function or amplification, and in tumour suppressor genes from inactivating point mutations or epigenetic silencing, have been considered as responsible for the cancer phenotype. Although this understanding has helped to unravel many aspects of this complex disease, it also led to the neglect of early, often biochemical findings, on the role of cancer metabolism, such as the Warburg effect. New evidence is now linking many tumour suppressors and oncogenes to the regulation of metabolism and the need of highly-proliferating cancer cells to juggle nutrient utilisation in a manner that supports continuous and fast cell growth and survival. In over two-third of human cancers, at least one glycolytic gene is constitutively overexpressed (Ref. Reference Altenberg and Greulich1). Thus, current research is actually returning back to classical biochemical studies to further understand their implication in disease initiation and progression with the hope that new applications of those old discoveries will lead to the development of new therapeutics.
Cancer cells, like highly proliferating normal cells, are faced with the task to generate sufficient ATP to maintain energy status as well to produce increasing amounts of biosynthetic metabolites and precursors, whilst balancing the cellular redox status. In particular, for cancer cells, they also need to adapt their metabolic processes to a different environment from normal tissue, where nutrient supplies may be exhausted as well as instability in the redox balance, pH and oxygen levels (Ref. Reference Muir and Vander Heiden2). One such adaptive mechanism is aerobic glycolysis or the Warburg effect, in which cancer cells ferment glucose to lactate despite an ample oxygen supply.
This review describes the Warburg effect from a historical perspective, how this fundamental finding on cancer metabolism was forgotten for several decades before re-emerging with the discovery of metabolic oncogenes and how the Warburg effect forms the basis of several therapeutic strategies in cancer currently used or in development.
Historical perspectives on the Warburg effect
Warburg's work on glycolysis in cancer cells came at a time when the scientific community was mainly focusing on lipolysis and/or proteolysis as the energy-providing reactions that drive cancer cell growth rather than on glucose metabolism (Ref. Reference Warburg3). Following on from his observations on the sea urchin egg, for which a significant increase in oxygen uptake and rapid cell division occurred after fertilisation, Warburg expected a similar increase in oxygen uptake in cancer tissues (Refs Reference Warburg3, Reference Warburg4).
Together with Seigo Minami, Warburg observed that Flexner–Jobling rat liver tumours were able to acidify the surrounding isotonic salt solution after the addition of glucose by releasing lactic acid into this solution (Ref. Reference Warburg and Minami5). Warburg and coworkers went on to further examine glycolysis in rat liver carcinoma slices by measuring oxygen consumption as well as carbon dioxide production under aerobic and anaerobic settings using his improved manometric technique (Refs Reference Warburg, Posener and Negelein6, Reference Warburg7). In this experimental set up, they made three key observations: (1) the production of lactic acid under anaerobic conditions was much higher in rat carcinoma tissues compared with the reference values from the literature for, for example, human blood or frog muscle, (2) the carcinoma did not take up more oxygen under aerobic conditions than normal tissue and (3) by moving the carcinoma from anaerobic to aerobic conditions, the amount of lactate produced was only marginally reduced (Ref. Reference Warburg, Posener and Negelein6). These findings can be summarised as aerobic glycolysis or later termed the Warburg effect, which is the preference of tumours for fermentation of glucose to lactate even in the presence of sufficient amounts of oxygen. This is in contrast to normal tissue that exhibits the Pasteur effect of completely stopping lactate production in the presence of sufficient amounts of oxygen (Fig. 1) (Ref. Reference Warburg, Posener and Negelein6). Similar results were obtained in different human carcinomas (from larynx, intestine, penis, nose and skin) and comparison with benign tumours showed that malignant tissue produced 3–4 times more lactic acid (Ref. Reference Warburg, Posener and Negelein6). Elegant in vivo experiments by Cori and Cori demonstrated that low lactic acid concentrations within the tumour were maintained by releasing lactic acid into the bloodstream (Refs Reference Cori and Cori8, Reference Cori and Cori9). Later experiments by Warburg and coworkers revealed even higher levels of fermentation in Ehrlich ascites cancer cells from mice compared with the findings in rat sarcomas, a fact probably because of a higher percentage of cancer cells in the mouse ascites cancer (Ref. Reference Warburg and Ernst10).
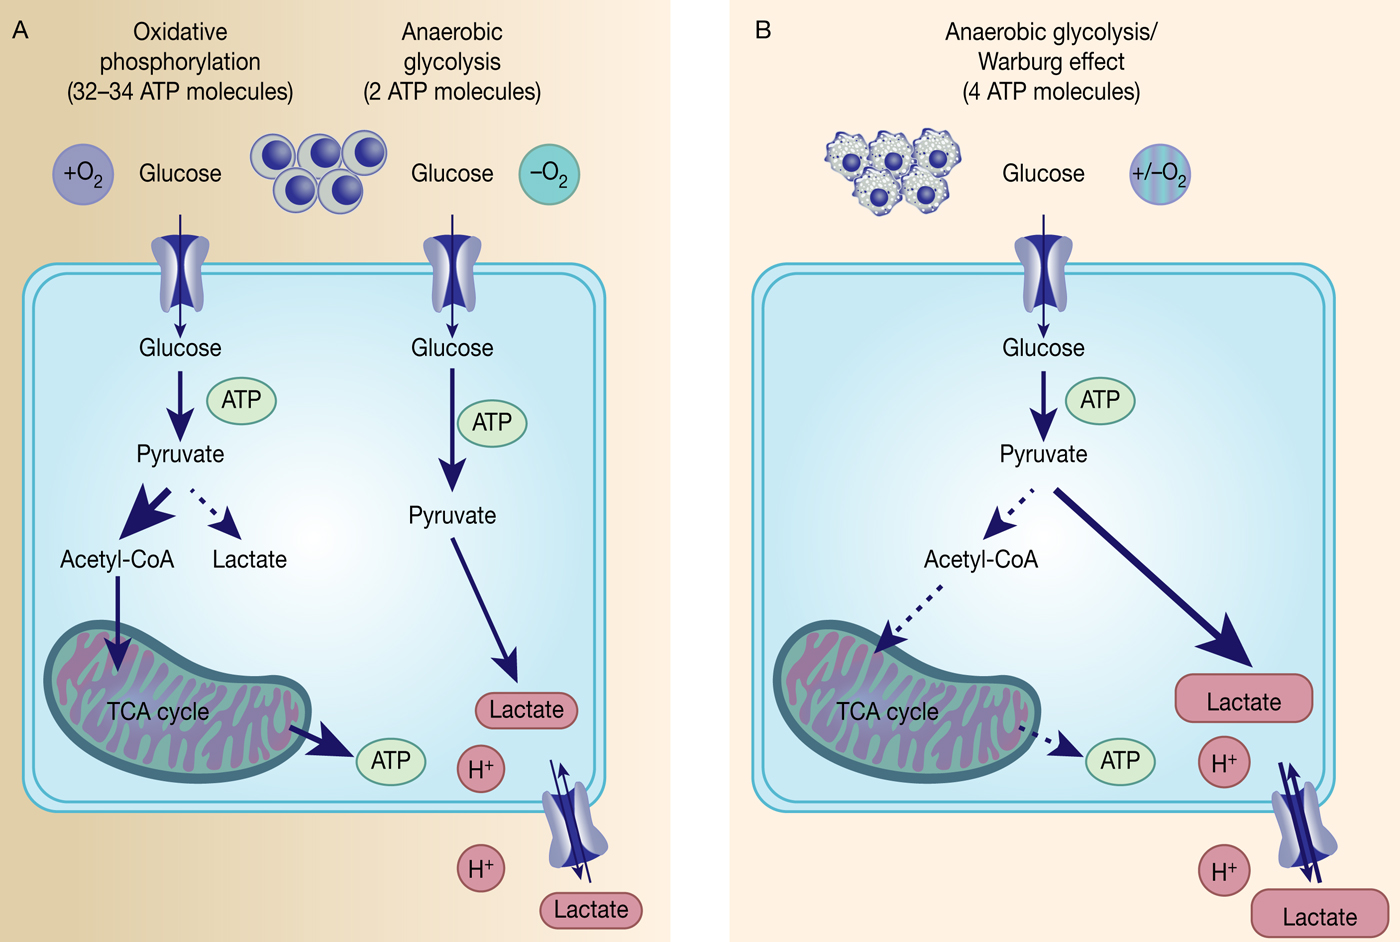
The Warburg effect in cancer. Differentiated, normal tissues (a) metabolise glucose depending on oxygen levels with normoxic conditions favouring complete glucose metabolism in the mitochondria to maximise ATP production (oxidative phosphorylation). Under low oxygen levels, the majority of glucose will be metabolised to lactate, which is excreted from the cells, but allows sustaining a minimum level of ATP production (anaerobic glycolysis). In contrast, tumour cells (b) mainly metabolise glucose to lactate independent from intracellular oxygen levels and despite of thereby producing less ATP compared with full oxidation of pyruvate within the mitochondria (aerobic glycolysis or Warburg effect).
Warburg initially reasoned that the observed decrease in oxidative phosphorylation under normoxic conditions was because of defects in the mitochondrial respiration of cancer cells resulting in compromised aerobic respiration and subsequent reliance on glycolytic metabolism (Ref. Reference Warburg11). To him the irreversible injury of respiration was the essential common cause and origin of cancer, a hypothesis that led to major scientific controversies and was generally not accepted among most biochemists and oncologists because of missing experimental evidence (Refs Reference Warburg12, Reference Weinhouse13, Reference Racker and Spector14). However, subsequent evidence emerged to suggest that respiration is generally not impaired in cancer cells and today we appreciate that the high rate of glycolysis exhibited by cancer cells under normoxic conditions is not due to damaged respiration, but rather changes in the molecular aspects of glycolysis.
However, the reasons behind the Warburg effect are under continuous investigation. Although oxidative phosphorylation yields between 32 and 34 ATP molecules per molecule of glucose, glycolysis only produces two molecules of ATP per molecule of glucose (Ref. Reference Cooper15) (Fig. 1). Despite being the energetically less favourable pathway, it is likely that there is a selective advantage for cancer cells to adapt their metabolism to glycolysis, such as being a way to balance energy production and generation of necessary building blocks to support proliferation.
Rediscovery of the metabolic role in cancer through the Darwinian evolution of the cancer genome
Over the last two decades, there has been a strongly increasing interest and re-examination of the Warburg effect and cancer metabolism with the reprogramming of metabolism in cancer being added to the original set of hallmarks of cancer from Hanahan and Weinberg in 2011 (Ref. Reference Hanahan and Weinberg16).
Prior cancer research had mainly focused on understanding genetic alterations in cancer with the identification of oncogenes and tumour suppressor genes as main types of cancer-causing genes (Refs Reference Stehelin17, Reference Tabin18), while oncogenic alterations of cell metabolism were considered as secondary effects. Extensive studies of the genetics of many tumours, facilitated by high-throughput sequencing techniques, highlight the strong inter- and intratumour heterogeneity, which account for one of the major challenges in the treatment of cancer. Our current understanding of how intratumour genetic complexity arises follows one of the first descriptions of cancer as an evolutionary process from Peter Nowell in the 1970s (Ref. Reference Nowell19). Reminiscent of the Darwinian evolution theory of the ‘survival of the fittest’, tumourigenesis follows a natural selection process governed by environmental selection forces and cellular adaption strategies in order to confer a selective survival advantage to the cell (Refs Reference Nowell19, Reference Greaves20). This perception had not only brought the importance of the tumour micro-environment back into focus, but also made researchers look more closely at how cancer cells adapt to the particular challenges of a highly proliferative cell, and thus cancer metabolism. Additionally, further elucidation of cancer-related driver mutations, that is, mutations that arise during tumourigenesis and provide a selective advantage for the tumour cells, identified that many have a significant role in core signalling pathways responsible for nutrient uptake and metabolism (Ref. Reference Sever and Brugge21). It has been shown that many mutated key signalling pathways come together in order to adapt tumour metabolism and to sustain tumour growth and survival (Ref. Reference Sever and Brugge21).
Historically, the first metabolic pathways to be studied biochemically in cancer were the nucleotide de novo and salvage pathways. Enhanced activities of enzymes within these pathways, especially of the salvage pathway, leading to increased nucleotide levels were reported in tumours, such as hepatomas, lung and renal cell carcinoma (Refs Reference Jackson22, Reference Natsumeda23). Increased nucleotide synthesis in cancer epitomises the adaption of metabolism to cope with the demands of high proliferation and has been a consistent area of interest and target for chemotherapeutics (see ‘Antimetabolites’). Although alterations in nucleotide metabolism have been studied continuously, carbohydrate metabolism, the focus of this review, went through a long period of neglect. It was only after the identification of germline mutations in different metabolic enzymes, such as fumarate hydratase (FH), succinate dehydrogenase (SDH) and isocitrate dehydrogenase (IDH), that metabolic enzymes involved in this pathway were considered to play an important role in tumourigenesis (Refs Reference Tomlinson24–Reference Parsons26). Today, not only are mutations in oncogenes or tumour suppressor genes known to impact on metabolic reprogramming, but also the idea of metabolic oncogenes has emerged, such as highlighted in the cases of IDH and 3-phosphoglycerate dehydrogenase (PHGDH).
IDH1/2 as an example in malignant gliomas/AML
Identification of somatic activating mutations in IDH1 in glioblastoma (GBM) was a key to opening a renewed interest in cancer metabolism and its impact on tumourigenesis (Ref. Reference Parsons26). IDH1 encodes a cytosolic form of IDH, which catalyses the oxidative carboxylation of isocitrate to α-ketoglutarate (α-KG) within the Krebs cycle. A large sequence analysis of 20 661 protein coding genes in 22 human tumour samples identified point mutations in IDH1 which all lead to substitutions in the same amino acid (arginine 132) and were mainly prevalent in younger patients (mean age of 33 years) and patients with secondary GBM (Ref. Reference Parsons26). Initial follow-up studies found mutations in IDH1 or IDH2 in over 70% of WHO grade II/III astrocytomas, oligodendrogliomas and GBMs (Ref. Reference Yan27) as well as IDH1 mutations in about 8% of acute myeloid leukaemia (AML) patient samples (Ref. Reference Mardis28) with later genomic analysis confirming IDH mutations in several types of cancer (reviewed in Ref. Reference Dang, Yen and Attar29). Both IDH1 and IDH2 mutations cause a gain-of-function in enzyme activity towards reduction of α-KG to the oncometabolite R-2-hydroxyglutarate (2-HG) while oxidising NADPH/H+ (Refs Reference Dang30, Reference Ward31). Although 2-HG is only present at very low concentrations in normal cells with no attributed function (Ref. Reference Dang, Yen and Attar29), it was not clear how 2-HG was potentially driving cancer. The first hint came from a profiling study of DNA methylation patterns in GBM tumours in which a large subset (mainly from the proneural subtype) displayed a hypermethylation pattern of CpG islands (CIMP) together with a frequent IDH1 mutation (Ref. Reference Noushmehr32). This correlation between the CIMP phenotype and IDH1 mutation was further strengthened by showing that the introduction of a mutation in IDH1 was sufficient to establish the hypermethylator phenotype in gliomas (Ref. Reference Turcan33). Mutational and epigenetic profiling of AML patients revealed IDH1/2 mutations to be mutually exclusive with loss-of-function mutations in TET2 (Ref. Reference Figueroa34). TET2 is an α-KG-dependent dioxygenase that hydrolyses 5-methylcytosine, and is one of several α-KG-dependent dioxygenase, including histone methyltransferases, histone demethylases and prolyl hydroxylases, that is competitively inhibited by 2-HG (Ref. Reference Xu35). Thus, a mutation in IDH1/IDH2 leads to the accumulation of the oncometabolite 2-HG which in turn then inhibits various α-KG-dependent dioxygenases resulting in a genome-wide alteration of the histone and DNA methylation pattern (Fig. 2).
Somatic IDH1/2 mutations reduce α-KG to the oncometabolite 2-HG. Mutant IDH1/2 (IDH1/2mut) have gained the function to reduce α-ketoglutarate (α-KG) to the oncometabolite R(-)-2-hydroxyglutarate either in the mitochondria by IDH2mut or in the cytosol by IDH1mut, which then inhibits several α-KG-dependent dioxygenases, which leads to genome-wide alteration of the histone and DNA-methylation patterns and HIF1 regulation.

However, the clear role of IDH mutations in tumour formation and progression is still being investigated. IDH1 mutations have been proposed as very early events in tumourigenesis in gliomas with IDH1 mutations occurring prior to the acquisition of TP53 mutations, loss of chromosome 1p/19q or copy number alterations of phosphatase and tensin homologue (PTEN) and EGFR (Refs Reference Watanabe36, Reference Lai37). IDH1 R132H mutation was also found to be the only shared mutation between initial and recurrent tumours of 23 GBM patients (Ref. Reference Johnson38) as well as being maintained in 95% of secondary GBMs in another analysed cohort of 106 gliomas (Ref. Reference Lass39). In addition, studies of haematopoietic disorders found IDH1/2 mutations in premalignant disease forms, such as myelodysplastic and myeloproliferative neoplasms (Refs Reference Kosmider40, Reference Pardanani41). However, in vivo mouse models introducing IDH2 mutations showed that this mutation on its own was insufficient to drive leukemogenesis and rather had the role of a cooperative tumourigenic driver in AML (Refs Reference Kats42, Reference Chen43). Although no spontaneous tumour formation was observed after introduction of an IDH1 mutation in several cell types of the murine central nervous system, mutant IDH1 seems to have a clear role in tumour maintenance as pharmacological inhibition of mutant IDH1 impairs growth in established glioma xenograft models (Refs Reference Sasaki44, Reference Rohle45). Although these findings support the role of IDH mutations in tumourigenesis and tumour maintenance, further investigations are needed to determine exactly to what extent and in what precise context.
PHGDH: the first enzyme of the de novo serine synthesis pathway
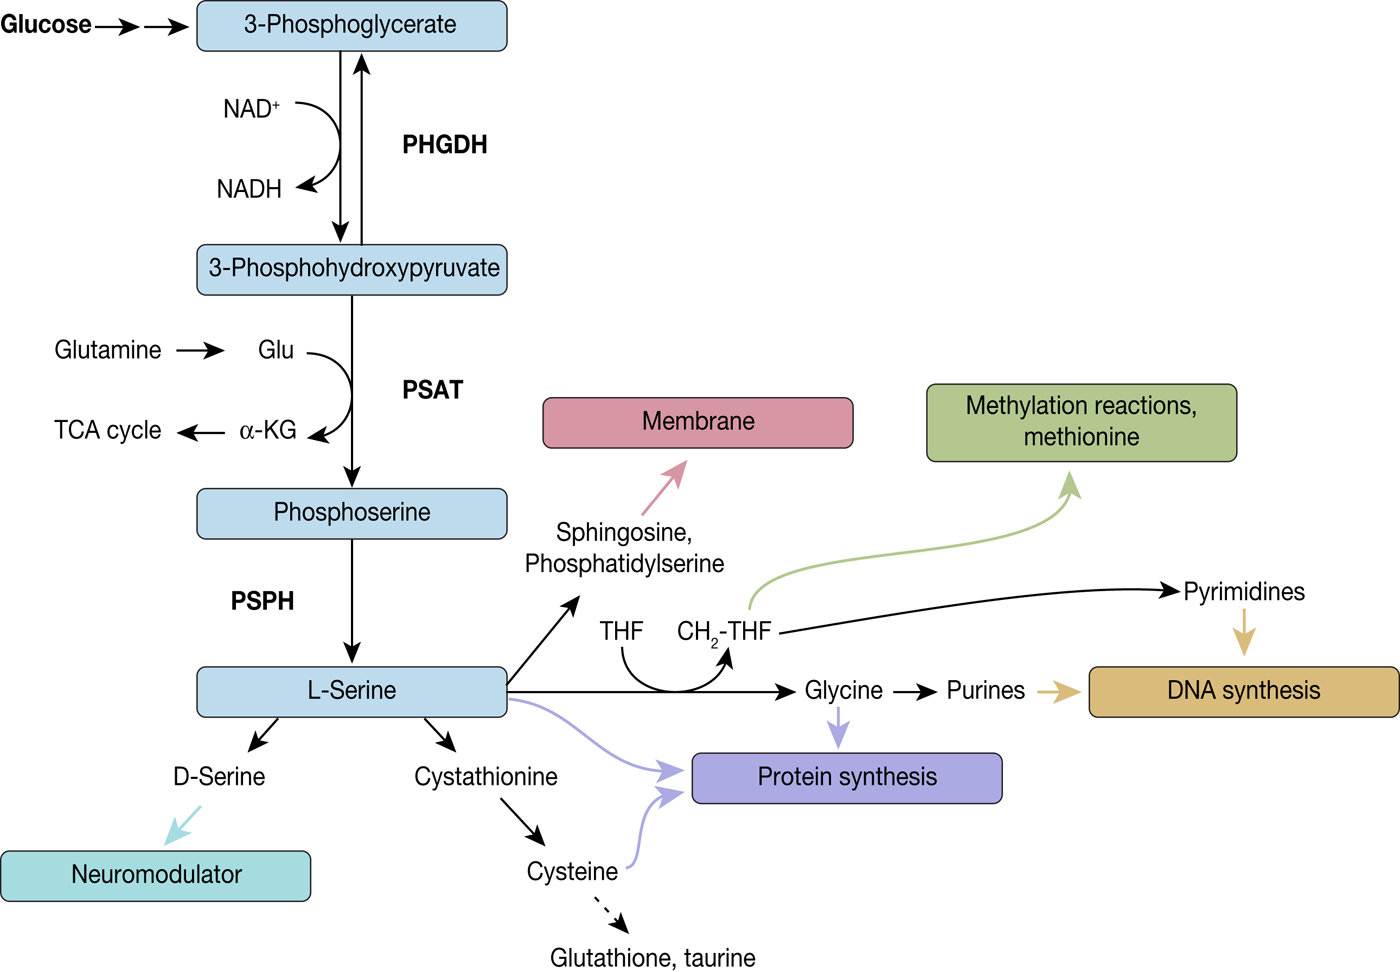
The de novo serine synthesis pathway comprises a three-step reaction cascade from 3-phosphoglycerate to L-serine, consecutively catalysed by PHGDH, phosphoserine aminotransferase (PSAT) and phosphoserine phosphatase (PSPH) (Fig. 3). The first indication of serine synthesis pathway alterations in cancer came from studies by Davis et al., who had observed increased PHGDH activity in rat hepatoma cell lines in comparison to their corresponding normal host liver cells (Ref. Reference Davis, Fallon and Morris46). Subsequent studies by Snell and coworkers confirmed increased PHGDH activity in rat hepatomas, which was correlated with their growth rate, as well as in human colon carcinoma samples providing yet more evidence of PHGDH's link to tumour initiation and progression (Refs Reference Snell and Weber47, Reference Snell48).
Diversion into the synthesis of biomolecules through PHGDH. PHGDH diverts the glycolytic flux by oxidising 3-phosphoglycerate (3-PG) to 3-phosphohydroxypyruvate (3-PHP) and thereby reducing NAD+ to NADH. 3-PHP is further converted to phosphoserine by phosphoserine aminotransferase (PSAT), which is combined with the formation of α-ketoglutarate from glutamate, followed by dephosphorylation by phosphoserine phosphatase (PSPH) leading to L-serine. L-serine itself is a precursor for various biomolecules and by these means implicated in several biological processes, such as neuromodulation, protein and membrane synthesis, methylation reactions and DNA synthesis.
However, only enzymatic activities had been compared so far and it was not until 25 years later that genomic and metabolomic analysis rediscovered PHGDH in the context of cancer (Refs Reference Locasale49–Reference Pollari51). Negative-selection RNAi screening in a human breast cancer xenograft model identified PHGDH within a predefined set of 133 metabolic enzymes as an essential gene for tumourigenesis and within a region of frequent copy number alterations (Ref. Reference Possemato50). Further analysis of a cohort of human breast tumours revealed 70% of ER-negative tumours having increased levels of PHGDH mRNA and protein (Ref. Reference Possemato50). This supported a previous study that had already shown a correlation between high PHGDH mRNA levels and poor 5-year survival in ER-negative, basal breast cancers (Ref. Reference Pollari51). Next to genomic amplification, PHGDH expression can also be upregulated by the transcription factors ATF4 (Ref. Reference Adams52) and c-Myc (Ref. Reference Nilsson53) or through epigenetic activation of PHGDH by histone H3 lysine 9 methyltransferase (Ref. Reference Ding54). In addition, reinvestigation of a pooled analysis of somatic copy number alterations revealed PHGDH as a frequently amplified gene across 3131 cancer samples (Ref. Reference Beroukhim55). PHGDH is located on chromosome 1p12 in a peak region that displays repeated copy number gain in 16% of the cancers assessed with no known oncogenes contained in that particular region (Refs Reference Locasale49, Reference Beroukhim55). The most common tumour type with PHGDH gain was melanoma, with 40% frequency in PHGDH amplification (Ref. Reference Beroukhim55). Consistent with the genetic data, reduced proliferation was seen in melanoma and breast cancer cell lines containing PHGDH copy number gain or elevated PHGDH expression following knockdown of PHGDH (Refs Reference Locasale49, Reference Possemato50). However, translation of these findings to xenograft models had different outcomes with studies in breast cancer and non-small cell lung cancer xenografts showing the suppression of tumour growth following PHGDH knockdown (Refs Reference Possemato50, Reference DeNicola56), whereas in another study no effect of PHGDH knockdown was observed in established breast cancer xenograft models (Ref. Reference Chen57).
To date, many tumour types have been reported to exhibit increased levels of PHGDH expression, such as cervical, glioma, colon, melanoma, pancreatic, liver as well as kidney tumours (Ref. Reference Grant58). However, how PHGDH drives tumourigenesis and progression still needs to be further validated. Overexpression of catalytic dead PHGDH fails to rescue the PHGDH knockdown phenotype (Ref. Reference Mattaini59), similarly, the supply of exogenous amounts of serine or methyl-serine-ester to the cell culture media does not restore cell proliferation following PHGDH knockdown (Ref. Reference Possemato50). Exploring a role for PHGDH beyond serine synthesis identified human PHGDH as being able to catalyse the NADH-dependent reduction of α-KG to the oncometabolite 2-HG, a function previously only known for PHGDH from Escherichia coli, but at the same time the amounts of 2-HG generated were 100–1000 times lower than those in IDH mutant cancers (Ref. Reference Fan60). Another study showed that hypoxia-induced HIF-1 and HIF-2 expression increased the expression of PHGDH and other enzymes of the de novo serine synthesis pathway, in breast cancer cell lines and breast cancer stem cells-enriched cell populations (Ref. Reference Samanta61). Under hypoxic conditions, PHGDH knockdown resulted in decreased NADPH levels and subsequent increase of mitochondrial ROS levels and sensitised breast cancer cell lines to carboplatin (Ref. Reference Samanta61). Additionally, PHGDH has been reported to stabilise the transcription factor FOXM1 in glioma, which in turn leads to increased expression of genes involved in tumour invasion, angiogenesis and cell cycle regulation (Ref. Reference Liu62). PHGDH has also been shown to be linked to the NAD+ salvage pathway with breast cancer cell lines overexpressing PHGDH being highly sensitive to inhibition of the NAD+ salvage pathway through NAMPT inhibitors (Ref. Reference Murphy63).
Oncogenes and tumour suppressors change the metabolic gene expression underlying aerobic glycolysis
In addition to the genetic mutations of metabolic enzymes, there are also other changes in molecular mechanisms that have been shown to contribute to the Warburg phenotype in cancer, such as activation of transcription factors (e.g. HIF-1 or Myc) or signalling pathways (e.g. PI3K/Akt) as well as the inactivation of tumour suppressors (e.g. p53). These genetic alterations have an impact on several aspects of cancer metabolism, but within the scope of this review, we will be focusing on mechanisms related to aerobic glycolysis.
Activation of transcription factors
Amplified or overexpressed MYC has been identified in a plethora of human cancers and it was shown to transcriptionally regulate a variety of processes, such as proliferation, cell size, apoptosis and metabolism (Ref. Reference Meyer and Penn64). Following activation, c-Myc and its cofactor Max bind to the ‘E-boxes’ consensus sequences present in a majority of target genes involved in metabolism (Ref. Reference Kim65). Using 13C-labelled glucose, Myc has been shown to upregulate glucose consumption in Burkitt lymphoma cells (Ref. Reference Le66). Myc expression promotes glucose uptake through increasing the expression of glucose transporter GLUT1 as well as upregulating glucose catabolism through increased expression of glycolytic enzymes, such as hexokinase 2, phosphofructokinase-M 1 and enolase 1 (Refs Reference Kim65, Reference Osthus67). In addition, Myc was shown to block the transcription factor MondoA in triple-negative breast cancer, which results in the inhibition of thioredoxin-interacting protein to then stimulate aerobic glycolysis (Ref. Reference Shen68). Myc also upregulates the transcription of heterogeneous nuclear ribonucleoproteins and thereby indirectly promotes the expression of isoform M2 of pyruvate kinase (PKM2), which is the predominant isoform in cancer, supporting the diversion of glycolytic intermediates towards anabolic metabolism (Ref. Reference David69). The metabolic switch in cancer is further favoured by c-Myc-mediated activation of the enzymes within the de novo serine synthesis pathway, with PSPH being particularly important for c-Myc-driven hepatocellular cancer progression in vitro and in vivo (Ref. Reference Sun70). Another glycolytic gene upregulated by Myc is Lactate dehydrogenase A (LDHA), with lactate dehydrogenase A being responsible for the final step in aerobic glycolysis: the conversion of pyruvate to L-lactate (Ref. Reference Shim71). In addition, Myc also induces overexpression of the bidirectional monocarboxylate transporter MCT1, which facilitates lactate excretion from the cells (Ref. Reference Doherty72). Lactate has been proposed to support cancer aggressiveness by triggering angiogenesis and was shown to stimulate the accumulation of hypoxia-inducible factor 1 α (HIF-1α) activation in GBM cells (Refs Reference Sonveaux73, Reference Lu, Forbes and Verma74).
HIF-1 and HIF-2 are major transcription factors made of the heterodimeric complex of α and β subunits and responsible for the adaptive response to hypoxic conditions (Ref. Reference Maxwell, Pugh and Ratcliffe75). HIF1α is better characterised with regards to cancer metabolism. Under normoxic conditions, HIF1α levels are tightly regulated, but become aberrantly activated by oncogenic signalling pathways, such as PI3K/AKT/mTOR (Ref. Reference Sun76), or mutations in tumour suppressor proteins, such as the von Hippel–Lindau protein (VHL) (Ref. Reference Maxwell77). Independent of oxygen level mutations in the Krebs cycle, enzymes FH and SDH lead to overexpression and stabilisation of HIF1α by fumarate and succinate suggesting a positive feedback mechanism as HIF1α in turn promotes glycolysis (Refs Reference Gimenez-Roqueplo78, Reference Pollard79). Similar to Myc, glucose transporters as well as glycolytic enzymes are also under the control of HIF-1 and promote glucose import and glycolysis under normoxic conditions (Refs Reference Maxwell80, Reference Semenza81). In addition, HIF-1 also prevents the flux of pyruvate into the mitochondrial TCA cycle by activating pyruvate dehydrogenase kinase 1 (PDK1) as well as LDHA (Refs Reference Semenza81, Reference Kim82). PDK1 phosphorylates and thereby inactivates pyruvate dehydrogenase (PDH) and thus prevents the conversion of pyruvate to acetyl coenzyme A, the metabolite to enter mitochondrial TCA, while increased LDHA expression results in more pyruvate being metabolised to lactate.
Overall these activated transcription factors contribute to the reprogramming of the glucose metabolism according to Warburg's observations by: (1) promoting glucose uptake through upregulation of glucose transporters, (2) supporting aerobic glycolysis through increased expression of glycolytic enzymes under normoxic conditions and (3) supporting lactate production and excretion via monocarboxylate transporters (MCT) to divert pyruvate from the TCA cycle in the mitochondria (Fig. 4).
Myc- and HIF1α-activated pathways. Myc and HIF1α promote the Warburg effect in cancer cells by upregulating critical pathways: increased glucose uptake through high expression of glucose transporters GLUT1 and GLUT3, increased lactate synthesis and excretion through overexpression of LDH-A and MCT1, diversion of the glycolytic metabolites to anabolic metabolism through upregulated PKM2, stimulation of aerobic glycolysis through inhibition of MondoA.

Inactivation of tumour suppressors: exemplified by p53
Several tumour suppressors have been reported to regulate cancer metabolism, such as PTEN and retinoblastoma protein as well as VHL, mentioned above (Ref. Reference Iurlaro, Leon-Annicchiarico and Munoz-Pinedo83). However, the most prominent representative of this group is p53 with missense mutations in its encoding gene TP53 occurring in up to 50% of all cancers (Ref. Reference Cole84). Loss of p53 function has been shown to contribute to the Warburg effect through several mechanisms. Glucose import into the cell is partly regulated by p53 through direct repression of the transcription of GLUT1 and GLUT4 as well as through inhibition of NF-κB, which represses GLUT3 expression (Refs Reference Schwartzenberg-Bar-Yoseph, Armoni and Karnieli85, Reference Kawauchi86). In addition, p53 induces the transcription of TIGAR (TP53-induced glycolysis and apoptosis regulator), which results in lowering the intracellular fructose-2,6-bisphosphate (F26BP) levels (Ref. Reference Bensaad87). As F26BP is the allosteric activator of phosphofructose kinase 1 (PFK1), its depletion decreases PFK1 activity and thus promotes diversion of glycolysis into the pentose phosphate pathway. P53 also intervenes with the conversion of pyruvate to lactate or acetyl-CoA by downregulating the monocarboxylate transporter MCT1 and thus lactate excretion from the cells on one hand whilst promoting conversion of pyruvate to acetyl-CoA by PDH by downregulating pyruvate dehydrogenase kinase-2, which in turn results in PDH activation on the other hand (Refs Reference Boidot88, Reference Contractor and Harris89). In addition, p53 upregulates the expression of the E3 ubiquitin ligase Parkin, which ubiquitylates PKM2 and decreases its activity and thereby the glycolytic flux (Ref. Reference Liu90). In line with p53 negatively regulating glycolysis, p53 also promotes oxidative phosphorylation in the mitochondria. Synthesis of cytochrome c oxidase 2 (SCO2) is one of the genes that is induced in a p53-dependent manner and SCO2 protein is one of the cytochrome c oxidase assembly factors and thereby necessary for the proper function of the mitochondrial respiratory chain (Ref. Reference Matoba91). Apoptosis inducing factor (AIF) is another gene upregulated by p53 and the translated mitochondrial flavoprotein AIF is required for proper assembly of mitochondrial respiratory complex I (Ref. Reference Stambolsky92).
This shows that a growing body of evidence supports the role of p53 in regulating cellular metabolism and in particular promotes the reversion of the Warburg effect (Fig. 5). However, p53 is mutated in about 50% of cancers in which it leads to compromised oxidative phosphorylation and support of glycolysis.
Impact of p53 on glucose metabolism. Scheme of the pathways by which p53 promotes oxidative phosphorylation directly or through negative regulation of glycolysis. (I) P53 induces the expression of proteins implicated in the proper function of the mitochondrial respiratory chain: SCO2 and AIF. (II) P53 reduces glucose import through direct repression of GLUT1 and GLUT4 transcription and indirect repression of GLUT3 through inhibition of NF-κB. (III) P53 promotes glycolytic flux through the pentose phosphate pathway by downregulating PKM2 through the promotion of its ubiquitination and reducing PFK1 activity through F-2,6-BP depletion. (IV) P53 reduces the conversion of pyruvate to lactate by minimising lactate efflux through MCT downregulation and promoting the conversion of pyruvate to acetyl-CoA through the decrease of PDK2 activity and consequently increase in PDH activity.

Beyond Warburg: Krebs and glutamine metabolism
Cancer metabolism is a complex and flexible system involving the orchestration of energy metabolism, cell growth and proliferation with nutrients besides glucose, such as glutamine, also playing important roles in tumours. Glutamine is the most abundant amino acid accounting for more than 20% and 40% of the free amino acid pool in the plasma and muscle, respectively (Ref. Reference Bergstrom93).
Hans Krebs, who is probably more well-known for his characterisation of the tricarboxylic acid cycle (or Krebs' cycle), played a major role in elucidating glutamine metabolism (Ref. Reference Krebs94). In 1935, he published his findings on glutamine synthesis as an endothermic reaction that is catalysed by an enzyme, glutaminase, which exists in two distinct forms (Ref. Reference Krebs94). Glutamine is a conditionally essential amino acid, becoming essential under conditions that exceed the body's synthetic capabilities, especially in hyper-catabolic stress states, such as injury, sepsis and inflammation resulting in increased glutamine consumption by the gastrointestinal tract, immune cells, inflammatory tissue and kidney (Ref. Reference Lacey and Wilmore95). Glutamine is not only a precursor for a variety of biomolecules, such as proteins, nucleotides and amino sugars, but also plays a role in the acid–base balance because of being a precursor of urinary ammonia, functions as a nitrogen carrier between tissues, is involved in the regulation of glycogen synthesis in the liver and can work as respiratory fuel (Ref. Reference Krebs, Mora and Palacios96) (reviewed in Ref. Reference DeBerardinis and Cheng97). Several cancer cells have been shown to be addicted to glutamine, making it a prerequisite for culture conditions (Ref. Reference Eagle98) and this glutamine-dependency finding was also extended to the growth of certain tumours in vivo (exemplified in Refs Reference Abu Aboud99, Reference Son100, Reference Lampa101).
Glutamine metabolism in cancer
Glutamine is actively transported across the cell membrane by one of 14 membrane transporters belonging to four distinct gene families of the solute carrier (SLC) group transporters: SLC1, SLC6, SLC7 and SLC38 (Ref. Reference Bhutia and Ganapathy102). Among those, SLC1A5 has been heavily studied and shown to be upregulated in many solid cancer types, exemplified by but not limited to triple-negative breast cancer (Ref. Reference van Geldermalsen103), melanoma (Ref. Reference Wang104), neuroblastoma (Ref. Reference Ren105) or colorectal cancer (Ref. Reference Huang106). Another route of amino acid uptake in general is micropinocytosis. This internalisation process through vesicles has been shown to provide a route to contribute to glutamine-dependence by micropinocytic uptake of proteins in Ras-transformed pancreatic and urinary bladder cancers (Ref. Reference Commisso107).
After entering the cell, glutamine is metabolised to glutamate and an ammonium ion by glutaminase, an enzyme that exists in several tissue-specific isoforms and is encoded in humans by the genes GLS and GLS2 (Ref. Reference Mates, Campos-Sandoval and Marquez108). Through alternative splicing, GLS transcribes for two transcripts, translated into the mitochondrial kidney-type glutaminase (KGA) and glutaminase C (GAC), while GLS2 encodes the two proteins GAB and liver-type glutaminase through a surrogate promoter mechanism (Refs Reference Mates, Campos-Sandoval and Marquez108, Reference Martin-Rufian109). GAC is upregulated in several solid cancers, such as breast (Ref. Reference Cassago110), lung (Ref. Reference van den Heuvel111), colon (Ref. Reference Huang112) and prostate (Ref. Reference Pan113).
Following the conversion from glutamine to glutamate by glutaminases, glutamate is further metabolised to α-KG by either glutamate dehydrogenase (GLUD) or aminotransferases. Although GLUD catalyse the reversible deamination of glutamate by releasing ammonia, aminotransferases, according to their name, transfer the nitrogen onto other biomolecules, such as pyruvate or 3-phosphohydroxypyruvate, as within the second step of de novo serine synthesis (Ref. Reference Moreadith and Lehninger114). In tumours, glutamate is mainly metabolised by aminotransferases, whose expression is upregulated while GLUD expression is low (Ref. Reference Coloff115). Generated α-KG can be further metabolised to the oncometabolite 2-HG, a reaction catalysed by IDH as described earlier.
Similar to the Warburg effect, there are several oncogenes, such as KRAS, Myc and p53, that contribute to reprogramming glutamine metabolism in cancer and a few examples will be given herein. KRAS enhances the diversion of glutamine into the TCA cycle or transamination in order to sustain the synthesis of biomolecules (Ref. Reference Gaglio116). In pancreatic ductal adenocarcinoma (PDAC), oncogenic KRAS has been shown to promote aspartate transaminase (GOT1) expression, while reducing GLUD1 expression, thereby supporting the irreversible deamination of glutamate (Ref. Reference Son100). On similar lines, induced Myc expression in mouse embryonic fibroblasts leads to rewiring of their metabolism and an addiction to glutamine and stimulation of the mitochondrial glutamine catabolism (Ref. Reference Wise117). Further studies on Myc-regulated glutamine metabolism reveal that Myc transcriptionally represses miR-23a and miR-23b, which leads to increased expression of mitochondrial glutaminases in lymphoma and prostate cancer cell lines (Ref. Reference Gao118). Recently Myc has also been reported to support glutamine synthesis through increasing glutamine synthase expression initiated by promoter demethylation, which then leads to an increased usage of glutamine in nucleotide and protein synthesis (Ref. Reference Bott119). P53 has been shown to induce the expression of glutaminase 2 isoforms, which results in shifting glucose metabolism towards oxidative phosphorylation and reduction of tumour cell growth (Ref. Reference Hu120).
Collaboration of glucose and glutamine metabolism in cancer
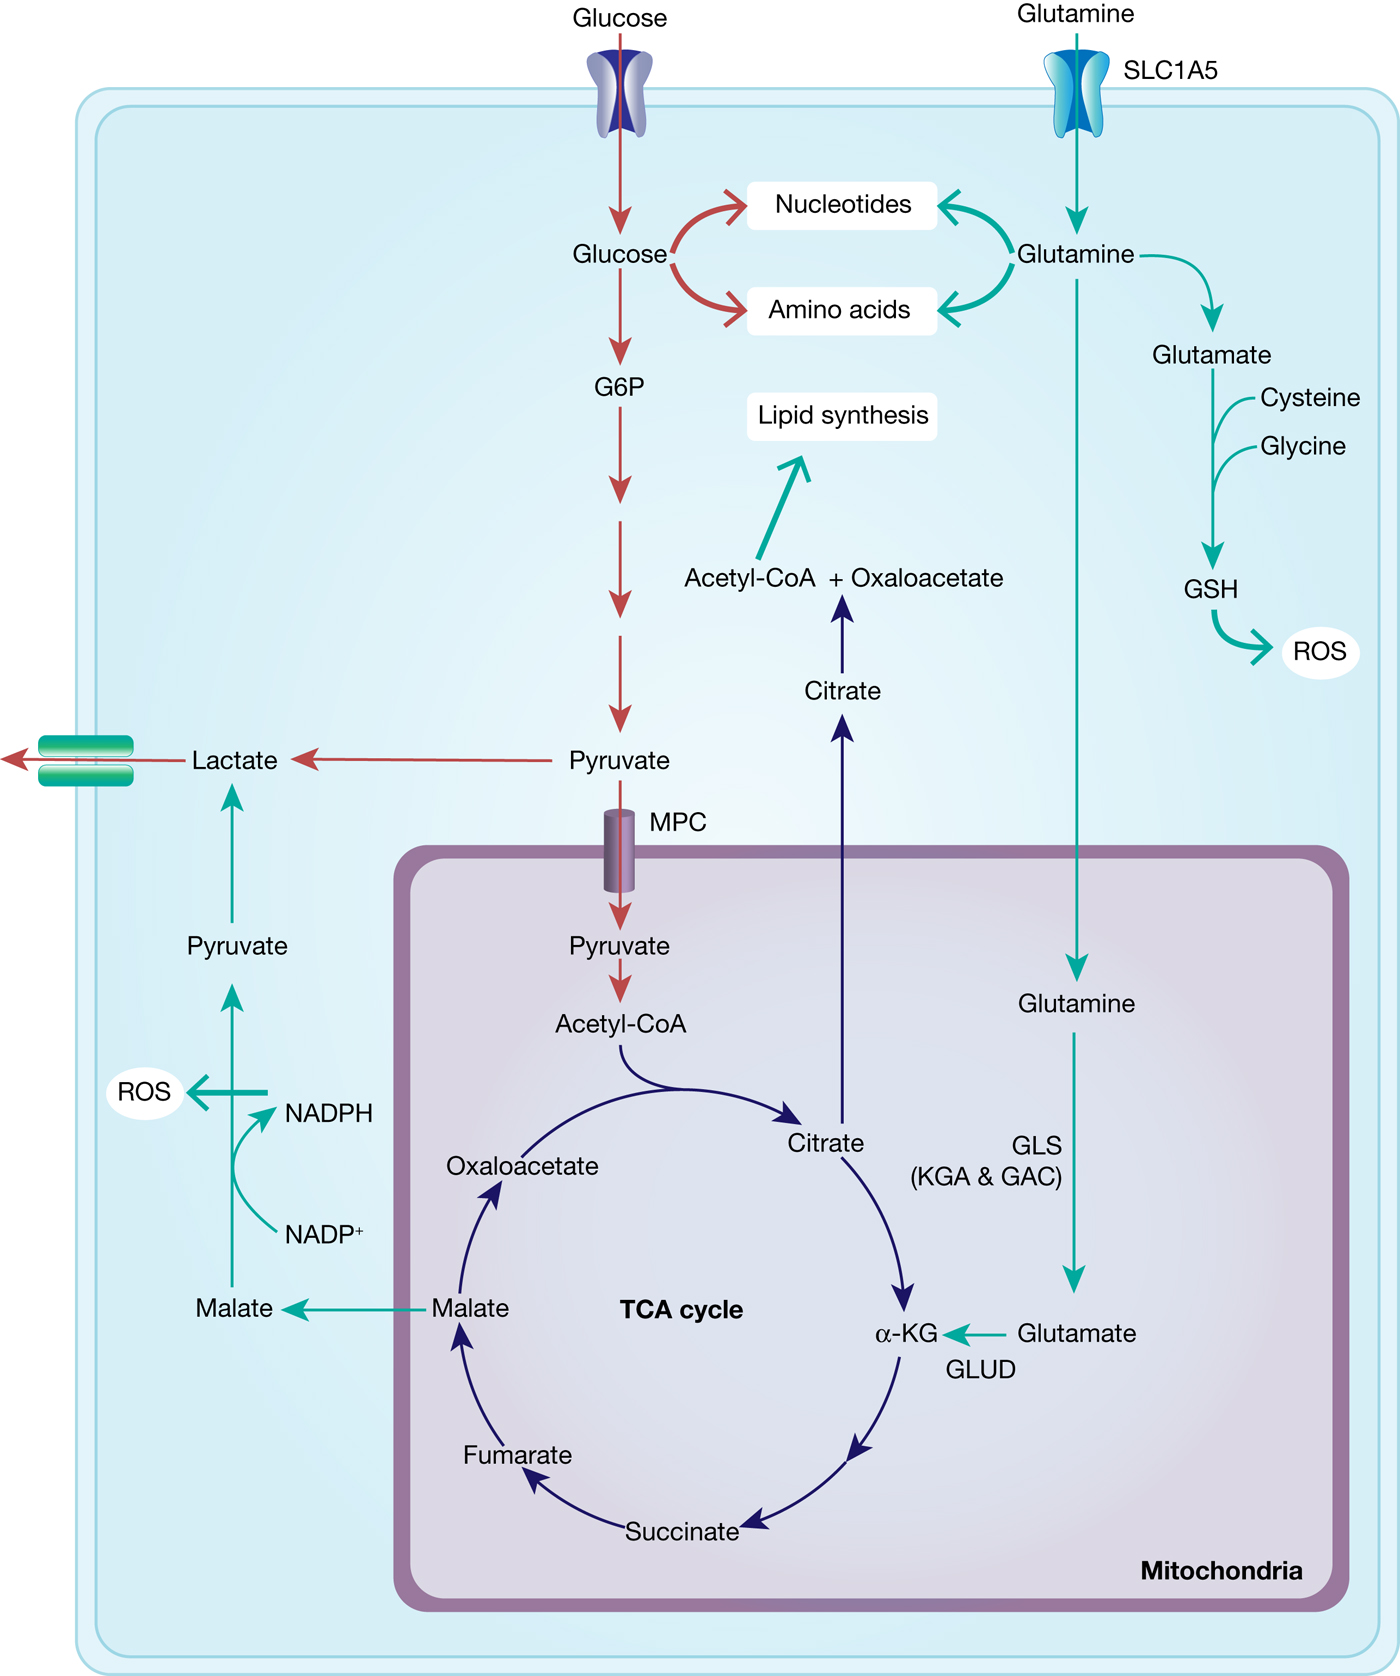
With the shift of cancer cell metabolism towards the Warburg effect, that is, reduced glycolytic flux through the mitochondria and lower ATP production, glutamine is able to step in as an alternative carbon source in order to guarantee sufficient energy production and synthesis of biomolecules (nucleic acids and proteins) necessary for proliferation (Fig. 6).
Interplay between glucose and glutamine metabolism to drive cancer growth. Glucose is transported into the cells and mainly metabolised into pyruvate and lactate and thereby contributes to nucleotide and amino acid synthesis. Glutamine is equally transported into the cells and metabolised to glutamate and α-KG, fuelling into the TCA cycle and thus into ATP generation and lipid synthesis. TCA-cycle-derived malate is further metabolised to pyruvate, thereby generating NADPH and thus contributing to maintaining redox balance. In addition, glutamate fuels into GSH synthesis, which is an important ROS scavenger.
Metabolic studies with 13C-labelled glutamine and glucose in the human GBM cell line SF188 have shown that a large part of glutamine is replenishing the TCA cycle with glutamine-derived α-KG (anaplerosis) (Ref. Reference DeBerardinis121). In line with this, inhibition of pyruvate transport into the mitochondria via the mitochondrial pyruvate carrier in glioma cells activates GLUD, which catalyses the reaction of glutamate to α-KG in the mitochondria, fuelling into the TCA cycle (Ref. Reference Yang122). In addition, glutamine-derived carbon can also support lipid synthesis as the TCA cycle intermediate, citrate, is exported into the cytosol where it is cleaved into acetyl-CoA and oxaloacetate, a necessary precursor for lipid synthesis. While this pathway has been reported to be predominant in cancer cells under hypoxia (Ref. Reference Metallo123), glucose-derived citrate is considered to be the main source for acetyl-CoA under normoxic conditions (Ref. Reference Hatzivassiliou124).
Glutamine has also an important role in the regulation of oxidative stress. Malate, a biomolecule generated within the TCA cycle, can be exported from the mitochondria and converted to pyruvate by malic enzyme, a process that generates NADPH and thus contributes to the cellular redox balance. In human PDAC cells, glutamine-derived aspartate is converted to oxaloacetate, which is subsequently converted into malate then pyruvate and with the last catalytic step generating NADPH (Ref. Reference Son100). Furthermore, glutamate is used in the de novo synthesis of reduced glutathione (GSH), an essential scavenger of reactive oxygen species (ROS) and depletion of glutamine has been shown to reduce the cellular GSH concentration in Myc-driven cells (Ref. Reference Yuneva125). In anchorage-independent growth conditions, IDH1-dpendent reductive carboxylation of glutamine was shown to generate NADPH in the mitochondria and thereby suppress mitochondrial ROS (Ref. Reference Jiang126).
Despite the interplay of glutamine and glucose metabolism, the different pathways are not necessarily co-regulated. Although the PI3K/AKT signalling pathway stimulates glucose uptake and metabolism, glutamine uptake and metabolism is independent of this signalling cascade in Myc-dependent glioma cells (Ref. Reference Wise117).
Therapeutic strategies arising from the Warburg effect and altered glutamine metabolism
The altered metabolic pathways, reflecting the demands of highly proliferating cancer cells and their tumour environment, may be exploited diagnostically and therapeutically. It should be noted that there are more metabolic pathways, besides glucose and glutamine addiction, that are altered in cancer, which represent additional directions for the development of cancer therapeutics by targeting cancer metabolism, but are beyond the scope of this review.
Imaging: diagnosis and monitoring of tumours
The first medical procedure really based on Warburg's findings is 18F-deoxyglucose positron emission tomography (18FDG-PET), which makes use of increased glucose and also 18FDG uptake in most cancers compared with normal tissue and was implemented in the clinic in the 1980s (Ref. Reference Conti127).
With the emerging evidence for the role of glutamine and increased glutamine uptake in tumours, several studies have investigated glutamine-based tracers for PET scans. 5-11C-(2S)-glutamine and 18F-(2S,4R)-4-fluoroglutamine (18FG) have been proposed as complementary tools to guide glutamine-targeted therapies with 18FG showing a different tumour-to-background contrast compared with 18FDG in glioma patients (Ref. Reference Zhu128). 18F-Gln-BF3 is another tracer that has shown significant uptake in xenograft studies (Ref. Reference Li129) (Table 1, Fig. 7).
Labelled glucose and glutamine derivatives used for imaging for cancer diagnosis and progression

FDG, fluorodeoxyglucose; FG, fluoroglutamine; Gln, glutamine; PET, positron emission tomography.
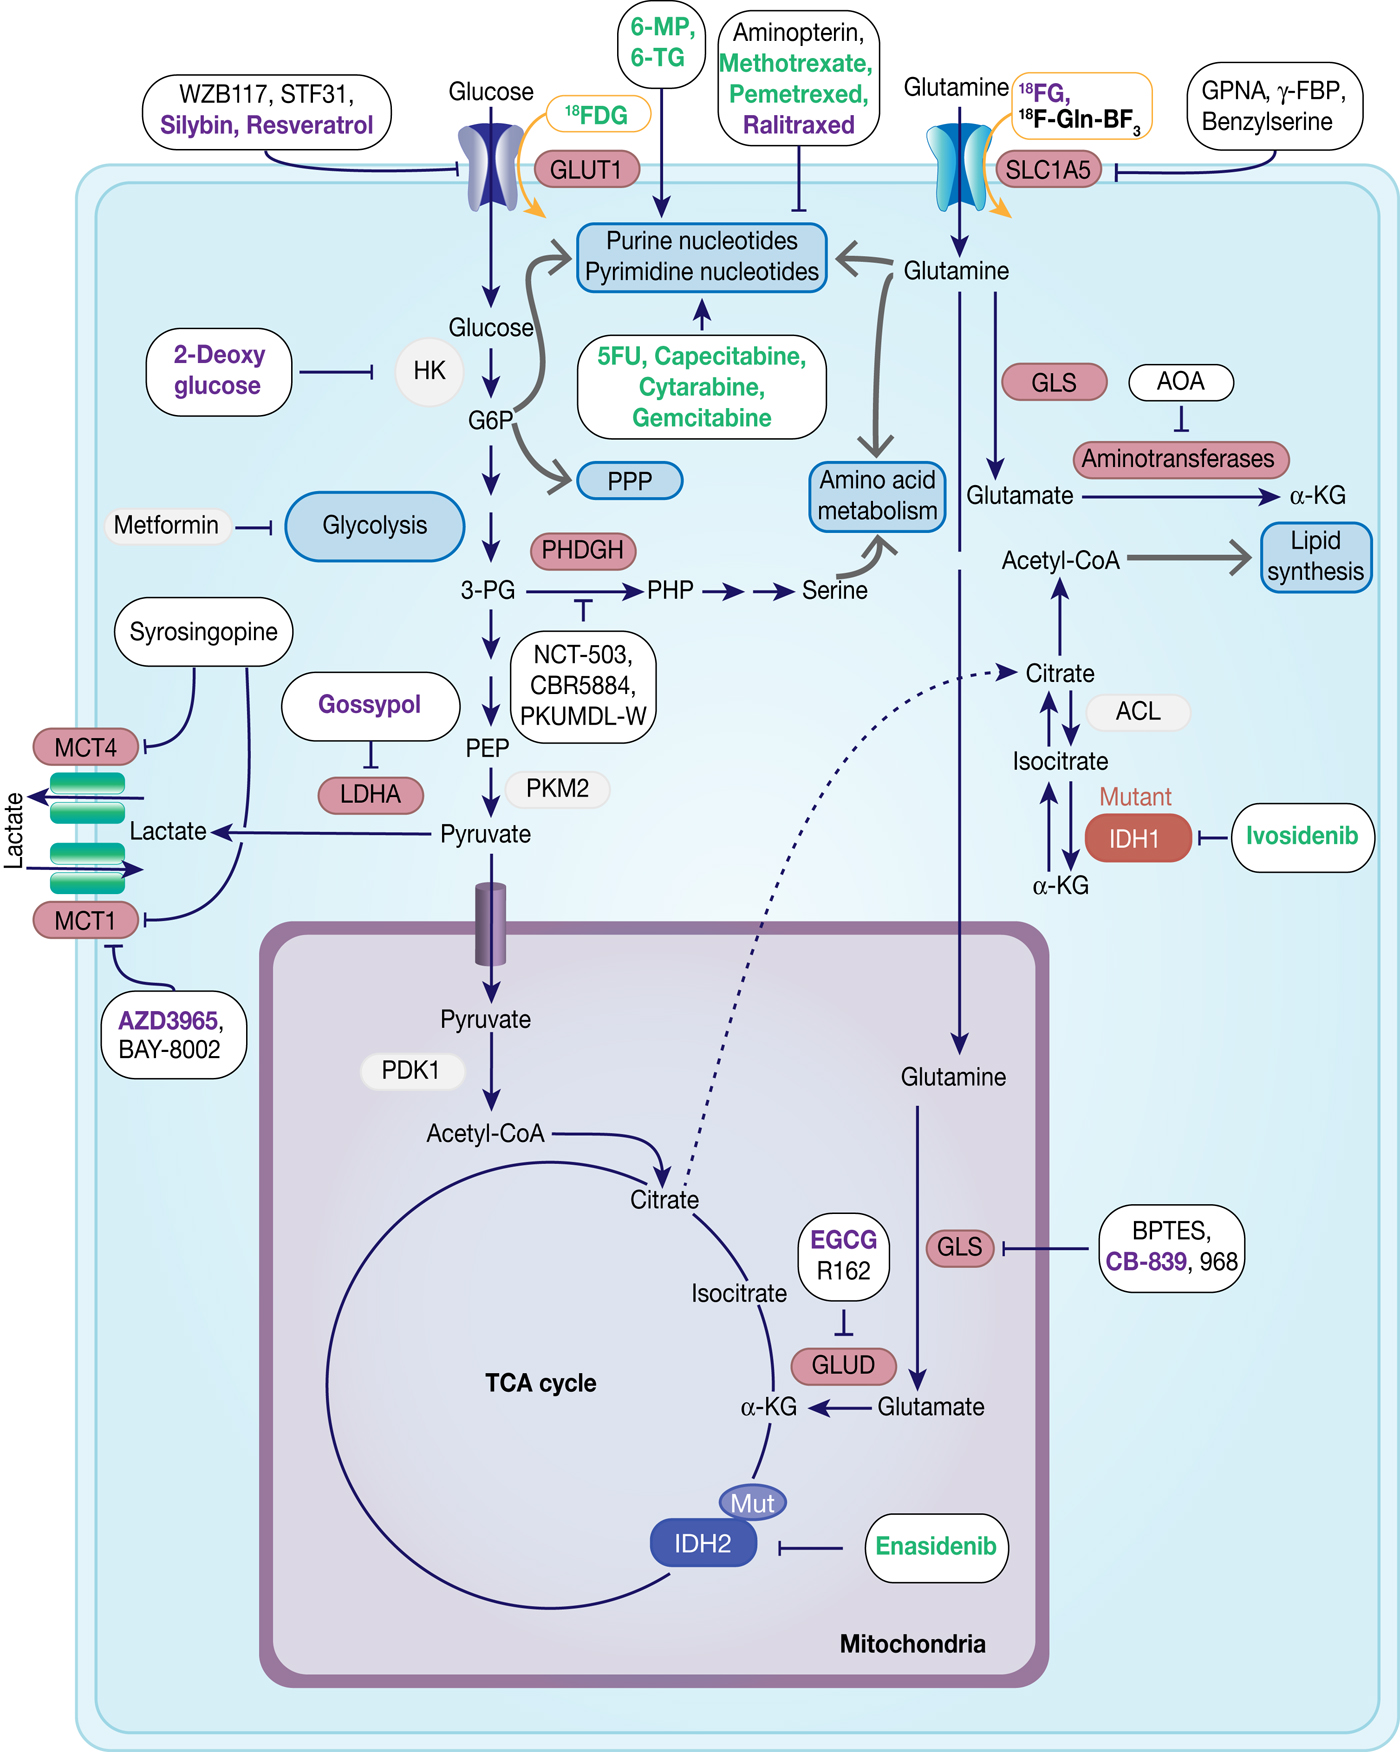
Therapeutic targets in cancer metabolism. Metabolic enzymes which are under preclinical investigation are highlighted in red. Inhibitors are framed in black, whereas compounds used for imaging are framed in orange. Compounds which are under development are in black, compounds in clinical studies are in purple and FDA-approved drugs are in green.
Antimetabolites
Chemotherapeutic agents targeting metabolic enzymes have an even longer history in the treatment of neoplastic disease. In the late 1940s, successful targeting of cancer cell metabolism was already achieved using the antifolate drug aminopterin to induce remission in children with acute lymphoblastic leukaemia (ALL) (Ref. Reference Farber130). More antifolate drugs, such as methotrexate, were developed and were shown to exhibit their antitumour effect through inhibition of dihydrofolate reductase, which subsequently leads to the loss of reduced folates and in turn inhibits thymidylate and purine synthesis causing cytostasis or cell death (Ref. Reference Purcell and Ettinger131). Antifolate drugs have a broad application in the treatment of different solid tumours and haematologic malignancies and there has been a continuous effort in the development of the next generation of antifolates, such as raltitrexed and pemetrexed (Ref. Reference Gonen and Assaraf132).
Analogues of purines (6-mercaptopurine, azathioprine, 6-thioguanine) and pyrimidine (5-fluorouracil, cytarabine, gemcitabine) are also used extensively in cancer therapy, often in combination with DNA repair chemotherapeutics. They exert their antiproliferative activity by blocking nucleotide metabolism and becoming misincorporated into DNA following intracellular conversion to their corresponding nucleotides (Refs Reference Karran and Attard133, Reference Longley, Harkin and Johnston134, Reference Parker135) (Table 2, Fig. 7).
List of approved drugs or preclinical tools among anti-folates and nucleotide analogues

ALL, acute lymphoblastic leukaemia; AML, acute myeloid leukaemia; DHFR, dihydrofolate reductase; GARFT, glycinamide ribonucleotide formyltransferase; NSCLC, non-small cell lung cancer; RNR, ribonucleotide reductase, TS, thymidylate synthase.
Glucose metabolism
Based on an increasing understanding and interest in the Warburg effect and the importance of glucose metabolism in cancer cells, the pharmacological intervention of these pathways has come into more focus (Table 3, Fig. 7). Many cancers show upregulation of different glucose transporters, such as GLUT1, 3 and 4 and this fact is exploited in 18FDG-PET imaging. Several GLUT1 inhibitors from different chemical classes have been developed, such as WZB117, STF31, Silybin and Resveratrol showing promising results in in vitro experiments in different cancer cell lines (Ref. Reference Labak136) with Silybin also having been investigated in phase I clinical studies in prostate cancer (Ref. Reference Flaig137). 2-Deoxyglucose, in contrast, was established as a molecule that is able to enter cells via the glucose transporters but cannot be metabolised beyond 2-deoxyglucose-6-phosphate (2-DG-P) and therefore accumulates (Ref. Reference Woodward and Hudson138). 2-DG-P competitively inhibits phosphoglucose isomerase as well as hexokinase in a non-competitive manner and thereby slows further glucose uptake and metabolism leading to cancer cell death in vitro (Refs Reference Wick139, Reference Crane and Sols140). Although several preclinical studies demonstrated anti-proliferative effects in different cancers, these results could not be translated into clinical settings for 2-DG monotherapy (Ref. Reference Voss141). One major limitation for the usage of 2-DG is its toxicity associated with hypoglycaemia. This toxicity is potentially due to more than one mechanism as 2-DG has been shown to interfere with several biological processes beyond glycolysis, such as induction of oxidative stress, interference with N-linked glycosylation in the endoplasmic reticulum or induction of autophagy (Refs Reference Voss141, Reference Zhang142).
List of preclinical tools and compounds in clinical trials for targets within glucose metabolism
GLUT, glucose transporter 1; LDHA, lactate dehydrogenase; MCT, monocarboxylate transporter.
Another route currently explored to target aerobic glycolysis in caner is through interference with lactate production or excretion. LDHA catalyses the conversion of pyruvate to lactate and as outlined before, LDHA expression is upregulated by HIF-1 and c-Myc. Many cancers were found to have higher levels of LDHA compared with normal tissue (Ref. Reference Goldman, Kaplan and Hall143) and LDHA has been shown to be required for initiation, maintenance and progression of various tumours making it an interesting cancer target (Refs Reference Xie144, Reference Fantin, St-Pierre and Leder145). To date, several inhibitors of LDHA have been reported and mainly validated in biochemical or cell-based models as pharmacokinetic properties or selectivity were not good enough for in vivo studies (Ref. Reference Rani and Kumar146). Among the known LDHA inhibitors is the natural product gossypol, which was investigated in phase I/II clinical studies for different cancers, but is also a reported pan-inhibitor of anti-apoptotic Bcl-2 family protein members (‘https :// www.clinicaltrials.gov’, Refs Reference Rani and Kumar146, Reference Wang147). Following lactate formation, MCT, especially 1 and 4, are responsible for transporting lactate out of the cells, thereby being part of metabolic reprogramming in cancer and thus attractive targets for antitumour therapy (Refs Reference Sonveaux73, Reference Izumi148). Hence, MCT1 inhibition has been shown to lead to the accumulation of intracellular lactate resulting in a decrease in intracellular pH and disabling glycolysis and tumour cell growth (Ref. Reference Doherty72). In a few tumours, lactate import was also observed to be important for tumour growth under glucose-deprived conditions in which lactate fuels into the oxidative phosphorylation pathway (Ref. Reference Sonveaux149). The only promising small-molecule MCT inhibitors to date are BAY-8002 and AZD3965 (Refs Reference Quanz150, Reference Curtis151). Both are MCT1-specific inhibitors with AZD3965 showing potent antitumour activity in a Burkitt's lymphoma xenograft model, whereas treatment with BAY-8002 only resulted in tumour stasis (Refs Reference Quanz150, Reference Curtis151). AZD3965 is currently undergoing phase I clinical trials in patients with advanced solid tumours, B cell lymphoma or Burkitt's lymphoma (Table 3). A challenge in the development of MCT inhibitors for the treatment of cancer is the potential of drug resistance because of overlapping functions within the MCT family, such as functional redundancy of MCT1 and 4. In this context, it has been shown that MCT4 overexpression leads to AZD3965 resistance, whereas MCT4 knockdown resulted in AZD3965 sensitisation (Ref. Reference Polanski152). Recently, syrosingopine has been reported to be a dual inhibitor of MCT1 and MCT4 and to be synthetically lethal in combination with metformin in cancer cells (Refs Reference Benjamin153, Reference Benjamin154). Initially developed and widely used for the treatment of Type II diabetes, metformin has been shown to have multiple targets in glycolysis and is now repurposed and being investigated for the treatment of different cancers, such as in a currently recruiting phase II clinical trial for prostate cancer (NCT03137186) (Ref. Reference Kourelis and Siegel155).
Oncoenzymes: IDH and PHGDH
The ‘oncoenzymes’ presented here: IDH and PHGDH also present interesting targets for cancer therapy that are currently been exploited. Ivosidenib (Tibsovo®) and enasidenib (Idhifa®) are orally available, selective, small-molecule inhibitors of mutated cytosolic IDH1 or IDH2, respectively, which, in line with the presented biology on IDH, prevent the formation of the oncometabolite 2-HG (Refs Reference Popovici-Muller158, Reference Shih159). Evosidenib and ivosidenib have both recently received US Food and Drug Administration (FDA)-approval for treatment of patients with relapsed or refractory AML and are still under further clinical investigation for solid tumours, cholangiocarcinoma and haematological malignancies (Refs Reference Dhillon160, Reference Dugan and Pollyea161). To date several other targeted inhibitors of mutant IDH1 and/or IDH2 are under development and some are currently investigated in clinical phases I-III (Table 4) (Refs Reference Raineri and Mellor162, Reference Buege, DiPippo and DiNardo163).
List of preclinical tools and compounds in clinical trials for IDH and PHGDH

AML, acute myeloid leukaemia; CML, chronic myeloid leukaemia; IDH, isocitrate dehydrogenase; PHGDH, 3-phosphoglycerate dehydrogenase.
With PHGDH's proposed role in tumourigenesis and tumour progression in several solid cancers, the focus has been on the development of small-molecule inhibitors targeting PHGDH. Fragment-based approaches have been reported to target the substrate and cofactor-binding pockets of PHGDH, yielding novel starting points for the development of PHGDH inhibitors (Ref. Reference Unterlass167) as well as a more elaborate inhibitor from AstraZeneca with a reported Kd (SPR) of 0.18 µm (Ref. Reference Fuller168). In addition, two non-competitive inhibitors, CBR-5884 (Ref. Reference Mullarky165) and NCT-503 (Ref. Reference Pacold164) have been proposed with IC50 values of 33 and 2.5 µm, respectively. Of these inhibitors, only NCT-503 was investigated in vivo because of poor plasma stability of CBR-5884. In the in vivo study with NCT-503 in mice bearing MDA-MB-468 (PHGDH-high expressing breast cancer cells) orthotopic xenografts, the tumour burden was reduced by 50% following daily treatment (40 mg/kg, IP) (Refs Reference Pacold164, Reference Mullarky165). In addition, a series of pyrazole-5 carboxamide with IC50 < 50 µM derivatives have been disclosed in a patent (WO2016/040449A1) as well as PHGDH inhibitors, PKUMDL-WQ-2101/2201, that bind to allosteric sites of PHGDH and could significantly inhibit tumour growth in breast cancer xenografts (Ref. Reference Wang166).
Glutamine metabolism
With glutamine being an important nutrient for cancer cells, but at the same time a non-essential amino acid under normal growth conditions, preventing glutamine import into cells provides a valid cancer targeting strategy (Table 5, Fig. 7). Among the transporters for glutamine, SLC1A5 has been predominantly studied in cancer and shown to be frequently upregulated. The glutamine analogue L-γ-glutamyl-p-nitroanilide (GPNA) was among the first SLC1A5 inhibitors to be proposed (Ref. Reference Esslinger, Cybulski and Rhoderick169) and has been shown to reduce glutamine uptake in several cancer types, such as NSCLC (Ref. Reference Hassanein170), myeloma cells (Ref. Reference Bolzoni171) or prostate cancer (Ref. Reference Wang172). However, recent studies suggest that GPNA is a non-selective SLC1A5 inhibitor that also affects other sodium-dependent carriers of the SNAT family (Ref. Reference Broer, Rahimi and Broer173) as well as the sodium-independent neutral amino acid transporter LAT1 (Ref. Reference Chiu174).
List of preclinical tools and compounds in clinical trials for targets within glutaminolysis

AOA, aminooxyacetate; BPTES, bi-2-(5-phenylacetamido-12,4-thiadiazol-2-yl)ethyl sulphide; EGCG, pigallocatechin gallate; γ-FBP, γ-folate-binding protein; GPNA, L-γ-glutamyl-p-nitroanilide.
Other reported SLC1A5 inhibitors are benzylserine and benzylcysteine, which have been shown to are weak (mM-affinity for SLC1A5), competitive inhibitors of SLC1A5 (Ref. Reference Grewer and Grabsch175), but are also non-selective and in the case of benzylserine also affect other amino acid transporters, such as LAT1 (Ref. Reference Wang104). Despite weak inhibitory affinity, benzylserine has been shown to decrease breast cancer cell viability and cell progression (Ref. Reference van Geldermalsen176).
The proline derivative γ-folate-binding protein is a newly described SLC1A5 inhibitor, obtained from a virtual screening campaign and shown to decrease melanoma cancer cell viability using compound doses in the low-mM range (Ref. Reference Colas177).
Glutaminase 1 (GLS1) isoforms, especially GAC, have been found to be upregulated in different cancers and suppression by genetic knockdown showed antitumour activity, thus validating glutaminases as promising targets for cancer therapy. In this context, bi-2-(5-phenylacetamido-12,4-thiadiazol-2-yl)ethyl sulphide (BPTES) has been reported and identified as an allosteric KGA and GAC inhibitor that blocks the respective tetramer in an inactive conformation, but does not affect the GLS2 isoforms (Refs Reference Newcomb178, Reference DeLaBarre179, Reference Robinson180). Although several studies report antitumour activity of BPTES in different tumour types, its usage in clinical studies is limited by moderate potency, metabolic instability and low solubility (Ref. Reference Gross181). In order to improve these properties, BPTES derivatives were investigated and led to CB-839, a potent, selective and orally bioavailable inhibitor of the two main splice variants of GLS1: KGA and GAC, that is currently investigated in phase I and II clinical trials (Table 5) (Refs Reference Gross181, Reference Liang, Bromley and Orford182). In search of glutaminase inhibitors with a different modus operandi, compound 968 was reported to bind to the inactive, monomeric GAC and preventing it from undergoing conformational changes to an activated state (Refs Reference Wang183, Reference Stalnecker184).
The metabolism of glutamate to α-KG is performed by GLUD or aminotransferases and as α-KG is not only a precursor for the oncometabolite 2-HG, but also fuels into the TCA cycle, its production is another attractive target for cancer therapy.
The green tea polyphenol, epigallocatechin gallate (EGCG) was reported to inhibit GLUD in the nM-range and to inhibit the growth of N-Myc amplified neuroblastoma cells and c-Myc overexpressing glioma cells (Refs Reference Li185, Reference Qing186, Reference Yang187). However, as EGCG inhibits a variety of NADPH-requiring enzymes, a screening for more selective GLUD inhibitors revealed the purpurin analogue R162 (Ref. Reference Jin188). R162 was subsequently shown to significantly reduce cell viability in human lung, breast and leukaemia cell lines (Ref. Reference Jin188). Aminooxyacetate (AOA) is a non-specific transaminase inhibitor that initially has been investigated as palliative treatment in tinnitus (Refs Reference Reed189, Reference Guth190) and had failed in a small trial with seven patients in Huntington's disease (Ref. Reference Perry191). In preclinical studies for cancer therapy, AOA has been used to inhibit the anaplerotic use of glutamine in the TCA cycle and has shown to decrease tumour growth in breast cancer xenograft studies (Refs Reference Thornburg192, Reference Korangath193).
Concluding remarks and future directions
The discovery of aerobic glycolysis by Warburg was certainly a milestone discovery in the area of cancer metabolism, but also just one aspect of a complex metabolic network. There is an increasing body of literature and evidence showing that cancer is a metabolic disease and that metabolic dependencies in cancer offer an exciting new area of research with great potential for the development of novel therapeutics, such as the renewed focus on glutamine metabolism shows. As a tumour represents a heterogeneous mixture of cells and accumulates further mutations during division and expansion, it will be difficult to erase a tumour completely by targeting individual mutated gene products. In this regard, targeting metabolic dependencies of cancers, such as the Warburg effect or glutamine dependence, could provide promising new avenues for developing new cancer treatments.
However, the metabolic network is also very intricate and complex so that a clear understanding of the metabolic alterations in tumours within their context is necessary. As metabolic pathways are evolutionarily conserved, it is important to consider potential toxicities when developing metabolic inhibitors. Nevertheless, for other diseases, metabolic inhibitors, such as metformin for Type II diabetes, have successfully been developed with sufficient safety profiles, indicating that targeting cancer metabolism with limited toxicities should be achievable.
Next to the development of novel inhibitors, it is necessary to establish non-invasive methods for patient stratification as not all tumours rely on the same metabolic pathways. Progression biomarkers and early detection of resistance mechanism will be a key factor as cancer metabolism has been shown to be an adaptive and dynamic system influenced by the tumour micro-environment.
One has to remember that several anticancer chemotherapeutic agents used to date are drugs targeting tumour metabolism, such as the antifolates or nucleotide analogues. Together with a strong research effort that has led to several clinical trials for inhibitors targeting metabolic pathways to date, there is substantial potential in pursuing these new avenues for effective new cancer treatments.


