
1.1 Introduction
This brief reminder chapter aims to freshen up what professionals in reproduction may have learned a while ago at university, and will also serve the reader as a source of information to comprehend the following, more complex chapters. At the end of this chapter, basic study books or broad reviews are recommended for further reading rather than regular scientific references, to help the reader in the further understanding of this textbook.
Human reproduction and genetics are intimately intertwined and indeed often confused and rolled into one. Understanding reproduction is impossible without a firm basis in genetics, and the readiness to acquire more knowledge when needed. However, human genetics is much broader than just reproduction – think of, for instance, oncogenetics – so in this chapter I will summarize those aspects of basic genetics that are indispensable for specialists in reproduction.
In this chapter, I introduce the general organization of our genome, how this genome behaves when it goes through a reproductive cycle (meiosis), how our genome is used as a template for making proteins and how this is broadly regulated, describe major genetic and hereditary abnormalities at both the chromosome and the monogenic level, and conclude with a brief overview of current genetic diagnostic techniques.
1.2 The Organization of the Human Genome
1.2.1 The Basic Building Material: DNA
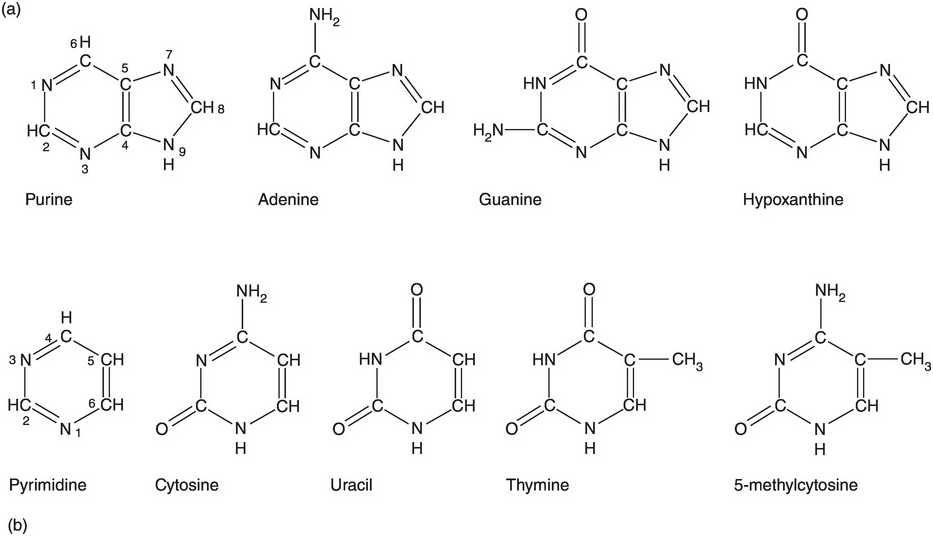
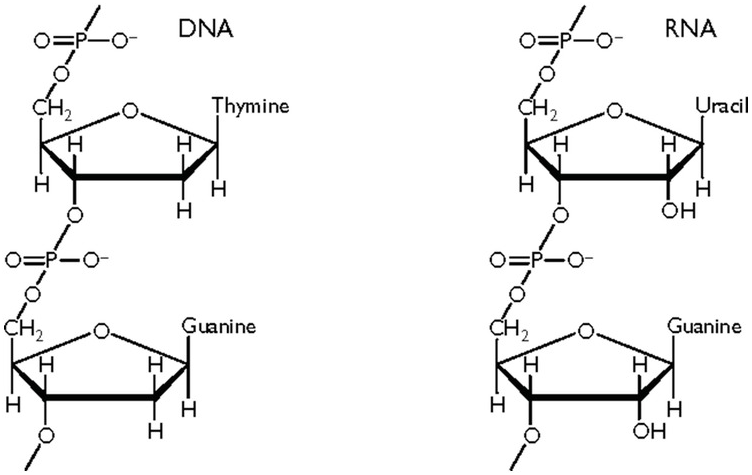
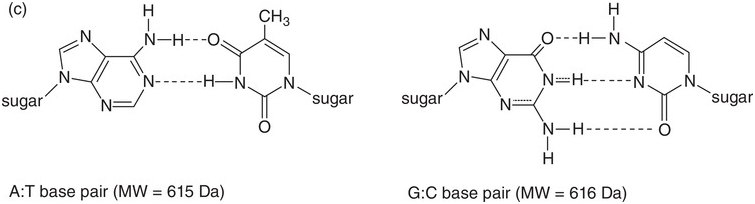
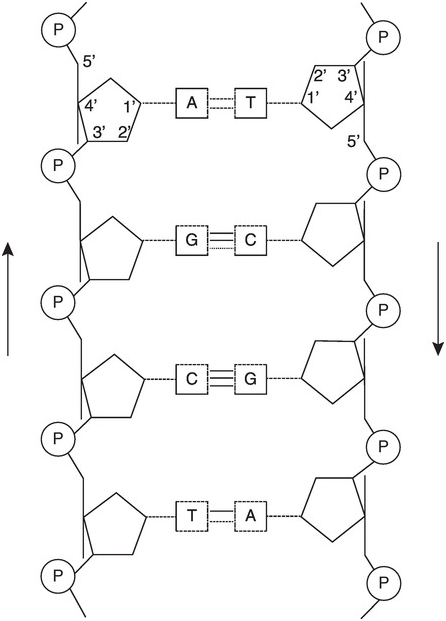
Deoxyribonucleic acid (DNA) consists of four different nucleotides [Reference Strachan, Goodship and Chinnery1,Reference Nussbaum, McInnes, Willard and Hamosh2]. Each nucleotide consists of a sugar, which is deoxyribose in DNA, a phosphate group and a base. Four different bases are present in the nucleotides of DNA: adenine (A), cytosine (C), guanine (G), and thymine (T) (Figure 1.1a) [Reference Ringo3]. These four nucleotides are strung together in long strands of DNA, alternating a sugar (with a base attached) and a phosphate group, and where the order of the different bases defines the genetic code (Figure 1.1b). The phosphate group can be bound either to the 5′ carbon of the sugar or to the 3′ carbon of the sugar, while the base is bound to the 1′ carbon. When strung together, the first sugar in the DNA strand has a free 5′ carbon, while its 3′ carbon is covalently bound to a phosphate group. This phosphate group is bound to the 5′ carbon of the next sugar further down the strand. This is why in a DNA strand, the 5′ carbon of the first sugar is free and, at the end of the strand, the 3′ carbon of the last sugar is free. This is why DNA base pairs are always read from 5′ to 3′.
Moreover, cellular DNA is usually found in a double helix form. The bases A and T on the one hand and C and G on the other can form hydrogen bonds, thus stabilizing the double helix (Figure 1.1c). According to the Ensembl database [4], our nuclear DNA contains 4 537 931 177 base pairs (bp). An estimated half of the human genome consists of transposons, also known as mobile DNA elements or “jumping genes,” and are extensively discussed in Chapter 6.
(a) The four bases in DNA and RNA. (b) Sugar–phosphate backbone of nucleotides. DNA has 2′-deoxyribose as sugar, RNA has ribose as sugar. (c) A and T form two hydrogen bonds while G and C form three hydrogen bonds. Together with the sugar–phosphate backbone this forms the double helix of DNA.
1.2.2 DNA Is Organized in Chromosomes
The DNA of our whole genome is not ordered in one long strand, nor does it lie naked and unprotected in the nuclei of our cells. Human nuclear DNA is organized in 46 separate strands, so each chromosome contains one long DNA strand. Twenty-two of these chromosomes are paired, one inherited from the mother and one from the father. These are called the autosomes. The two remaining chromosomes are the sex chromosomes: females have two X chromosomes, while males have one X and one smaller Y chromosome.
When the cell is not dividing, the DNA is organized in chromatin. The double helix is wound around protein structures called histone octamers, which in their turn are further coiled into structures called solenoids. These solenoids are attached to a protein scaffold within the nucleus to form loops (Figure 1.2). Important features of the chromosome are the centromere and the telomeres. Each chromosome has one centromere that holds the sister chromatids together until anaphase. They are most prominent at metaphase, where they can for instance be readily recognized after G-banding. The telomeres consist of highly conserved repeats (TTAGGG) and have an important function in stabilizing the chromosome; a chromosome that has lost a telomere due to breakage is unstable. The way the chromatin is organized in a specific cell, and the way some histones are chemically modified, define which genes can or cannot be transcribed and expressed. For instance, some genes will be so tightly packed in the chromatin that the transcription machinery cannot reach them and thus these genes are silenced in this particular cell. The chromatin structure is thus an important determinant of the cell’s expression pattern and therefore its function.
DNA is organized in chromatin.

A particular type of DNA is found in mitochondria. Mitochondria are cell organelles that are essential for the respiration and energy production of the cell. They carry their own circular DNA of about 16 000 bp which replicates independently of the DNA in the nucleus. The genes on the mitochondrial DNA (mtDNA) encode for their own ribosomal RNA (rRNA), transfer RNA (tRNA), and ribosomal proteins, as well as a handful of aerobic metabolism enzymes. However, many mitochondrial proteins are encoded by the nuclear DNA and are later imported into the mitochondrion to contribute to mitochondrial function. How mtDNA impacts reproduction is discussed in Chapter 12.
1.2.3 The Functional Genetic Entity: The Gene
A gene can be defined as “a sequence of DNA in the genome that is required for the production of a functional product which can be a polypeptide or a functional RNA molecule” [Reference Nussbaum, McInnes, Willard and Hamosh2]. The number of coding genes in our genome is estimated to be around 20 000 [4]. These are not equally scattered along the chromosomes: some parts of chromosomes are very gene-rich while other stretches of more than a million base pairs contain no genes at all and are called gene deserts. Some genes are quite small and comprise only a few kilobase pairs, while others span a million or more base pairs. One such large gene is the dystrophin gene, which spans more than 2 million base pairs. The two gene copies on the autosomes are usually both transcribed (or both silenced), except for a number of developmentally important genes where only one copy is transcribed. In these so-called imprinted genes, either the paternal or the maternal copy is exclusively expressed. Some of these genes have been implicated in the congenital defects that occur more frequently after assisted reproductive technology (ART); this topic is discussed in Chapter 14.
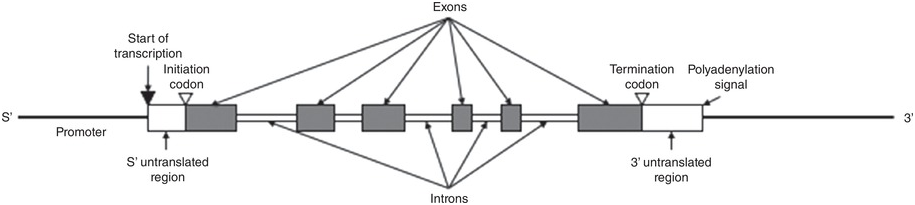
Genes that typically code for a polypeptide have recurring structural features (Figure 1.3). Not all base pairs in a gene will be translated into a protein: genes typically contain exons that are the translated parts interspersed with introns that are not translated. In many genes, the introns represent a significantly larger proportion of the gene than the exons. Other recurring structural features include sequences conserved among many different genes that provide the transcription machinery of the cell with appropriate signals of when and where to transcribe specific genes. Every gene has a start and a stop signal, as well as a promoter sequence in the 5′ end. This promoter specifies the pattern as well as the level of expression of a gene. At the end of the 3′ untranslated region is a signal for the polyadenylation of the transcribed messenger RNA (mRNA), which will carry a polyA tail that confers stability to the molecule. Other regulatory elements include enhancers and silencers, and can be found in either the 5′ or 3′ untranslated region, or in intronic sequences of the gene. Some can even lie far away from the coding sequence of a gene: for instance, enhancers can bind gene regulatory proteins, which then interact with proteins on promoters to upregulate gene expression. The DNA between the enhancer and the promoter is typically looped out. Silencers work in a similar way to enhancers, but instead inhibit transcription of a particular gene. Alleles are alternative forms of the same gene: changes in the DNA sequence will lead to a different protein with different function. A well-known example of multiple alleles is the ABO blood group system.
The typical anatomy of a human gene. The promoter contains the signal for transcription, and the transcription is started downstream. The initiation codon gives the signal for the start of translation. Only exons are translated; the 5′ and 3′ untranslated regions and the introns are transcribed into mRNA but not translated. The termination codon gives the signal to end the transcription, and the polyadenylation signal causes a polyA tail to be attached to the mRNA for stabilization.
1.3 Making More Copies: The Cell Cycle
1.3.1 The Different Parts of the Cell Cycle
In order to get from the fertilized zygote to the estimated 100 trillion cells in the human body, cells need to undergo continuous divisions. Cell division and mitosis are also crucial for differentiation.
When a cell is not in mitosis, it is said to be in interphase (Figure 1.4a). The first part of interphase, immediately after mitosis, is called the G1 phase; in this phase, the chromosomes each contain only one copy of the DNA strand. This G1 phase typically lasts for several hours in rapidly dividing cells until the S-phase is reached, although some terminally differentiated cells (neurons or white blood cells) may withdraw from the cell cycle altogether and are said to be in G0, while other cells such as blastomeres have a truncated G1 phase, allowing them to divide every 13–17 h.
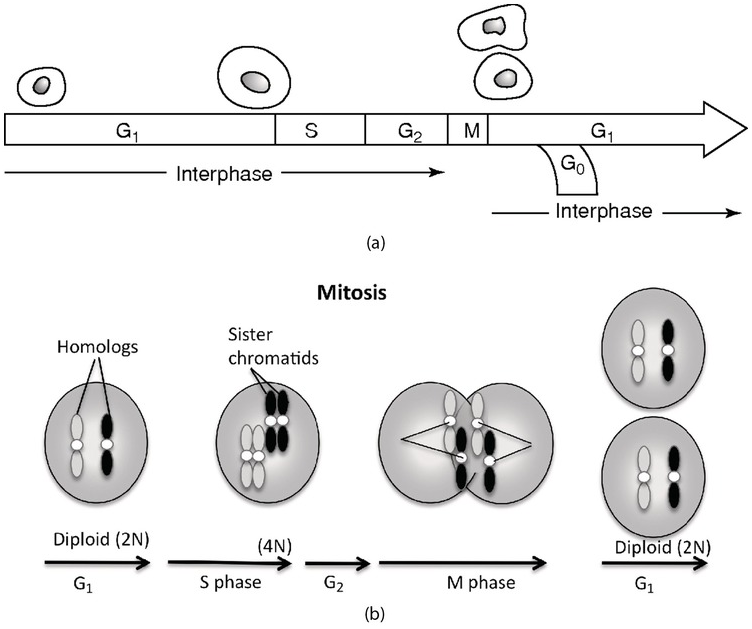
When the cell starts to replicate its DNA, it is said to enter the S-phase. The two DNA strands are separated, and a complementary strand is made of each strand. The chromosomes at the end of the S-phase consist of two sister chromatids, each containing an identical DNA strand. The chromatids are held together at the centromere that associated with specialized proteins forms the kinetochore, by which the chromatids will be attached to the mitotic spindle. Before the cell enters mitosis, it goes through a brief control G2 phase in which the cell visibly grows after the accumulation of synthesized proteins during the whole cell cycle. The whole interphase of a typical cell lasts between 16 and 24 h but may extend to months, whereas mitosis is completed in a couple of hours.
1.3.2 Passing on the Information: Mitosis
At the end of G2, every chromosome consists of two chromatids and one of each of these chromatids needs to end up in one of the daughter cells in orderly chromosome segregation. The first step in mitosis is prophase, in which chromosomes start to condense and a mitotic spindle starts to form (Figure 1.4b). The formation of the mitotic spindle is organized through two centrosomes from which microtubules will radiate to form the spindle. During prometaphase, the nuclear membrane breaks up and the chromosomes are attached to the mitotic spindle by their kinetochore. Led by the microtubules of the spindle, the chromosomes move to the metaphase plate in a process called congression. During metaphase, the chromosomes have reached their maximal condensation at the equatorial plane and are easiest to visualize. Anaphase starts when the chromosomes separate into two chromatids and each chromosome moves to the different poles. Mitosis concludes with telophase, during which the chromosomes decondense and the nuclear membrane is built up again. Concomitantly to telophase, the cytoplasm is divided between the two daughter cells and cytokinesis is completed.
1.4 Making More Humans: Meiosis
During the process of mitosis, two daughter cells are produced that carry exactly the same genetic information both in content and volume. Mitosis could thus not be used to form gametes, since with every generation the amount of DNA would double. Meiosis is a specialized form of cell division that solves this problem by resulting in cells (gametes) with only half of the DNA content (i.e. one of each chromosome) of the somatic cells (Figure 1.4c). An added bonus is that during meiosis, the DNA from the two parental chromosomes is exchanged to form new chromosomes built with genetic material from the two parents. This process of recombination is important for generating genetic diversity in a species and thus for securing its evolution. Meiosis is the most important step for the survival and evolution of sexually reproducing species.
The different steps in male and female meiosis are discussed in depth in Chapter 3.
1.5 From DNA to Protein: The Transcription and Translation Machinery
1.5.1 RNA Comes in Many Forms and Functions
If DNA is important as the keeper of genetic information, the role of RNA is at least as important – some say more important – because of the versatility in form and function of RNA. RNA differs from DNA in three aspects: (1) the sugar moiety is different, ribose instead of deoxyribose; (2) the thymine base is replaced by a uracil base; and (3) RNA can be found in many different three-dimensional structures, usually as a single strand.
RNA is transcribed from the DNA template by RNA polymerases that first unwind the DNA and then synthesize an RNA strand that forms a temporary double helix with the DNA. The RNA is synthesized on the 3′–5′ DNA strand in the 5′ to 3′ direction. This 3′–5′ template DNA strand is often called the antisense strand because it is in the opposite sense from the RNA, while the 5′–3′ DNA strand which does not serve as a template has the same nucleotide sequence as the synthesized RNA strand (except that thymine is replaced by uracil) and is often called the sense strand.
Different examples of RNA forms, and functions, include mRNA that is transcribed from polypeptide-encoding genes, rRNA that will make up the ribosomes, and tRNA that will ultimately translate the information in the mRNA sequence to an amino acid sequence. When RNA is transcribed from the DNA strand, it will need to undergo a great deal of processing before it can fulfill its function. Introns will have to be spliced out of the mRNA so that only the exons are translated into protein, and a polyA tail will be added to the mRNA to ensure its stability. The rRNA and tRNA also undergo extensive changes before they are functional.
A more recently discovered type of RNA is transcribed from noncoding RNA genes. These RNAs have an important function in the regulation of other genes. Well-known examples of this are the microRNAs that can regulate the amount of mRNA available for translation. Other examples are other small noncoding RNAs such as piwi-protein interacting RNA (piRNA) and short interfering RNA (siRNA) as well as long noncoding RNAs. After the chromatin structure, this is the second example of how gene expression is regulated and explains the increasing importance that scientists are giving to RNA.
1.5.2 Different RNAs Work Together to Translate DNA into Protein
1.5.2.1 Genetic Code
In the DNA sequence of a polypeptide gene, a set of three base pairs constitutes a codon. One codon codes for one amino acid. Looking at all the possible codons using combinations of three of the four base pairs, we get 43 or 64 possibilities. These 64 codons are the genetic code. Because there are only 20 amino acids, one amino acid can be represented by more than one codon. There is only one codon for the amino acid methionine, and this codon also represents the start of the polypeptide. Finally, three codons represent a stop and instruct the translation machinery that the end of the polypeptide has been reached.
1.5.2.2 Translation Machinery
Once the mRNA, rRNA, and tRNA have been transformed into their mature and functional forms, they are transported to the cytoplasm of the cell where the translation into proteins takes place. The large ribosomes, built of several rRNA molecules, will start to read the mRNA at the start codon, which is always AUG coding for methionine (Figure 1.5a). Within the ribosome, a tRNA that carries an anticodon that is complementary to the methionine codon on the mRNA will then bind to the methionine codon. The other end of the tRNA carries a methionine amino acid. The ribosome then moves one codon along the mRNA to the next codon. In Figure 1.5b, this codon is GGG coding for glycine. A tRNA that has CCC as anticodon binds to the mRNA codon and carries a glycine amino acid. This glycine amino acid is then bound to the first methionine amino acid, and the two first amino acids of the polypeptide are formed (Figure 1.5c). The whole mRNA is read in this fashion until the ribosome reaches one of the three stop codons. The synthesis of the polypeptide is then terminated, and the polypeptide is released from the ribosome to be further processed into a functional protein by other cytoplasmic organelles such as the endoplasmic reticulum before reaching its cellular destination.

1.6 Behold the Genome: Tools in Human Genetics
We discuss here only a handful of tools as they appear in the following chapters. This should help the reader to understand the contents, but is by no means comprehensive. We refer the interested reader to the study books listed in the References for additional information.
1.6.1 The Big View: Cytogenetics
1.6.1.1 Know Your Classics: G-Banding and Karyotypes
Cytogenetics is the study of chromosomes, their structure, and their inheritance. At the end of the 1950s, the exact number of chromosomes was known, and at the first Chromosome Conference in Denver, the chromosomes were classified according to their size: the largest chromosome is chromosome 1 and the smallest is chromosome 22; in addition, chromosome X and chromosome Y were also included. Later, banding techniques became available and the current classification was established in Paris in 1971 (Figure 1.6). The complete picture, with every chromosome of an individual arranged from the largest to the smallest, is called a karyotype.
Normal human male karyotype (46,XY).
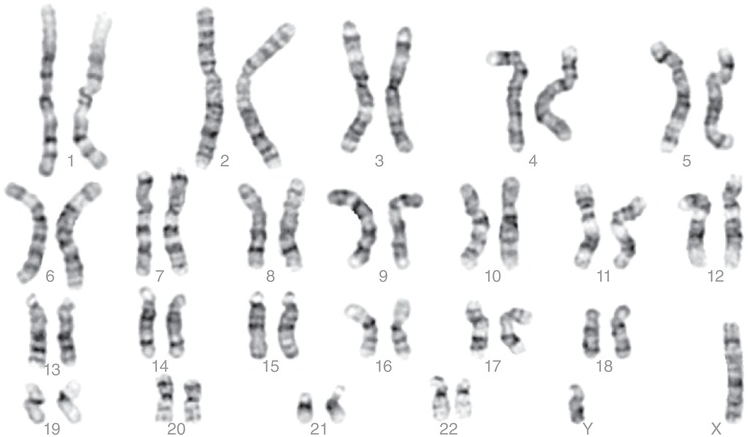
Most commonly, chromosomes are visualized using lymphocytes obtained from peripheral blood. These are placed in culture and forced to divide and then arrested when they go into metaphase. Once in metaphase, the microtubules in the spindle are stopped, and the cells lysed and spread on a glass slide. The spread metaphases can be dyed with Giemsa stain, which produces the classical G-banding found on most karyotype protocols. According to the position of the centromere, three types of chromosomes can be distinguished: metacentric chromosomes, with a centromere approximately in the middle; submetacentric chromosomes, with two arms of clearly unequal length; and acrocentric chromosomes with centromeres at or near an end. Each chromosome has a long arm called the q-arm and a short arm called the p-arm. The banding patterns visible after G-banding characterize each individual chromosome, and allow cytogeneticists to classify and number the chromosomes, and to identify possible rearrangements [Reference Shaffer, McGowan-Jordan and Schmid5].
1.6.1.2 Fluorescent In Situ Hybridization: Count the Dots
Although fluorescent in situ hybridization (FISH) was the first step from classic cytogenetics to molecular cytogenetics, the method gives only limited information compared with currently developed molecular cytogenetics methods. Fluorescent in situ hybridization is a relatively easy and quick method that has allowed fast screening of, for example, prenatal samples for the most common aneuploidies such as trisomy 13, 18, and 21. The sampled cells are spread on a glass slide, fixed, and the DNA is denatured so that the single-stranded DNA is accessible for fluorescently labeled DNA probes. These probes are chosen so that they are complementary to the DNA region of interest, are allowed to form double-stranded DNA with the DNA in the sample (“to hybridize”), after which the location in the nucleus where the probe has bound can be seen as a fluorescent spot. The FISH probes are carefully chosen to serve a particular purpose. For a quick chromosome count, such as for aneuploidy detection in prenatal samples, centromere probes are usually chosen, because they give large, easy-to-read signals. Moreover, they allow a count of the chromosomes in metaphase as well as interphase nuclei. For the detection of more specific chromosome regions, such as in translocations involving small fragments or microdeletion syndromes such as DiGeorge syndrome, more care has to be taken in the design of the FISH probes. If the probes are mixtures covering a whole chromosome, they are called chromosome paints and are very useful for visualizing a chromosomal translocation.
More on FISH and its application in preimplantation genetic testing can be found in Chapters 4 and 13.
1.6.2 The Detailed View: DNA and RNA Analysis
1.6.2.1 Polymerase Chain Reaction
Before the advent of the polymerase chain reaction (PCR), the only way to amplify a DNA fragment of interest was to clone it into a vector (say a plasmid), introduce the vector in a host (e.g. Escherichia coli bacteria), culture the bacteria, and then isolate the expanded plasmid with the DNA of interest. This was very time-consuming, necessitating a large amount of DNA and special equipment for bacterial culture. PCR very quickly took its place in many applications in molecular biology: PCR products are used as templates for restriction enzymes or sequencing reactions, and probes used in other applications (FISH, hybridizations of all kinds) are synthesized using PCR; even making transgenic animals has become much simpler thanks to PCR.
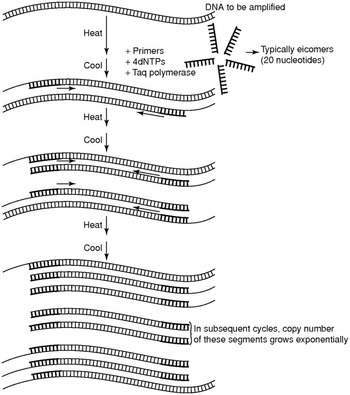
PCR is in essence a DNA copier machine [Reference Strachan, Goodship and Chinnery1,Reference Nussbaum, McInnes, Willard and Hamosh2]. In a first step, the native DNA strands are denatured (i.e. separated) by heating, typically to 95°C (Figure 1.7). In the second step, at a lower temperature, two single-strand short DNA fragments bind to the complementary DNA(cDNA). These short DNA fragments are called the primers and are chosen so that they delineate a fragment of the genomic DNA that has to be amplified, for instance because a disease-causing variant resides in that fragment. The primers then serve as an anchor for the polymerase, which synthesizes the cDNA strand resulting in double-stranded DNA at a higher temperature, typically 72°C, during the third part of the reaction.
Polymerase chain reaction scheme.

Ordinary DNA polymerases are not heat resistant and will thus be destroyed at each PCR cycle. Therefore, the discovery of thermophilic DNA polymerases was a major breakthrough in PCR technology. Taq DNA polymerase was the first and most widely used thermophilic DNA polymerase and was first described in Thermus aquaticus, a thermophilic bacterium isolated from the hot springs of Yellowstone National Park in the USA.
Like any ordinary chemical reaction, PCR reactions have typical kinetics. First, during the exponential phase, the number of PCR fragments generated increases in an exponential fashion. At a certain point, the reaction components are depleted and PCR reaches a plateau phase so that the number of PCR molecules does not increase further. When PCR fragments are analyzed on agarose gels, or other means of fragment analysis, the reaction usually has reached this plateau phase.
1.6.2.2 Sequencing
The most widely used chemistry tool still in use for DNA sequencing is called Sanger sequencing. The chemical principle has remained the same, whether using radioactively labeled nucleotides for detection, or the currently ubiquitous fluorescent sequencing. The starting material nowadays is usually a PCR product, but before the advent of PCR, DNA fragments cloned into vectors and flanked by known primers were used. The principle is shown in Figure 1.8: the DNA of interest is denatured, and primers are allowed to bind to the complementary sequences. Then, a polymerase reaction is initiated. In the reaction mix, four nucleotides with a different chemistry (the dideoxynucleotides) are added alongside the usual deoxynucleotides. The four dideoxynucleotides are dideoxyA, dideoxyC, dideoxyG, and dideoxyT. Each dideoxynucleotide is labeled with a different fluorescent dye, represented by shades of gray in Figure 1.8. In the example, dideoxyG is labeled black, dideoxyT is white, dideoxyA is light gray, and dideoxyC is dark gray.
When the polymerase synthesizes the complementary strand, each time a normal nucleotide is incorporated, the synthesis continues. If a dideoxynucleotide is incorporated, the synthesis stops. This reaction creates a mixture of fragments of different lengths, each differing by only one nucleotide in size. The last nucleotide of the fragment is always a fluorescent dideoxynucleotide and is complementary to the last nucleotide in the analyzed fragment. By separating the different fragments according to their length, and analyzing which fluorescence they emit, the sequence can be read.

1.6.2.3 Quantitative Real-Time Reverse Transcription PCR
To determine if a specific gene is transcribed in a particular cell type, and to what level, quantitative real-time PCR is often used. After RNA extraction from the cells, the mRNA is reverse transcribed into cDNA. This cDNA can then be used as a template for real-time PCR. The difference between regular PCR and real-time PCR is that the number of fragments generated is read during the PCR reaction, through the exponential phase and to the plateau phase, and not at the end after the PCR has reached this plateau phase. For this, special PCR machines are necessary that can read fluorescence incorporated in the PCR fragments after each PCR cycle. The more cDNA of the gene of interest that is present in the original sample, the earlier (i.e. the fewer number of PCR cycles) the exponential phase of the PCR will start. An often-used measure of the abundance of the cDNA in the original sample is the Ct or threshold cycle. The Ct is defined as the cycle where the number of detected PCR fragments reaches a previously set threshold, usually when the exponential phase has definitely started. It is a measure of the number of fragments in the original sample. The abundance of the mRNA of interest is usually normalized to the abundance of mRNA from household genes, supposed to be expressed in all cells, such as HPRT or GAPDH. This allows for comparison of the expression of a gene of interest between different samples (e.g. OCT4 in human embryonic stem cells), or changes can be measured over time.
1.6.3 The Holistic View: Modern Tools in Genetic Analysis
1.6.3.1 Microarrays
Microarrays were developed in the 1990s when it first became desirable to analyze the whole genome or transcriptome of cells. They are always built following the same principles: DNA fragments are spotted onto a suitable support, mostly glass, according to a very precise location, hence “array.” The sample to be analyzed can be DNA or cDNA in solution and fluorescently labeled. After hybridization to the support, the amount of fluorescence for every spot in the array can be read in a high-resolution laser scanner. The abundance of a given DNA fragment or cDNA in a sample will determine the amount of fluorescence. Hence, the amount of fluorescence is a measure for the abundance of the DNA fragment or cDNA.
Originally, DNA fragments from large BAC (bacterial artificial chromosomes) libraries were spotted onto the glass slides. The more versatile and amenable oligonucleotide arrays (i.e. very short DNA fragments of only about 20 bp) have now largely taken over.
Single nucleotide polymorphism (SNP) arrays interrogate SNPs dispersed over the human genome and can be used for haplotyping (i.e. identification of the maternal or paternal origin of the chromosome) and copy number analysis.
Chapters 2, 4, and 13 will explore this topic more deeply.
1.6.3.2 Whole-Genome Sequencing
Sanger sequencing allows for the determination of the sequence of only a short stretch of DNA. In the wake of the Human Genome Project, it was considered necessary to develop methods to sequence the whole genome of one individual in one go. Several large biotech companies took up the challenge and developed methods based on different chemistries and using different platforms [Reference Metzker6]. This new technology was termed “next generation sequencing,” a term that a couple of years after its introduction is already obsolete and replaced by “third generation sequencing.” As the fourth and fifth generation are certainly already in the pipeline, we will refer to these technologies as “whole-genome sequencing” or “high-throughput sequencing.”
Whole-genome sequencing includes a number of methods that are grouped broadly as template preparation, sequencing and imaging, and data analysis. According to what methodology each provider applies in each step, different types of data are produced from each platform. Factors to take into consideration when choosing a platform include depth of the sequencing (i.e. the efficiency with which rare sequences are detected such as is required for RNA sequencing), the length of the sequences (which vary from 26 to more than 1000 bp), whether the platform amplifies the DNA fragments first before sequencing, whether the sequencing is done on single molecules, and of course the cost of the platform and of running the samples. A number of reports provide more detail on the chemistry and the possibilities of the different platforms [Reference Metzker6–Reference Schadt, Turner and Kasarskis9]. The authors of these studies also point out the difficulties of whole-genome sequencing, which are mainly a result of the large amount of data produced and the complex bioinformatics necessary to isolate relevant information from these data.
The applications of whole-genome sequencing are innumerable. The most prominent application has been the investigation of the genetics of rare human monogenic diseases. Because these diseases are so rare that only a handful of individuals worldwide are affected – sometimes only one family – they were not amenable to gene identification using classical genetics. By sequencing the whole genome in family trios (parents and one affected child) and comparing the whole sequence obtained using complex bioinformatics, genes for several of these rare diseases have now been identified. As most mutations in human genetic disease can be found in the exons, targeted sequencing of exons alone (called exome sequencing) has now become the method of choice as it is much more cost-effective than to sequence the whole genome [Reference van Dijk, Auger, Jaszczyszyn and Thermes10]. If exome sequencing does not yield results, whole-genome sequencing can be considered.
High-throughput sequencing on RNA is now the method of choice for transcriptome analysis and is referred to as RNA sequencing, which can even be applied at the single cell level. Methylome analysis is another important application, as it can establish which parts of the genome are methylated and which are not. This is important since methylation is associated with gene silencing, and variations in methylation can be related to development, cancer, and tissue identity.
1.7 Causes and Effects in Human Genetic Disease
1.7.1 Chromosomal Abnormalities
Chromosome abnormalities have traditionally been defined as alterations that produce a visible change in the chromosomes. However, as we have seen previously, this very much depends on the technique used. If classic G-banding is considered, the minimal visible change is about 4 Mb. A more functional definition states that any abnormality arises from specific chromosomal mechanisms, such as incorrect segregation of chromosomes during mitosis or meiosis, misrepair of broken chromosomes, or improper recombination events. Chromosomal abnormalities can be constitutional (i.e. they are present in every cell of the individual) or the individual can be mosaic (i.e. two or more cell lines are present originating from the same zygote). In postnatal cytogenetics, usually only two cell lines will be detected but, as we will see in Chapter 13, preimplantation embryos can carry many different cell lines and are then called chaotic mosaics.
Two categories are distinguished: chromosomal abnormalities with altered copy number (i.e. numerical abnormalities) or the structural abnormalities where chromosomes show abnormal structure.
1.7.1.1 Numerical Abnormalities
Triploidy and tetraploidy are forms of polyploidy – all cells in the individual carry respectively three or four haploid genomes. Triploidy is usually caused by the fertilization of the oocyte with two spermatozoa, while tetraploidy is due to an incomplete first embryonic division: the DNA is replicated to 4N but the cell does not divide. Both triploidy and tetraploidy are lethal.
Aneuploidy is where one or more individual chromosomes are either missing or present with an extra copy. The best-known trisomy is Down syndrome, where one extra chromosome 21 is present (47,XY,+21). Monosomies are lethal in the embryonic period except for monosomy of the X chromosome, as in Turner syndrome (45,X). One mechanism through which aneuploid cells arise is nondisjunction, which can arise during meiosis leading to abnormal gametes, or during mitosis leading to mosaicism. During meiosis, paired chromosomes fail to separate or sister chromatids fail to disjoin during mitosis. Another mechanism is anaphase lag, in which a chromosome or a chromatid lags behind the other chromosomes during movement in anaphase, and is lost.
The consequences of numerical abnormalities are dire: nullisomies and monosomies (except Turner syndrome) are never viable, while only individuals with trisomies of 13, 18, and 21 may survive to term. Of these, only those with trisomy 21 can reach adult life. Sex chromosomes again form an exception: 47,XXX, 47,XXY and 47,XYY are all known to cause very few clinical problems and these individuals have normal lifespans. The effects of aneuploidies on fertility are discussed in Chapter 7.
1.7.1.2 Chromosomal Rearrangements
Chromosome breaks can be caused by DNA damage or faulty recombination during meiosis. Cellular mechanisms will try to repair these breaks by rejoining the ends, or by adding telomeres to the ends. If such repair mechanisms lead to a chromosome with no centromere (i.e. an acentric chromosome) or a dicentric chromosome, these chromosomes will be lost during segregation in the next mitosis.
When two breaks occur in the same chromosome, a fragment can be lost (deletion) or inserted after it is inverted (inversion) or included in a circular chromosome (a ring chromosome).
When two chromosomes each suffer one break, the resulting fragments can be exchanged. This is called a translocation. If acentric fragments are exchanged, this leads to a stable centric chromosome that can be passed on in mitosis, and this is termed a reciprocal translocation. Any acentric or dicentric product arising from exchange of a centric and an acentric fragment are lost during mitosis. Reciprocal translocations can lead to the birth of offspring with severe deficiencies; however, more often they will lead to repeated miscarriages or even subfertility. This is further discussed in Chapter 7.
Robertsonian translocations are a peculiar type of translocation involving chromosomes 13, 14, 15, 21, or 22. These chromosomes have very small short arms that are very similar in DNA sequence. When the short arms of two of these chromosomes break, acentric and centric fragments are exchanged resulting in acentric and dicentric fragments. The acentric fragment is lost, while in the dicentric fragment the centromeres are so close to each other that they fuse and form one large centromere (centric fusion). This chromosome is stable during mitosis.
Individuals who carry a balanced rearrangement have a normal phenotype, although the term “balanced” has come under pressure since the advent of higher resolution chromosomal analysis. However, carriers’ gametes run into problems when entering meiosis. As explained earlier, in order to proceed through meiosis, the chromosomes have to pair in order to allow recombination (see Chapter 3). The cell that carries two abnormal chromosomes has to form special structures to allow for the pairing of the abnormal chromosome with the normal chromosomes. In a carrier of a Robertsonian translocation, no less than six different haploid cells can be formed. Only one of these gametes will lead to a normal individual, while a second one will lead to a balanced (and thus phenotypically normal) individual; the other four will lead to either monosomy or trisomy. If chromosomes 13 or 21 are involved, Robertsonian translocation carriers are at risk of offspring with trisomy 13 or 21.
1.7.2 Monogenic Diseases
1.7.2.1 Modes of Transmission
How a monogenic disease is transmitted mainly depends on two factors: firstly, whether the disease is dominant or recessive and, secondly, whether the gene is located on an autosome or on a sex chromosome (mostly the X-chromosome). In autosomal recessive disorders the carriers have a normal phenotype, while individuals with a mutation in both genes are affected. This can mostly be explained by the fact that recessive mutations are usually loss-of-function mutations. If one copy of a gene coding for an enzyme is therefore eliminated, the second copy ensures that sufficient enzyme activity remains. However, if the two copies are disabled, then the individual carrying this disease is affected. This explains why in recessive diseases, both parents of an affected child are phenotypically normal carriers. The most frequent autosomal recessive diseases include hemochromatosis and cystic fibrosis in Caucasian populations, sickle cell anemia in African populations, and β-globinopathies in Mediterranean countries.
In autosomal dominant inheritance, individuals who carry only one copy of the defective gene are affected. The genes responsible for the diseases often carry a gain-of-function mutation. The protein that is synthesized from the gene causes problems, for example in Huntington’s disease, because the abnormal protein forms toxic aggregates. Loss of function can also lead to dominant transmission if there is so-called haploinsufficiency, i.e. one copy of the gene does not produce sufficient protein for normal functioning. Other well-known examples of autosomal dominant diseases include neurofibromatosis (von Recklinghausen disease) and myotonic dystrophy or Steinert disease.
Monogenic diseases that lie on the X-chromosome have a particular mode of transmission, because women carry two X-chromosomes and men only one. Thus, in male patients, mutations on their one X-chromosome is not balanced by the second X-chromosome as it is in women. Here too, both recessive and dominant modes of inheritance exist. Examples of well-known recessive X-linked disorders are color blindness (very common but quite harmless) and the hemophilias. Dominant X-linked disorders are quite rare: OMIM (Online Mendelian Inheritance in Man) lists 821 of them. One striking example is incontinentia pigmenti: in affected males, the disease is usually lethal in the prenatal period. Affected girls show abnormalities in skin, hair, and central nervous system and a high rate of X-chromosome skewing. This is because the cells with an active mutation-carrying chromosome are lost around birth. Fragile X syndrome is also classified as dominant, but we will see later that this is related to the particular type of mutation.
1.7.2.2 Mutation Types
Changes in one or a few base pairs are the most common mutations. A missense mutation means that one base pair in a sequence is changed and causes one amino acid in the protein to be changed. This can lead to both loss-of-function mutations, such as when the active site of an enzyme is changed, and gain-of-function mutations because the three-dimensional structure of the protein is changed. Nonsense mutations change one codon to a stop codon, leading to a shortened mRNA, which is usually degraded and not translated into protein. This type of mutation thus mostly leads to loss of function. However, if the stop codon is at the end of the mRNA, protein can still be translated. This truncated protein can cause many problems. In frameshift mutations, deletions or insertions of a few base pairs cause a frameshift in the downstream translational reading frame. A well-known example is the most common mutation in Tay–Sachs disease: a 4-bp insertion in the α-chain of hexosaminidase A. Other examples include splice site mutations, which cause whole exons to be missing or introns to be included in the mature mRNA, and mutations in the promoter regions, which cause insufficient or excessive mRNA to be transcribed.
Dynamic mutations are a special class of mutation, and are mentioned here separately because a significant number of patients who are assessed for monogenic disease by preimplantation genetic testing (see Chapter 13) undergo treatment for these types of disease. Small repeats, usually of three nucleotides, are present in many genes and are usually transmitted in a stable, Mendelian way [Reference an Dijk, Jaszczyszyn, Naquin and Thermes11]. However, if their size increases over a certain threshold, they become unstable and tend to enlarge during replication and/or meiosis. In some of these diseases, the triplet repeat codes for a stretch of amino acids, which in Huntington’s disease comprises glycines; if the glycine repeat becomes too large, it will cause the protein to misfold and form toxic aggregates. In other diseases, the repeats are located outside the coding sequence in the 5′ or 3′ untranslated region, or in an intron. This very long repeat then usually prevents expression of the gene, as is the case in fragile X syndrome. However, myotonic dystrophy type 1 (DM1) has a different molecular pathology: the mRNA transcribed from the DMPK gene that carries an expanded repeat in the 3′ region forms aggregates and sequesters proteins responsible for splicing mRNA, thus causing dysfunctions in the genes that are no longer properly spliced. Moreover, the enlarged repeat has an effect on the transcription of genes close to the DMPK gene. This partly explains the pleiomorphic character of DM1.
With the advent of technologies allowing a more in-depth analysis of our genomes, many genes involved in human infertility have been identified. These are discussed in Chapter 8 for the genes involved in male infertility, and in Chapter 9 for those involved in female infertility.