


Introduction
The transmission electron microscope (TEM) is a powerful tool for imaging and analyzing samples at the nanoscale. The interaction of the electron beam with the sample yields a wide range of signals that are useful for determining a sample's size, shape, composition, and morphology. Unfortunately, the same electron probe used for imaging can also damage many samples. A microscopist can unintentionally destroy a sample that required significant time and money to prepare. Worse yet, beam damage can change the sample in ways that lead to false conclusions about the data and create experimental ambiguity. Beam damage is especially challenging for in situ studies since the goal of in situ work is to characterize a reaction independent of beam damage. For example, was an observed reaction due to applied stimulus, beam damage, or both?
One common approach is to use “low dose” techniques that seek to minimize the beam/sample interactions to a level where they do not substantially impact the sample or the analysis results [Reference Żak1]. These efforts to limit both the cumulative electron dose (e-/Å2) and the dose rate (e-/Å2s) are well documented in the literature both for conventional and in situ TEM, especially for techniques sensitive to radiolysis, such as liquid EM [Reference Egerton2–Reference Lee4]. A more advanced approach would allow users to calibrate their TEM, quantify dose and dose rate throughout an experiment, and control either parameter within a user-defined threshold. An accurate measure of the dose imparted to a particular location on a sample as a function of time is essential so that images or other data can be compared across sites, across samples, across instruments, and across time.
Until now, a robust solution for managing the electron dose during TEM experiments—one that enables a user to track and manage beam effects—has been hampered by several key issues. First, the calibration of a TEM's beam current can be a tedious and difficult process that requires many steps to accurately account for all microscope variables [Reference Żak1]. Once calibrated, the workflow requires the microscopist to either remain at a specific magnification or to work within other severe limitations to keep dose rates constant and simplify dose calculations. Finally, after a dose threshold is determined, the operator must keep track of imaged regions within the sample and try to compensate when the limit is approached.
Here, we review the features and benefits of AXON Dose, a machine-vision solution designed to address and eliminate the challenges of calibrating, managing, and tracking a sample's electron dose exposure throughout the course of a TEM experiment.
Calibration
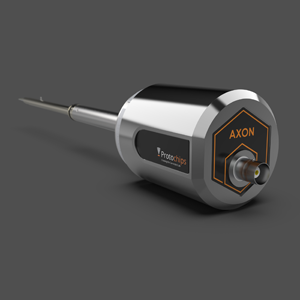
An improved dose workflow starts with beam current calibration. A Faraday cup in the sample plane, connected to a picoammeter, can fully collect and accurately measure the current. By measuring the current for each aperture, spot size, and intensity, the beam current can be calibrated across all lens settings. Having characterized beam current, the corresponding beam area can then be measured over the same set of conditions. The Protochips Dose holder, shown in Figure 1, is designed to support a workflow that measures both current and area. It features a Faraday cup for current collection, a through-hole to allow measurement of beam area using the camera, and fiducials that, along with software control, allow the entire calibration process to be automated. This encourages regular use of the calibration workflow for the highest level of accuracy over time. With calibrated beam current and area for all microscope settings, the electron dose rate and, when tracked to specific sites on the sample over time, cumulative electron dose can be determined precisely for any pixel on any image.

Figure 1: Images of the AXON Dose TEM holder. The tip includes two areas—a Faraday cup for collecting beam current and a through-hole that allows the beam to pass through the tip so that its area can be measured using the camera. The Dose holder is connected to a picoammeter to accurately measure small currents. A software-driven automated workflow correlates beam current and beam area across all microscope settings.
Integration
Freely operating the instrument as normal, through various spot sizes or magnifications, while keeping track of the total accumulated dose and/or dose rate over the entire sample area, isn't practical without a means to simultaneously track the beam's position on the sample. To achieve this goal, the AXON Synchronicity system can be used to compensate for sample drift and other sample movement through adjustments to stage, beam, and camera acquisition conditions. Synchronicity also continuously collects images and metadata produced during an experiment, automatically saving all information to the image metadata.
Integration of dose information into the image metadata enables robust analysis and visualization using heatmaps from which accurate, quantifiable information on cumulative dose and fluence can be obtained from any point on the experimental timeline. Figure 2 shows an example of images from the AXON Dose user interface, which allows investigators to easily measure the dose exposure at any point in the image series and to graphically visualize any or all of the collected metadata associated with the images. AXON Dose also allows users to set limits on dose and dose rate so that critical thresholds are not exceeded. Finally, AXON Dose has tools that allow quantification of beam damage in samples. Observing changes in a sample's diffraction pattern is a common way to identify beam damage in crystalline materials. As shown in Figure 3, AXON Dose can be used to correlate this “spot fading” with the onset of beam damage.

Figure 2: TEM images with “heatmaps” showing the cumulative dose imparted at a sample site produced using the AXON Dose software. Colors and color gradients can be adjusted by the user. Optional text overlays show the current dose rate, the maximum cumulative dose on the image, and the dose area. Translation or changes in magnification create local “hotspots” with higher dose accumulation.

Figure 3: User interface of the AXON Dose Image Analysis tool, shown here with a zeolite sample. The fast Fourier transform (FFT) of the image with a radial line scan across the FFT is shown in the upper right of the figure. These tools, combined with cumulative dose and dose rate information, allow investigators to quantify changes in the intensity of the Bragg spots (“spot fading”) as an indicator of beam damage to the sample.
Operation
An example of beam interactions producing visible changes in a material is easily observed in liquid cell STEM. In situ studies have shown that rastering the electron beam through aqueous solutions causes radiolytic decomposition of water into reducing and oxidizing species, and aqueous electrons can drive the nucleation and growth of metallic nanoparticles. The onset of nucleation, the particle growth rate, and other characteristics of the process are known to be dose- and dose rate-dependent. With AXON Dose, the impact of the electron beam on nanoparticle growth can be quantified.
Figures 4 and 5 show STEM images of HAuCl3 solution imaged in a Poseidon liquid cell using AXON Dose. An area of the liquid cell was imaged at high magnification until a reaction was observed, and then the magnification was gradually reduced in steps. This created an image with high dose areas in the center surrounded by lower dose areas in the periphery. AXON Dose heatmaps allow these areas to be visualized as heatmaps, and the precise dose history for each pixel on each image is known. It is clear from the images that a correlation exists between cumulative dose and particle size and that higher electron dose produces larger particles.

Figure 4: A STEM image with a “heatmap” overlay showing the cumulative dose across a sample area. The HAuCl3 area exposed to high dose has a large particle size (top right), whereas the low dose area (bottom right) has finer particles.

Figure 5: STEM images of Au nanoparticles produced in a liquid cell due to electron interactions with HAuCl3 solution. Particle growth is observed at high doses.
Conclusion
The AXON Dose platform provides a state-of-the-art solution for calibrating, monitoring, and tracking both the electron fluence and the total dose delivered to specific areas of the sample on a pixel-by-pixel basis. This ability unlocks a new paradigm for imaging dose-sensitive samples and understanding the electron beam interactions that can affect the rigor and reproducibility of in situ and operando TEM experiments.


