

Introduction
A number of proglacial lakes have formed and expanded in temperate valley glaciers during the 20th century, as a consequence of the warming climate (e.g. Reference Kirkbride and WarrenKirkbride and Warren, 1999; Reference Motyka, O’Neel, Connor and EchelmeyerMotyka and others, 2003). The formation and expansion of a proglacial lake allows for iceberg calving, which can remove large volumes of ice in a relatively short period (e.g. Reference Funk and RöthlisbergerFunk and Röthlisberger, 1989; Reference Purdie and FitzharrisPurdie and Fitzharris, 1999; Reference Warren and AniyaWarren and Aniya, 1999; Reference Naruse and SkvarcaNaruse and Skvarca, 2000; Reference Motyka, O’Neel, Connor and EchelmeyerMotyka and others, 2003; Reference Boyce, Motyka and TrufferBoyce and others, 2007; Reference Larsen, Motyka, Arendt, Echelmeyer and GeisslerLarsen and others, 2007).
Ice flow speeds in calving glaciers are highest near the terminus (Reference Meier and PostMeier and Post, 1987; Reference Warren and AniyaWarren and Aniya, 1999; Reference Vieli, Funk and BlatterVieli and others, 2000), due to enhanced basal motion caused by low effective pressure, P e, which is given by P e = P i – P w ere P i and P w are the ice overburden and subglacial water pressures, respectively, as the glacier approaches flotation (Reference Iken and BindschadlerIken and Bindschadler, 1986; Reference Vieli, Funk and BlatterVieli and others, 2001). Observations on mountain glaciers suggest that the basal sliding increases as the effective pressure decreases (e.g. Reference BindschadlerBindschadler, 1983). When the terminus accelerates, a calving glacier retreats by discharging more ice into the water by calving. Moreover, acceleration of the glacier terminus causes longitudinal extension of the glacier, resulting in thinning of the ice due to compressive vertical strain, so-called dynamic thinning. For example, ice thinning observed at Mendenhall Glacier, Alaska, USA, during 2002–04 was controlled by both dynamic thinning and surface ablation (Reference Boyce, Motyka and TrufferBoyce and others, 2007). The behaviour of calving glaciers, therefore, is critically dependent on spatial and temporal variations in ice flow speed. The relationship between flow velocity and effective pressure implies a positive feedback mechanism between the flow velocity and ice thickness. An initial thinning due to increased surface melting will lead to flow acceleration, which in turn results in ice thinning due to an extending flow. Such a positive feedback mechanism has been discussed in the context of retreating tidewater glaciers (e.g. Reference Meier and PostMeier and Post, 1987; Reference PfefferPfeffer, 2007).
The break-up of the glacier terminus is another important impact of lake formation. This is because a glacier can retreat very rapidly by losing a large amount of ice into the water within a short period. This may occur when the subglacial water pressure exceeds the ice overburden pressure. Observations at Triftgletscher, Switzerland, showed that the glacier terminus retreated dramatically by calving after proglacial lake formation in 2000 (Reference Dalban CanassyDalban Canassy and others, 2011). The important role of proglacial lake formation in rapid glacier retreat has also been reported at numerous other glaciers (e.g. Reference Motyka, O’Neel, Connor and EchelmeyerMotyka and others, 2003; Reference Boyce, Motyka and TrufferBoyce and others, 2007; Reference Larsen, Motyka, Arendt, Echelmeyer and GeisslerLarsen and others, 2007). However, few studies have undertaken in situ observations of glacier dynamics during the formation of a proglacial lake. To gain a deeper insight into the mechanisms that control lake-front glacier dynamics, it is important to obtain ice-flow and water-pressure data at high spatial resolution during lake formation and expansion.
To investigate the influence of proglacial lake formation and expansion on ice flow regime and glacier evolution, we carried out intensive field measurements around the terminal part of Rhonegletscher, Switzerland, during the summer seasons of 2007–09. Previous work indicated ice thinning, acceleration and upward motion of the glacier terminus during proglacial lake formation (Reference Tsutaki, Nishimura, Yoshizawa and SugiyamaTsutaki and others, 2011). Here we examine ice dynamics and sub-glacial hydrological conditions, and discuss mechanisms for crevasse formation and surface uplift observed at the terminus. Boreholes were drilled using a hot-water technique to measure ice thickness and subglacial water pressure. Measurements of the horizontal ice speed and ertical ice motion were also made at a high spatial resolution. Our field data revealed ice acceleration, flow regime changes and glacier front flotation during the formation of the lake. Our results support several important processes proposed by previous studies, and will provide an important dataset for future predictions of glacier evolution following lake formation.
Methods
Study site
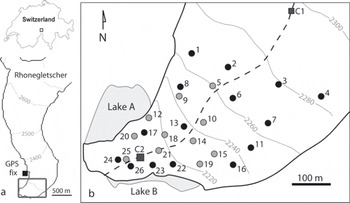
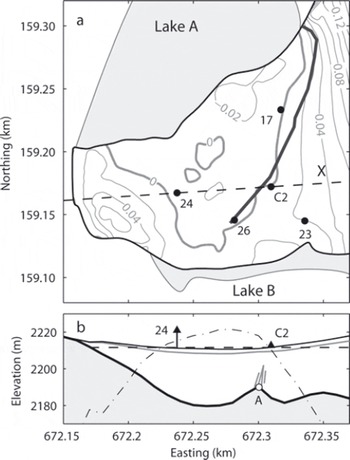
Rhonegletscher is a temperate valley glacier in the Swiss Alps (Fig. 1a). The length and area of this glacier in 2007 were 9 km and 16 km2, respectively (Reference Bauder, Funk and HussBauder and others, 2007). The glacier terminus retreated by 1700 m between 1878 and 2000 (Reference Sugiyama, Yoshizawa, Huss, Tsutaki and NishimuraSugiyama and others, 2011), and proglacial lakes formed because the terminus retreated behind a bedrock ridge (Reference Sugiyama, Tsutaki, Nishimura, Blatter, Bauder and FunkSugiyama and others, 2008a). One of the lakes, located at the northwestern margin of the glacier, has existed since the late 1990s (lake A; Fig. 1b). The other lake (lake B) appeared in 2005, collecting water between the glacier snout and the bedrock ridge (Fig. 1b). The two lakes are separated by the glacier, but their levels were nearly the same, at 2211.4–2211.5 m a.s.l. in 2007 (Reference Sugiyama, Tsutaki, Nishimura, Blatter, Bauder and FunkSugiyama and others, 2008a). Our field activities were carried out in a region within 800 m of the glacier terminus, during the summer seasons of 2007–09 (Fig. 1b).
(a) Map of Rhonegletscher showing surface elevation in 2000. The black square shows the location of the GPS reference station. (b) The study area indicated by the box in (a). Contours show the surface elevation in 2009. Numbered locations of boreholes drilled in 2007–09 are shown. The grey square shows the location of the continuous GPS rover station. The black circles show the locations of boreholes with GPS measurement stakes, while the grey circles are boreholes without stakes. The two proglacial lakes (A and B) are indicated by shading.
Water level measurements
During the summer seasons of 2007–09, 51 boreholes were drilled to the glacier bed using a hot-water drilling technique in a region that extended for 800 m from the terminus (Reference Sugiyama, Tsutaki, Nishimura, Blatter, Bauder and FunkSugiyama and others, 2008a; Reference Tsutaki and SugiyamaTsutaki and Sugiyama, 2009; Reference Tsutaki, Nishimura, Yoshizawa and SugiyamaTsutaki and others, 2011). The borehole at site C1 was drilled in 2007, while those at C2 and 1–26 were drilled in 2008 and 2009 (Fig. 1b). Subglacial water pressure was continuously measured at C1 from 14 July to 5 September 2007, at C2 from 18 July 2008 to 5 September 2009, and at site 5 from 1 July to 5 September 2009, using vibrating-wire pressure sensors installed at the bottom of the boreholes (Geokon Model 4500). The pressure was recorded every 10 min using a data logger (Campbell Scientific CR-1000) and the subglacial water pressure was converted to borehole water levels. The accuracy of the pressure measurement was equivalent to a water level of ±0.2 m. In other boreholes, we measured water levels with a tape measure equipped with a float sensor. Measurements were conducted every 10–14 days in the periods 24 July–6 September 2008 and 26 June–5 September 2009, with an accuracy of ±0.1 m. Note that we abandoned water-level measurements at site 23 in 2009 because it became blocked by rock debris 4.9 m below the surface on 2 July.
Flow speed measurements
We measured the surface motion of the glacier by surveying 17 stakes (aluminium poles, 4.0–6.0 m long) installed into the ice (Fig. 1b). We used dual-frequency GPS receivers and antennas (Leica System 1200) to measure the three-dimensional positions of the stakes. One antenna was fixed to solid rock on the western bank of the glacier as a reference station (Fig. 1a). At C1 and C2, the antennas were mounted on the stakes and operated for periods of 1 hour, separated by intervals of 3 hours (Fig. 1b). The other stakes were surveyed with the same devices for 20–30 min every 10–14 days. These data were processed in static mode by the GPS software (Leica Geo Office) to compute the position of the stakes. The distance between the rover and reference receivers was 208–634 m horizontally and 2–122 m vertically, and this relatively short distance was crucial to ensure the necessary accuracy of the GPS measurements. A control experiment carried out with a baseline length of 82 m and vertical separation of 12 m gave standard deviations of 1.6 and 4.1 mm in the horizontal and vertical directions, respectively. Stake length above the surface was maintained to be <2 m, in order to reduce the influence of ice melting and wind on survey accuracy. Surface ablation does not influence the vertical displacement of the stake because the stake motion represents the displacement of ice near the glacier surface. We visually checked the inclination of the stakes every 10–14 days, and all stakes were reinstalled every 30–50 days. Consequently, measurement errors due to the long-term (3 months) leaning of stakes were estimated to be <20 mm. This error is <3% of the total stake displacement over 10–14 day survey intervals and does not affect sub-daily velocity variations. The GPS measurements at C1 were conducted during the periods 14 July–6 September 2007, 18 July–7 September 2008 and 27 June–6 September 2009. Measurements at C2 were conducted during 18 July–7 September 2008 and 27 June–6 September 2009. At other stakes, measurements were conducted between 27 June and 6 September 2009. Surface flowvelocities at C1 and C2 were calculated every 3 hours by smoothing the horizontal displacement of the stake using a Gaussian smoothing routine with a bandwidth of 0.125 days. Surface strain rates were computed from the displacement of three neighbouring stakes (Reference JaegerJaeger, 1969).
We measured the surface elevation of lake A on 21 July 2008, 29 August 2008 and 2 September 2009 using the same GPS devices. The surface elevation of lake B was measured on 27 July 2008, 29 August 2008 and 2 September 2009.
Results
Ice motion and borehole water level 2007–09
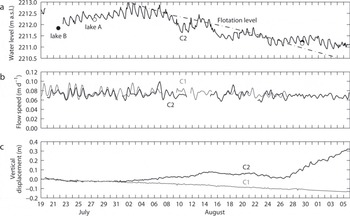
The daily water level minima at C1 were observed consistently in the early morning over the period 14 July–1 August 2007 (Fig. 2a). The minimum levels were 2213.4–2215.1 m a.s.l., which is 2–4 m higher than the surface level of lakes A and B. After 2 August, the water level gradually rose and the amplitude of the diurnal variation in water level decreased. During the entire measurement period in 2007, the ice flow speed showed diurnal variations (Fig. 2b). The vertical displacement at C1 and C2 showed a downward movement over the measurement period (Fig. 2c).
Time series of data from Rhonegletscher in 2007. (a) Water level in the borehole at site C1. The dashed line indicates the lake level (2211.4 m a.s.l.) reported by Reference Sugiyama, Tsutaki, Nishimura, Blatter, Bauder and FunkSugiyama and others (2008a). (b) Horizontal flow velocities at C1 (grey) and C2 (black). (c) Vertical displacement at C1 (grey) and C2 (black), relative to the elevation on 14 July 2007. The measurement error is ±4 mm.

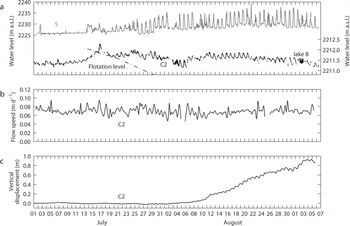
In 2008, the water level in the borehole at C2 showed diurnal fluctuations with an amplitude of <0.5 m (Fig. 3a), and was within 0.2 m of the level of the lake surface. The flow speeds varied diurnally, and were similar at C1 and C2 (Fig. 3b). The vertical movement of the glacier surface at C1 was downwards at a mean rate of 3 mm d−1 (Fig. 3c). In contrast, the surface moved upwards at C2 at a rate of 30 mm d−1 from 27 August to 6 September. The ice surface elevation dropped as a result of surface melt (49 mm d−1 from 5 August to 5 September), the compressive vertical strain rate (−1.7 × 10⁻³ d−1 from 26 July to 3 August) (Reference YoshizawaYoshizawa, 2010) and downslope movement of the stake (6 mm d−1). Accordingly, the ice flotation level (i.e. the level at which the basal water pressure equals the ice overburden pressure) dropped by 78 mm d−1 during the measurement period. The water level exceeded the ice flotation level during the uplift event on 27 August.
Time series of data in 2008. (a) Water level in the borehole at site C2. Open and solid circles show surface elevations of lakes A and B, respectively. Dashed-dotted curve is the flotation level of ice thickness. (b) Horizontal flow velocities at C1 (grey) and C2 (black). (c) Vertical displacement at C1 (grey) and C2 (black) relative to the elevation on 18 July 2008.
In 2009, the daily water level minima in the borehole at site 5 during the entire measurement period were 14–18 m above the lake surface (Fig. 4a). The water level in the borehole at C2 was within 0.2 m of the level of the lake surface on 2 September. The ice flotation level dropped at a rate of 79 mm d−1, and was lower than the water level after 16 July. The changes in the flotation level during this period were due to surface melting (58%), vertical straining (34%) and downslope stake movement (8%). The flow speed varied diurnally at C2 (Fig. 4b). Vertical displacement from 1 July to 5 August was within 0.03 m (Fig. 4c). The glacier surface at C2 rose at a rate of 30 mm d−1 from 6 August to 5 September, and began to drop on 6 September.
Time series of data in 2009. (a) Water levels in the boreholes at sites 5 (grey, left axis) and C2 (black, right axis). Solid circle indicates the surface level of lake B. Dashed-dotted curve is the flotation level of ice thickness (right axis). (b) Horizontal flow velocity at C2. (c) Vertical displacement at C2 relative to the elevation on 1 July 2009.
Flow fields in 2009
The surface velocity fields in the periods 3 July–6 August (period I) and 6 August–5 September (period II) in 2009 are shown in Figure 5a. In period I, the velocity was generally greater near the terminus than in the upper reaches. For example, the velocity at C2 (25.7 m a−1) was 16% and 40% greater than that at sites 2 (22.2 m a−1) and 3 (18.4 m a−1), respectively. The greatest velocity recorded was 25.8 m a−1 at site 23, located 163 m from the terminus. In period II, the velocities at sites 13 and 24 were 44% lower than those in period I. The glacier flow at site 17 became more westward. The flow at sites 13 and 24 also became more westward, but the magnitude of the changes was smaller than at site 17. A very large upward motion was observed at the stakes located near the lake front in period II. The vertical velocities at sites 17, 24 and 26 were >20 m a−1 in period II (Fig. 5b). The vertical velocity increased by 58% and 78% at sites 17 and 26, respectively, from period I to II, whereas it decreased by 59% at site 24. The direction of ice movement was downwards at most of the other stakes.
Horizontal flow vectors measured from 3 July to 6 August (period I; grey, bold), and from 6 August to 5 September 2009 (period II; black, thin). (b) Magnitude of vertical flow velocities measured from 3 July to 6 August (grey), and from 6 August to 5 September 2009 (black). (c) Horizontal surface strain rates calculated from measured velocities over the period 3 July–6 August 2009. Coordinates based on the official Swiss coordinate system.
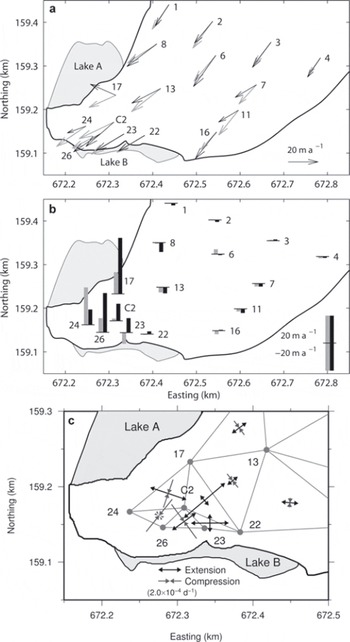
The spatial distribution of the surface strain rates shows a clear stretching flow regime near the terminus (Fig. 5c). The strain rate was greatest across C2–17–22 (4.6 × 10⁻⁴ d−1), which was extensional in the northeast–southwest direction. Similarly, large strain rates were observed across C2–17–24 (3.3 × 10⁻⁴ d−1, extensional northwest–southeast) and C2–22–23 (3.3 × 10⁻⁴ d−1, extensional east–west). In contrast, compressive flow was observed near the terminus across C2–24–26 (−3.6 × 10⁻⁴ d−1, northeast–southwest). The magnitude of the strain rate was significantly smaller in the upper part than near the terminus.
Crevasse formation and surface uplift
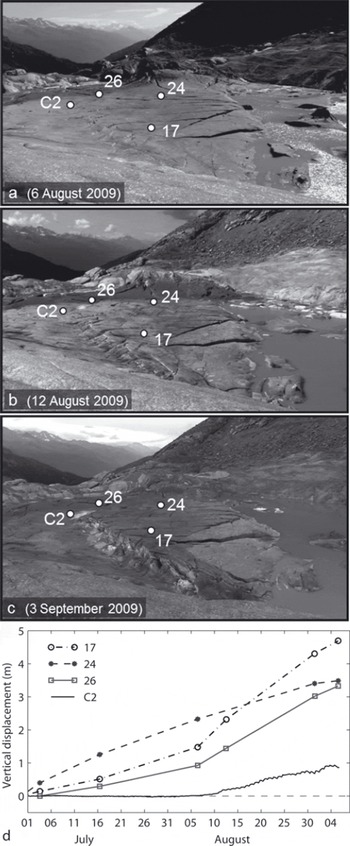
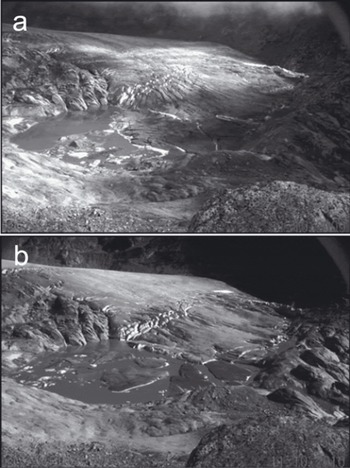
According to visual and photographic observations, crevasses began to form with an east–west orientation on 6 August 2009, and appeared clearly on the ice surface on 12 August 2009 along the northern margin of lake A between sites 17, C2 and 26 (Fig. 6a and b). GPS measurements at sites 17, 24 and 26 indicate anomalous vertical ice motion during crevasse formation. A large vertical displacement (1.93 m) occurred at site 24 between 3 July and 6 August, which was followed by an increase in the upward velocity at sites 17 and 26 after 6 August. Mean uplift rates at sites 17 and 26 were 0.05 and 0.03 m d−1, respectively, from 3 July to 6 August, and 0.14 and 0.08 m d−1 from 6 to 30 August. On the other side of the crevasses at C2, the rate was only 0.02 m d−1 from 6 to 30 August. As a result of this huge uplift, the ice on the southern side of the crevasses was elevated 3.8 m relative to the other side by 3 September (Fig. 6c). The total amount of vertical displacement from 1 July to 5 September was 4.69 m at site 17, 3.48 m at 24, 3.32 m at 26 and 0.93 m at C2 (Fig. 6d). After 1 September, the uplift rates decreased on the southern side of the crevasses. The rate at site 24 was 0.02 m d−1, which was equivalent to the rate at C2.
Photographs showing the terminus of Rhonegletscher on (a) 6 August, (b) 12 August and (c) 3 September 2009. The locations of survey stakes are indicated. (d) Vertical displacement of the glacier surface relative to the elevation on 1 July 2009 at sites 17, 24, 26 and C2.
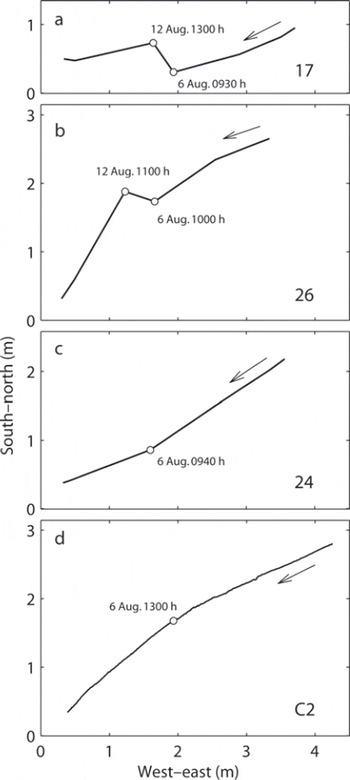
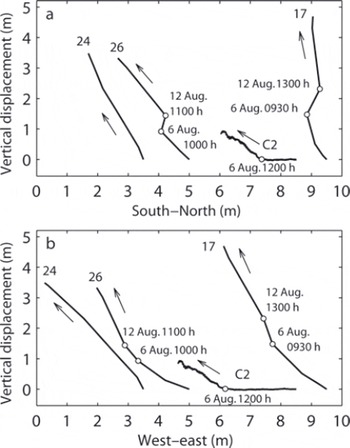
This crevasse formation was also evident within the horizontal motion of the stakes (Fig. 7). At the beginning of the crevasse formation period, the ice flow at sites 17 and 26 changed from its original direction and began to flow towards the northwest. After the appearance of crevasses on the ice surface, the flow direction reverted to its original direction. For example, the flow direction at site 17 changed to the northwest, but returned to the southwest after 12 August (Fig. 7a). Similar flow change was observed at site 26 (Fig. 7b). Changes in the flow direction at sites 24 and C2 were also observed on 6 August, although the magnitude of directional change was less than that at sites 17 and 26 (Fig. 7c and d). After 6 August, the flow changed from its original direction to a westerly flow at site 24, and to the south at site C2. Changes in flow direction were also observed in the vertical direction, which can be seen in the stake motion projected onto the vertical plane (Fig. 8). Between 6 and 12 August, the flow direction at sites 17 and 26 was to the north, which was substantially different from the direction before and after this period.
Plan view of stake movement from 29 June to 5 September 2009 at sites (a) 17, (b) 26, (c) 24 and (d) C2.
Stake motion projected on (a) south–north and (b) west–east vertical planes from 29 June to 5 September 2009.
Borehole water levels
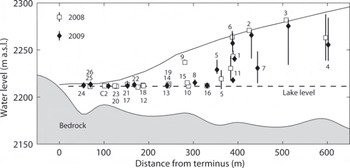
The mean water levels along the centre of the glacier in 2008 and 2009 are shown in Figure 9. Borehole water levels were up to 5 m above the lake level within 300 m of the glacier terminus. In the upper reaches, the boreholes were classified into two groups: one in which water level varied significantly (sites 2 (2009), 3 (2009), 4 (2008, 2009), 5 (2008, 2009), 6 (2009), 7 (2009) and 11 (2008)), and another in which water levels were nearly constant (sites 1 (2009), 2 (2008), 3 (2008), 6 (2008) and 11 (2009)) over the entire measurement period. The minimum water level in these boreholes was higher than the lake level, except for that at site 5.
Mean water levels measured in the boreholes in 2008 (open squares) and 2009 (solid diamonds). The horizontal axis shows the distance of boreholes from the glacier terminus. The vertical lines indicate the range of water level variations during the measurement periods. The solid curve indicates the glacier surface in July 2009 and the dashed line shows the mean lake level. The shaded area indicates bedrock along the dashed curve in Figure 1b.
Discussion
We now discuss the mechanisms of acceleration, ice thinning, crevasse formation and huge surface uplift of the glacier terminus observed during the proglacial lake formation.
Acceleration of the glacier terminus
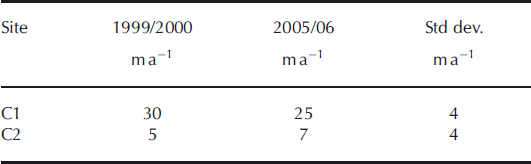
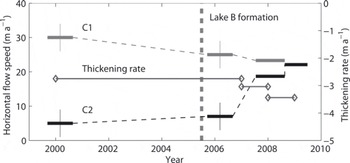
We investigated the influence of lake formation on the speed of ice flow by comparing our observations at sites C1 and C2 from 2007 to 2009 with those measured from aerial photographs taken in 1999/2000 and 2005/06 (Reference NishimuraNishimura, 2008) (Table 1). Note that our measurements were made in the summer, while the reported data represent annual velocities. To account for the seasonal velocity change, summer velocities measured at sites C1 and C2 were corrected using the relationship between the summer (27 June to 6 September 2009) and annual (7 September 2008 to 5 September 2009) velocities measured at sites 2 and 3. The corrected annual velocity in 2008/09 accounts for 85% of the summer velocity in 2009. The 1999/2000 and 2006/07 velocities were obtained at gridpoints of a 100 m mesh with an accuracy of 4.0 m a−1 (Reference NishimuraNishimura, 2008), whereas our data were obtained by stake surveying. The velocities were compared at our GPS measurement sites using cubic interpolation. Annual velocity at site C2 increased by 40% after the lake formation and by a factor of 2.7 in the period between 2005/06 and 2007/08 (Fig. 10). In contrast, the velocity at site C1 decreased by 7% between 2005/06 and 2007/08. The velocity gradient along the glacier has shown a change from negative to nearly zero since the formation of the lake.
Horizontal flow velocity at sites C1 and C2 in 1999/2000 and 2005/06 obtained from differential aerial photogrammetry (Reference NishimuraNishimura, 2008)
Horizontal flow velocities at sites C1 and C2 from 2000 to 2009. Thin line with open diamonds indicates the thickening rate. Vertical dashed line marks the formation of lake B. The flow velocities in 1999/2000 and 2005/06 were obtained from aerial photographs (Reference NishimuraNishimura, 2008).
Flow velocity observed at site C2 was significantly higher than that observed near the terminus of alpine glaciers, which is expected to be <10 m a−1 (e.g. Reference Hooke, Calla, Holmlund, Nilsson and StroevenHooke and others, 1989; Reference Iken and TrufferIken and Truffer, 1997; Reference Luckman, Quincey and BevanLuckman and others, 2007). An increase in flow speed down-glacier, towards a calving terminus, has been observed at tidewater glaciers (e.g. Reference Vieli, Funk and BlatterVieli and others, 2000). Reference Motyka, O’Neel, Connor and EchelmeyerMotyka and others (2003) noted that simple shear ice deformation accounts for only 6% of the surface velocity observed near the terminus of Mendenhall Glacier, with the remainder being due to basal sliding. For Rhonegletscher at site C2, glacier motion due to deformation of ice was estimated as 1.4 × 10⁻⁴ m a−1 from the ice thickness and surface slope in 2008 and a rate factor of A = 75 × 10−18 Pa−3 a−1 (Reference Cuffey and PatersonCuffey and Paterson, 2010). This accounts for <0.1% of the observed surface velocity.
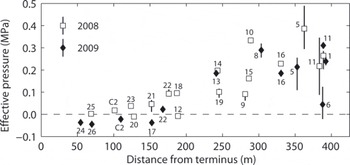
The water level within 300 m of the glacier terminus, including the borehole at site C2, was approximately equal to the lake level (Fig. 9). This implies that the subglacial drainage system over the region was well developed, and that the water level was directly controlled by the lake water. The terminal part of Rhonegletscher has been subjected to high subglacial water pressure, which may increase the basal motion. To examine the hydraulic conditions at the bed, we calculated the effective pressure, P e, defined as
where ρ i = 910 kg m −3 and ρ w = 1000 kg m −3 are the ice and water densities, respectively, g = 9.81 m s−2 is the gravitational acceleration and z w is the borehole water level shown in Figure 9. The glacier bed elevation, z b, was determined by hot-water drilling (Reference Tsutaki and SugiyamaTsutaki and Sugiyama, 2009). The ice surface elevation, z s, was surveyed by GPS on 27 and 31 July 2008, and 12 and 29 July 2009 (Reference Tsutaki, Nishimura, Yoshizawa and SugiyamaTsutaki and others, 2011). The effective pressure approached zero at the boreholes near the terminus (Fig. 11). The effective pressure in 2009 was smaller than that in 2008 over the entire calculated area, due to the reduction in the ice overburden pressure caused by ice thinning (smaller z s). The surface flow speed increases when the effective pressure decreases (e.g. Reference JanssonJansson, 1995; Reference Sugiyama and GudmundssonSugiyama and Gudmundsson, 2004). Based on this relationship between surface speed and effective pressure, we suggest that the observed acceleration of the terminus was driven by a decrease in effective pressure caused by ice thinning and an increase in the lake water level following proglacial lake formation.
Mean effective pressure calculated from the depth and water level of each borehole in 2008 (open squares) and 2009 (diamonds). The vertical lines indicate the range of pressure variation during the measurement periods.
Although the water level in the borehole at site C2 exceeded the flotation level, horizontal flow speed did not increase in 2008 or 2009 (Figs 3 and 4). This observation implies that ice flow near the terminus was controlled by factors in addition to local conditions. The glacier surface is relatively steep in the upper reaches near site 13, in contrast to the flat surface at site C2. Given this topographic transition, longitudinal stress was expected to be exerted from the steeply inclined upper region to the terminus, and such longitudinal stress coupling might have played a key role in the ice dynamics at C2 (e.g. Reference Kamb and EchelmeyerKamb and Echelmeyer, 1986; Reference Cuffey and PatersonCuffey and Paterson, 2010). A bedrock bump exists beneath site C2, and the bed slopes toward the up-glacier direction in the lower reaches from C2 downward (Fig. 9). It is likely that this bedrock geometry inhibited the acceleration of ice near the terminus by exerting back pressure. This hypothesis is supported by the high compressive strain rate observed across C2–24–26.
Dynamic thinning
According to previous studies on Rhonegletscher (Reference Sugiyama, Tsutaki, Nishimura, Blatter, Bauder and FunkSugiyama and others, 2008a; Reference Tsutaki, Nishimura, Yoshizawa and SugiyamaTsutaki and others, 2011), the ice thinning rate has increased since 2000 (Fig. 10). The glacier body near the terminus, except for the region including sites C2–24–26, has been subjected to an extending flow regime along the flowline (Fig. 5c). Ice thinning due to vertical strain was ∼50 mm d−1 across C2–17–22, and 35 mm d−1 across C2–22–23, based on the horizontal strain fields and ice thicknesses on 1 July 2009. Mean melt rates from 6 July to 6 September were 61 mm d−1 across C2–17–22 and 54 mm d−1 across C2–22–23 (Reference Sugiyama, Yoshizawa, Huss, Tsutaki and NishimuraSugiyama and others, 2011). Thus, ice thinning due to vertical straining corresponds to 82% (C2–17–22) and 65% (C2–22–23) of surface ablation. These results suggest that both ice dynamics and ablation contributed to the decreases in ice thickness. The horizontal flow velocity near the terminus increased during the proglacial lake formation, whereas it decreased in the upper reaches as a result of ice thinning. Because of these different responses to ice thinning in the lower and upper regions, the magnitude of the longitudinal stretching increased near the glacier terminus, resulting in an acceleration in ice thinning due to vertical straining. We conclude that the change in flow regime caused by lake formation played a key role in the thinning of Rhonegletscher in the past decade. Acceleration and vertical straining near the terminus result in ice thinning and a decrease in effective pressure, which in turn lead to further glacier acceleration and straining (Reference Vieli, Funk and BlatterVieli and others, 2001; Reference Benn, Hulton and MottramBenn and others, 2007). Such a positive feedback was activated in the terminal part of Rhonegletscher after the formation of lake B.
Flotation and uplift of the terminus in 2009
The vertical motion of the surface at site C2 was downward in 2007, except for a small uplift event on 10–12 August at a rate less than 10 mm d−1 (Fig. 2c). Because the lake surface was below the flotation level at site C2 (e.g. P e = 0.05 MPa on 19 August), we assume that the ice was grounded in 2007. The ice surface began to move upwards when the water level approached the flotation level on 2 August 2008, and this upward ice motion lasted for 12 days (Fig. 3c). The water level was approximately equal to the flotation level around 27 August. These observations indicate that the terminal part of Rhonegletscher was under a floating condition in summer 2008. This condition was met again after 17 July 2009, and resulted in the crevasse formation that accompanied the huge uplift in August. We now discuss the mechanism of this uplift event in 2009, based on the vertical motion observed at sites C2, 17, 24 and 26.
From 3 July to 6 August 2009, significant uplift of the glacier surface was recorded at site 24 (Fig. 6d). Vertical motion of the glacier surface is the result of vertical straining, sliding over an inclined bed and subglacial separation (Reference Hooke, Calla, Holmlund, Nilsson and StroevenHooke and others, 1989). The thickening rate due to vertical straining was −6 and 32 mm d−1 across C2–17–24 and C2–24–26, respectively (Fig. 5c). The bed is inclined upwards in the down-glacier direction at site 24 (Reference Tsutaki, Nishimura, Yoshizawa and SugiyamaTsutaki and others, 2011), but even if sliding accounted for 100% of the surface speed the upward motion generated by sliding along this slope is only 15 mm d−1. Therefore, vertical straining and sliding along the bed cannot explain the observed uplift rate of 58 mm d−1.
The effective pressure reached zero at the shore of lake A and an area including sites 17, 24 and 26 in July 2009 (Fig. 12a). The effective pressure was above zero (0.06 MPa) at the glacier tongue because the bed runs upslope from site 24 to the terminus (Fig. 12b). The location of the peak uplift of the ice margin was examined by determining the bed elevation that would be required for isostatic equilibrium at given ice surface and lake levels, z l (Reference NyeNye, 1976; Reference Sugiyama, Bauder, Huss, Riesen and FunkSugiyama and others, 2008b). This bed elevation is given by
where ![]() is the elevation where the hydraulic potential referenced to the lake surface, z
l, is equal to zero. If
is the elevation where the hydraulic potential referenced to the lake surface, z
l, is equal to zero. If ![]() is higher than the bedrock elevation, the effective pressure at the bed is below zero. In Figure 12b,
is higher than the bedrock elevation, the effective pressure at the bed is below zero. In Figure 12b, ![]() increases from the eastern part to site C2, but decreases from site 24 to the terminus. The distance between sites C2 and 24 is 58 m, but the magnitude of uplift from 3 July to 6 August was ∼1.5 m at site 24, while it was <0.1 m at C2. Reference NyeNye (1976) proposed that when the lake water head reaches the flotation level, a wedge of water would penetrate beneath the grounded ice and lift the ice off its bed, the so-called cantilever effect. He argued that the ice would be subjected to a force that bends the marginal ice upwards because isostatic adjustment is not instantaneous. The large upward motion to the south of the crevasses was caused by a large buoyancy force generated across C2 and 24. Nevertheless, the characteristic length scale estimated by a flexural model with a thickness of 27.3 m and a Young’s modulus for ice of 10 GPa is 550 m, which is far greater than the distance between sites C2 and 24 (Reference Turcotte and SchubertTurcotte and Schubert, 1982; Reference WalderWalder and others, 2006; Reference Sugiyama, Bauder, Huss, Riesen and FunkSugiyama and others, 2008b). Therefore, the flexural model cannot explain the uplift observed at site 24.
increases from the eastern part to site C2, but decreases from site 24 to the terminus. The distance between sites C2 and 24 is 58 m, but the magnitude of uplift from 3 July to 6 August was ∼1.5 m at site 24, while it was <0.1 m at C2. Reference NyeNye (1976) proposed that when the lake water head reaches the flotation level, a wedge of water would penetrate beneath the grounded ice and lift the ice off its bed, the so-called cantilever effect. He argued that the ice would be subjected to a force that bends the marginal ice upwards because isostatic adjustment is not instantaneous. The large upward motion to the south of the crevasses was caused by a large buoyancy force generated across C2 and 24. Nevertheless, the characteristic length scale estimated by a flexural model with a thickness of 27.3 m and a Young’s modulus for ice of 10 GPa is 550 m, which is far greater than the distance between sites C2 and 24 (Reference Turcotte and SchubertTurcotte and Schubert, 1982; Reference WalderWalder and others, 2006; Reference Sugiyama, Bauder, Huss, Riesen and FunkSugiyama and others, 2008b). Therefore, the flexural model cannot explain the uplift observed at site 24.
(a) Contour map of the effective pressure (MPa) in 2009, as defined by Eqn (1). The ice overburden pressure was calculated from the surface and bed digital elevation models. Stake locations are shown as dots and the contour interval is 0.02 MPa. Thick curve indicates the crevassed zone. (b) Vertical cross section of the glacier along line X in (a), showing ice surface (thin black curve) and bottom (thick black curve), lake surface elevation (dashed curve), ice flotation level (grey curve), ![]() as defined by Eqn (2) (dashed-dotted curve), and ridge A. Locations of survey stakes and the twofold vertical displacement from 1 July to 6 August are indicated by the arrows. The grey line depicts the upward bend in the ice generated by the basal crevasses and englacial fractures.
as defined by Eqn (2) (dashed-dotted curve), and ridge A. Locations of survey stakes and the twofold vertical displacement from 1 July to 6 August are indicated by the arrows. The grey line depicts the upward bend in the ice generated by the basal crevasses and englacial fractures.
A plausible interpretation of the large uplift at site 24 from 3 July to 6 August is as follows. When the section between C2 and 24 along line X (Fig. 12a) was submerged to the flotation level, and the ice was floating around site 24, the ice was still grounded near site C2 because the ice was connected to the thicker ice up-glacier. As the resulting stresses exceeded the mechanical strength of the ice, it fractured at the bed and basal crevasses formed between sites C2 and 24. This densely fractured region enabled the marginal ice to bend steeply upward, acting as a hinge. In Figure 12b, ![]() decreases from point A to the eastern (upstream) side of C2. This indicates that the buoyancy force acting on the overlying ice between ridge A (a basal ridge 10 m west of C2) and C2 was much larger than that to the east of C2. The region around the ridge may have been mechanically weak because the ice was thin. Thus, it is likely that basal crevasses and fractures were introduced around ridge A, and that they caused the upward bending of the region between site 24 and the ridge. Similar bending of the marginal ice was observed during the outburst flood from the ice-dammed lake at Gornergletscher, Switzerland (Reference Sugiyama, Bauder, Huss, Riesen and FunkSugiyama and others, 2008b).
decreases from point A to the eastern (upstream) side of C2. This indicates that the buoyancy force acting on the overlying ice between ridge A (a basal ridge 10 m west of C2) and C2 was much larger than that to the east of C2. The region around the ridge may have been mechanically weak because the ice was thin. Thus, it is likely that basal crevasses and fractures were introduced around ridge A, and that they caused the upward bending of the region between site 24 and the ridge. Similar bending of the marginal ice was observed during the outburst flood from the ice-dammed lake at Gornergletscher, Switzerland (Reference Sugiyama, Bauder, Huss, Riesen and FunkSugiyama and others, 2008b).
When the crevasses appeared clearly on the ice surface (6–12 August), the rate of uplift at sites 17 and 26 was greater than that at site 24, and the rate increased as the crevasses opened (Fig. 6a, b and d). If we assume that the marginal ice was afloat in lake A, as a beam connected to the glacier around site C2, the magnitude of the uplift due to the bending motion should reduce from the lake shore towards site C2. The stake motion at sites 17 and 26 during this period is difficult to explain by the upward bending motion of the marginal ice. Thus, we consider the development of a high-angle fault that cut through the terminal part of the glacier, which appeared at the surface on 6 August. When the marginal ice rose, ∼27 July, basal fractures formed at ridge A (Fig. 12b) and extended to the ice surface along a high-angle reverse fault that dipped towards lake A. Accordingly, the marginal ice separated from the glacier body, and floated up as a block along the reverse fault between 6 and 12 August. The upward velocity increase at sites 17 and 26, and decrease at 24, during this period are consistent with this suggestion. A similar interpretation was applied to vertical ice motion observed near an ice-dammed lake at Kennicott Glacier, Alaska, during the lake filling process (Reference WalderWalder and others, 2005, Reference Walder2006).
The ice flow direction near the terminus varied during the period 6–12 August. At sites 17 and 26, for example, the stake motion changed from the southwest to the northwest (Fig. 7). The marginal bedrock upslope of the western part from site 24 (Fig. 12b) may have prevented the marginal ice from flowing in a more westerly direction. This suggests that the floating marginal ice block flowed in the direction of lake A, which coincided with the uplift along the faults.
From October 2009 to October 2010, the terminus disintegrated and the marginal ice detached from the glacier body within ∼80 m of the glacier terminus in 2009 (Fig. 13). Annual length changes of Rhonegletscher given by the Swiss Glacier Monitoring Network (http://glaciology.ethz.ch/swiss-glaciers/) indicate that the rate of terminus retreat during 2010–11 was 50.6 m a−1, although the mean retreat rates during 2000–05 and 2006–10 were 7.6 and 6.0 m a−1, respectively. This is a clear indication of the rapid terminus retreat that occurred 6 years after the formation of the proglacial lake. According to the bed and surface geometries, if the currently observed ice thinning continues, basal water pressure will approach the ice overburden pressure over an area extending 300–400 m up from the glacier terminus within 10 years. This will cause the glacier to progressively disintegrate through the processes detailed here. According to the bed topography (Reference Tsutaki, Nishimura, Yoshizawa and SugiyamaTsutaki and others, 2011), we predict that if the proglacial lake continues to expand up-glacier, it will extend ∼1 km from the current terminus as the glacier retreats.
Photographs showing the terminus of Rhonegletscher on (a) 11 October 2009 and (b) 11 October 2010.
Conclusions
In this study, we have measured and interpreted changes in the ice motion and subglacial water pressure during the formation of a proglacial lake in Rhonegletscher. Measurements of the flow speed and vertical motion of the terminal part of the glacier were made at a high spatial resolution during the summer seasons of 2007–09. The surface flow speed near the terminus was relatively high, and its magnitude was similar to the velocity measured 550 m up-glacier. The annual flow velocity near the terminus increased by a factor of 2.7 from 2005/06 to 2007/08. In the upper reaches, the velocity decreased by 7% during the same period. In 2008 and 2009, subglacial water pressure exceeded ice overburden pressure in an area up to ∼200 m from the terminus. These observations strongly suggest that the elevated subglacial water pressure enhanced the basal ice motion near the glacier terminus. The spatial distribution of strain rates clearly showed a stretching flow regime near the glacier terminus. Vertical compression due to this flow regime contributed to accelerated ice thinning after the lake formed.
An extraordinarily large surface uplift was observed at the terminus in 2009, when the subglacial water pressure exceeded the ice overburden pressure. Associated with this uplift event, crevasses formed along the lake shore. Before the crevasses formed, surface uplift occurred due to lake water penetrating beneath the marginal ice and incrementally lifting the ice off its bed. After formation of the crevasse, the marginal ice was thrust upwards as a block along a steeply dipping fault. This marginal ice then floated on the lake, before being detached from the glacier in the following summer. Our observations demonstrate that a rapid terminus retreat can occur in a short period during lake formation, and this period was only 6 years in the case of Rhonegletscher.
Acknowledgements
We thank T. Yoshizawa, H. Blatter, A. Bauder, T. Wyder, A. Keller, G. Turi and F. Lehner for help in the field. Materials for the field campaign were loaned by the Section for Glaciology, VAW, ETH Zürich. We thank A. Vieli and J. Amundson for providing thorough reviews, and the scientific editor, B. Kulessa, for careful handling of the manuscript. K. Fujita and A. Sakai provided helpful comments on the manuscript. This research was funded by JSPS KAKENHI grant No. 18840002, 20540418 and 23403006. Additional funding was provided by the Inoue Scientific Field Study Foundation, and by the Global COE Program (Establishment of Centre for Integrated Field Environmental Science), MEXT, Japan. The Swiss National Science Foundation (SNF) is acknowledged for support.


