

INTRODUCTION
Semi-continuous dependent variables have long been a challenging modelling problem associated with disaggregated data sets. The most common occurrences are found in consumption and production data. Regarding consumption, households typically do not purchase all the goods being evaluated in every time period, resulting in observed zero values with positive probability. Similarly, a study evaluating the number of defects in a given production process is likely to have outcomes with no defects, leading to a high proportion of observed zeros. In both cases, ordinary least squares parameter estimates will be biased when applied to these types of data (Amemiya Reference Amemiya1984).
Tobin (Reference Tobin1958) was the first to recognize this bias and offered a solution that is still quite popular today. However, the assumption of normality of the underlying latent variable has made the Tobit model inflexible to data generating processes outside of that major distribution (Bera et al. Reference Bera, Jarque and Lee1984). Additionally, Arabmazar & Schmidt (Reference Arabmazar and Schmidt1982) demonstrated that random variables modelled by the Tobit model contain substantial bias when the true underlying distribution is non-normal and has a high degree of censoring. The Tobit model has been generalized to allow variables to influence the probability of a non-zero value and the non-zero value itself as two separate processes (Cragg Reference Cragg1971; Jones Reference Jones1989), which are commonly referred to as the Hurdle and double-Hurdle models, respectively (another model that allows for decisions or production output processes to be characterized as a two-step process is the zero-inflated class of models).
The univariate Tobit model is extended, under a set of mild assumptions, to include multivariate settings (Amemiya Reference Amemiya1974; Lee Reference Lee, Maddala, Rao and Vinod1993). While empirical applications in univariate settings are discussed by Amemiya (Reference Amemiya1984), multivariate applications are becoming more frequent (Cornick et al. Reference Cornick, Cox and Gould1994; Chavas & Kim Reference Chavas and Kim2004; Eiswerth & Shonkwiler Reference Eiswerth and Shonkwiler2006; Belasco et al. Reference Belasco, Ghosh and Goodwin2009a). Shonkwiler & Yen (Reference Shonkwiler and Yen1999) provide a more general procedure to consistently estimate a system of equations under fewer restrictions than the multivariate Tobit model. However, in their proposed model, parameter estimates and standard errors are not systematically estimated, nor are cross-correlation between equations or heteroskedasticity explicitly modelled. An alternative that allows for more distributional flexibility was first derived by Duan et al. (Reference Duan, Manning, Morris and Newhouse1983) who, in an evaluation of medical expenses, assumed a two-step process where a decision is first made regarding positive expenses, followed by a second decision about how much to spend, conditional on a positive amount of expenses.
The present study considers the use of a mixture model that extends Duan et al. (Reference Duan, Manning, Morris and Newhouse1983) to characterize semi-continuous dependent variables, in univariate and multivariate situations. This model will be shown to nest the Tobit model, while major advantages include the flexibility in distributional assumptions and an increased efficiency in situations involving a high proportion of zero values. Additionally, the multivariate version allows for an explicit characterization of the dependence between the semi-continuous and continuous dependent variables. For the empirical study, a semi-continuous log-normal mixture (SLNM) regression model is derived from a generalized mixture regression model. A comprehensive dataset is used that includes proprietary cost and production data from five cattle feedlots in Kansas and Nebraska, amounting to 11 397 pens of cattle during a 10-year period. Cattle mortality rates (MORT) on a feedlot provide valuable insights into the profitability and performance of cattle on feed. Additionally, it is hypothesized that cattle MORT are more accurately characterized with an SLNM regression model that takes into account the positive skewness of MORT, as well as allowing observations from discrete and continuous portions of the semi-continuous distribution to be modelled separately. In both univariate and multivariate situations, the proposed SLNM regression model more efficiently characterizes the observed features of the data. The objective of the present research is to develop an alternative strategy to modelling semi-continuous data that can more effectively characterize cattle MORT alone as part of a system of equations that includes indicators of cattle productivity.
Section 2 develops a generalized mixture regression model that is specified with a log–normal distribution and is used for estimation in the present research. The univariate model precedes the development of a multivariate model. Repeated simulations are used to evaluate the penalty, in terms of in-sample and out-of-sample model fit, of assuming the wrong model. Next, the proposed model is applied to evaluate data from commercial cattle feedlots in Kansas and Nebraska. Comparisons between the Tobit and mixture regression model are assessed through model fit, prediction power and parameter estimates using both univariate and multivariate models using simulated and empirical data. The final section provides the implications of the study and avenues for future research.
MATERIALS AND METHODS
A semi-continuous variable Y is assumed that can take on the value of zero with a positive probability or a positive value and is conditional on variables contained in X. Shonkwiler & Yen (Reference Shonkwiler and Yen1999) assume the following set of equations:
where the residual errors ε i's and νi's are distributed according to a bivariate normal. The binary-valued variables W i's measure the probability of zero or positive outcomes, which are commonly characterized in the literature using a Bernoulli variable. Then, the positive outcomes are modelled separately as realizations of positive valued random variables V i. The regression parameters β and γ are vectors that include marginal impacts to both W i and V i, respectively. Duan et al. (Reference Duan, Manning, Morris and Newhouse1983) make a slight modification to Eqn (1) to make it a conditional regression with a logged dependent variable in order to account for positive skewness. This flexibility comes from the fact that the likelihood function is multiplicatively separable and ε and ν do not rely on independence or distributional assumptions. Since Shonkwiler & Yen (Reference Shonkwiler and Yen1999) use an unconditional response in the second step, the residuals in Eqns (1) and (2) are assumed to be from a bivariate normal distribution.
A major difference between the mixture and Tobit model is that the parameters of the distribution of the unobservable censored observations are modelled separately. The probability density function of the semi-continuous random variable Y can be expressed as follows:
where g(y|θ) is a probability density function satisfying ![]() and ρ(θ)∈[0, 1]∀θ. This is equivalent to the fact that W∼Ber(ρ(θ)) and V∼g(y|θ), where W and V are assumed to be independent and Y=WV. This formulation includes the standard univariate Tobit model when θ=(μ, σ), ρ(θ)=Φ(μ/σ), and
and ρ(θ)∈[0, 1]∀θ. This is equivalent to the fact that W∼Ber(ρ(θ)) and V∼g(y|θ), where W and V are assumed to be independent and Y=WV. This formulation includes the standard univariate Tobit model when θ=(μ, σ), ρ(θ)=Φ(μ/σ), and
where ϕ(·) and Φ(·), respectively, denote the density and distribution functions of a standard normal distribution. Note that in the log–normal specification to follow, ρ is modelled separately, using a set of parameters that may or may not be used to parameterize the mean and variance of V, making it more flexible than the Tobit model. The above formulation includes the models proposed by Shonkwiler & Yen (Reference Shonkwiler and Yen1999) and that of Duan et al. (Reference Duan, Manning, Morris and Newhouse1983), if dependence between W and V is allowed. Their models have been extended in the present paper by allowing the residual errors to depend on the predictors X i's to capture the possible heteroskadasticity.
Next, a univariate mixture regression model is developed that includes predictor variables, which then can be extended to allow for multivariate cases. Since only the positive outcomes were modelled through the second component, the natural log of the dependent variable was used. In most cases, taking the natural log of this variable works to make the dependent variable that was originally positively skewed approximately symmetrical, in addition to approximately stabilizing the variance. Using a log–normal distribution for the random variable V and allowing ρ to vary based on the conditioning variables, the basic mixture regression model can be transformed into the following form that can be generalized to include continuous distributions. First, the normal distribution is derived to model the logarithm of the positive-valued dependent variable outcomes, also known as the log–normal distribution, of the following form:
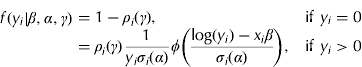
where ϕ(·) denotes the probability density function of a standard normal distribution with mean zero and variance unity; β, α and γ are (Kx1) vectors of regression coefficients; x i is a (1×K) vector of predictor variables; ρ i(γ)=1/(1+exp(x iγ)) is the logit link function and σ i2(α)=exp(x iα) is the conditional variance that guarantees σ i2>0 and ρ i∈(0, 1)∀i. K is equal to the number of conditioning predictor variables or covariates. Note that this specification is nested within the generalized version in Eqn (3), where g(y|θ) is a log–normal distribution and θ=(γ, β, α). This model will be denoted by SLNM (ρ, μ, σ 2), where ρ denotes the link function (e.g. logit, probit, etc.), μ denotes the mean function on the logarithmic scale and σ 2 denotes the variance function on the logarithmic scale of the positive part of the dependent variable. Other candidate distributions for V's were also assessed, including the Gamma and normal distributions, but were found to be inferior in terms of model fit and prediction accuracy for the present datasets.
To model multiple dependent variables in a way that captures the cross-correlation between the response variables, the well-known relationship between the joint and conditional marginal densities was used. More specifically, the well-known decomposition of a joint density function was used as the product of conditional and marginal densities; f(y 1, y 2)=f(y 1|y 2)× f(y 2) (Casella & Berger Reference Casella and Berger2001) to capture the dependence between Y 1 and Y 2, where Y 1 is a semi-continuous variable that has a positive probability of taking on the value of 0 and Y 2 contains the remaining vectors of continuous dependent variables. In this case, f(y 1, y 2) denotes the joint density function of (Y 1, Y 2), f (y 1|y 2) is the conditional density of Y 1, given Y 2, and f(y 2) is the marginal (joint) density of the random vector Y 2. However, this model restricts Y 1 to be one dimensional under its current formulation. As a possible extension of the proposed univariate model for the semi-continuous variable Y, the model can be represented as Y 1=V(Y 2)W, where W is a binary random variable and V(Y 2) is a continuous positive-valued random variable, whose distribution depends on Y 2. Finally, each vector in Y 2 assumes a conditionally specified distribution.
Firstly, Z 2i=log(Y 2i) (where the natural logarithm is taken with respect to each component of the vector Y 2i) is parameterized, which will be distributed as a multivariate normal, with mean vector, x iB (2) and variance matrix, Σ22i, allowing the model to be heteroskedastic. B (2) is (K×(J−C)) and Σ22i is (J−C)×(J−C), where J is equal to the number of dependent variables in the multivariate model and C is the number of semi-continuous dependent variables each taking the value 0 with positive probability. The assumption of log–normality is often made due to the ease with which a multivariate log–normal can be computed and its ability to account for skewness. This distribution can be expressed as Z 2i∼N(x iB (2), Σ22i), where Z 2i is a ((J−C)×1)-dimensional vector of outcomes. This formulation, similar to the univariate case, allows for the use of separate parameters for the binary variables and positive-valued continuous part in addition to capturing the heteroskadasticity.
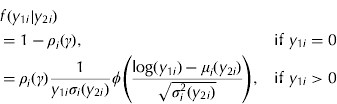
The conditional probability of Y 1 given Y 2 is modelled through a mixture of modelling mechanisms that take into account the realizations from Y 2 such that Y 1i|Y 2i=y 2i∼SLNM(ρ i, μ i(y 2i), σ i2 145 (y 2i)), where SLNM is as defined earlier. More specifically, ![]() and
and ![]() where B (1) is (K×C). The covariance matrix Σi can be divided into the following components, where Σ11i refers to the covariance matrix of semi-continuous variables, Σ22i refers to the covariance matrix of continuous variables, while Σ12i and Σ21i measure the cross-covariances between the two components, at observation i. (One must be careful in specifying the submatrices within Σi to make sure that for any observed value of the predictors X i's the full J×J matrix Σi is a positive-definite (p.d.) matrix for each i)
where B (1) is (K×C). The covariance matrix Σi can be divided into the following components, where Σ11i refers to the covariance matrix of semi-continuous variables, Σ22i refers to the covariance matrix of continuous variables, while Σ12i and Σ21i measure the cross-covariances between the two components, at observation i. (One must be careful in specifying the submatrices within Σi to make sure that for any observed value of the predictors X i's the full J×J matrix Σi is a positive-definite (p.d.) matrix for each i)
When C=1, this leads to the following conditional probability density function for Y 1i given Y 2i=y 2i:
Ghosh et al. (Reference Ghosh, Mukhopadhyay and Lu2006) demonstrate through simulation studies that similar models have better finite sample performance with tighter interval estimates when using Bayesian procedures instead of classical maximum likelihood methods. Due to these advantages, the previously developed models will use recently developed Bayesian techniques. In order to develop a Bayesian model, the sampling distribution is weighted by prior distributions. The likelihood function L(·) is proportional to the sampling density f(·), where the proportionality constant is allowed to be a function of the observed data, such that L(θ, y)∝f(y|θ), where θ represents the collection of all parameters, which for the present purposes will include θ=(β, α, γ) in the case of a univariate response variable. While prior assumptions can have some effects in small samples, this influence is known to diminish with larger sample sizes (by the use of well-known Bernstein–von Mises theorem). Additionally, prior assumptions can be uninformative in order to minimize any effects in small samples (Kaas & Wasserman Reference Kaas and Wasserman1996). For each parameter in the model, the following vague normal prior is assumed, where θ∼N(0, Λ) such that θ={(β kj, α kj, γ kc) for k=1, …, K, j=1, …, J, and c=1, …, C} and Λ is a known matrix of dimension m×m, where m=K(2J+C). The given formulation applies to univariate versions when J=1 and C=1. Additionally, the diagonal elements of Λ can be chosen large enough to make the prior relatively uninformative.
Given the preceding specifications of a sampling density and prior distributions, a full hierarchical Bayesian model can be easily developed in principle. However, due to the difficulty in deriving the posterior distribution of the high-dimensional parameter θ analytically, Markov Chain Monte Carlo (MCMC) methods are used to obtain samples from the posterior distribution of θ using the WinBUGS programming software. MCMC methods allow for the computation of posterior estimates of parameters through the use of MC simulation based on Markov chains from a posterior distribution with the posterior distribution as its stationary distribution. The draws arise from a Markov chain since each draw depends only on the last draw, which satisfies the Markov property. As the posterior density being the stationary distribution of such a chain, the samples obtained from the chain are approximately generated from the posterior distribution following a burn-in of initial draws, i.e. samples are retained after discarding few initial samples with the assumption that the latter samples are drawn from the stationary distribution of the Markov chain.
Bayesian point and interval estimates are computed by using the empirical summaries of the MCMC samples generated from the posterior distribution. In a Bayesian framework, interval estimates are typically computed using the highest posterior density region, which will be different from a classical confidence interval when posterior distributions are bi-modal or asymmetric. As long as posterior estimates do not show bi-modal attributes, the interval between the 2·5 and 97·5 percentiles can be taken to test whether the variable is significantly different from zero. Since multiple chains are usually used in Bayesian analysis, the potential scale reduction factor, or ![]() , measure developed in Brooks & Gelman (Reference Brooks and Gelman1998) is popularly used to monitor convergence. This measure essentially uses scaled ratios between pooled and within variances of the multiple chains so that when
, measure developed in Brooks & Gelman (Reference Brooks and Gelman1998) is popularly used to monitor convergence. This measure essentially uses scaled ratios between pooled and within variances of the multiple chains so that when ![]() , it can be concluded that all chains have mixed well despite different multiple starting values and have been generated from the same target distribution.
, it can be concluded that all chains have mixed well despite different multiple starting values and have been generated from the same target distribution.
It should be noted that the well-known identifiability problem of mixture models due to label switching of the indexes of the mixture components does not occur for the proposed models as Y is a mixture of a {0, 1} valued random variable (W) and a continuous random variable (V). In fact, the parameter vector γ can easily be estimated (and hence identified) using the observed indicators W i=I(Y i>0) and the predictor variables (x i) using a logistic regression model. Further, the remaining components of vector θ (excluding γ) can be estimated by creating a subset of data Y i=V iWi using only those observation i's for which Y i>0. Thus, the parameters γ and remaining components of θ can be estimated using a sequence of logistic model and a likelihood based on V i's as defined above.
Predictive values within a Bayesian framework arise from the posterior predictive distributions, which is distinctly different from classical theory that uses a conditional predictive density obtained by plugging in the estimated parameter in the sampling density and thus ignoring the uncertainty of the conditional density. A Bayesian posterior predictive density, however, is obtained by integrating out the sampling density (i.e. the conditional density of data given the parameters) with respect to the posterior density. In the SLNM model, predicted values will be the product of two posterior mean estimates. MCMC methods allow sampling from the posterior density function that combines both the prior distributional information and the sampling distribution (likelihood function). Formally, prediction in the SLNM model is characterized by ![]() where v i and w i are generated from their predictive distributions. log(v i) is from a normal distribution with mean
where v i and w i are generated from their predictive distributions. log(v i) is from a normal distribution with mean ![]() and variance
and variance ![]() while w i is from a Bernoulli distribution with parameter ρ i(
while w i is from a Bernoulli distribution with parameter ρ i(![]() ), where
), where ![]() ,
, ![]() and
and ![]() are MCMC draws from their posterior distributions, where x i represents a vector of predictor variables at which prediction values are desired. Since many draws from a Bernoulli distribution will result in 0 and 1 outcomes, the mean will lie between zero and unity. To allow for prediction of both zero and positive values, the median of the Bernoulli draws was used for prediction. This allows for observations to fully take on the continuous random variable if more than half of the time it was modelled to do so, while those that are more likely to take on zero values, as indicated by the Bernoulli outcomes, take on a zero value.
are MCMC draws from their posterior distributions, where x i represents a vector of predictor variables at which prediction values are desired. Since many draws from a Bernoulli distribution will result in 0 and 1 outcomes, the mean will lie between zero and unity. To allow for prediction of both zero and positive values, the median of the Bernoulli draws was used for prediction. This allows for observations to fully take on the continuous random variable if more than half of the time it was modelled to do so, while those that are more likely to take on zero values, as indicated by the Bernoulli outcomes, take on a zero value.
In order to assess the predictive performance of the model, a randomly selected two-thirds of the observed data set is used for estimation, while the remaining one-third is used for prediction, allowing both model fit measures and out-of-sample predictive power performance to be tested. In the present study, estimations based on a Tobit regression also incorporate Bayesian estimation techniques. To compare in-sample measures of model fit, the deviance information criteria (DIC) (Spiegelhalter et al. Reference Spiegelhalter, Best, Carlin and van der Linde2002), which is similar to its frequentist counterpart, Akaike's Information Criteria (Akaike Reference Akaike1974) in which smaller values indicate improved model fit, is used.
To measure the out-of-sample predictive power within a modelling strategy, the mean squared prediction error (MSPE) associated with the final third of randomly selected data is computed. MSPE is formulated as ![]() where M is some proportion of the full data sample, such that M=[n/b]. For the present purposes b=3, which allows for prediction on the remaining third, based on estimates from the first two-thirds. This allows for a sufficient amount of observations available for estimation and prediction. MSPE is then decomposed into error due to central tendency (ECT), error due to regression (ER) and error due to disturbances (ED), based on Bibby & Toutenburg (Reference Bibby and Toutenburg1977). The parameters are estimated based on the simulated dataset, given the above specifications. MCMC sampling is used for Bayesian estimation with a burn-in of 1000 iterations for the SLNM model and 20 000 for the Tobit model. After discarding the burn-in samples, another 10 000 iterations are used with a thin rate of 15 for univariate estimation with three parallel Markov chains. Multivariate simulations make use of 6000 samples on a single Markov chain. The numbers of burn-in and sample iterations were selected based on closely monitoring
where M is some proportion of the full data sample, such that M=[n/b]. For the present purposes b=3, which allows for prediction on the remaining third, based on estimates from the first two-thirds. This allows for a sufficient amount of observations available for estimation and prediction. MSPE is then decomposed into error due to central tendency (ECT), error due to regression (ER) and error due to disturbances (ED), based on Bibby & Toutenburg (Reference Bibby and Toutenburg1977). The parameters are estimated based on the simulated dataset, given the above specifications. MCMC sampling is used for Bayesian estimation with a burn-in of 1000 iterations for the SLNM model and 20 000 for the Tobit model. After discarding the burn-in samples, another 10 000 iterations are used with a thin rate of 15 for univariate estimation with three parallel Markov chains. Multivariate simulations make use of 6000 samples on a single Markov chain. The numbers of burn-in and sample iterations were selected based on closely monitoring ![]() , based on Brooks & Gelman (Reference Brooks and Gelman1998). The burn-in rate was substantially higher with the Tobit model than the SLNM model, as a few parameter estimates took particularly long to converge.
, based on Brooks & Gelman (Reference Brooks and Gelman1998). The burn-in rate was substantially higher with the Tobit model than the SLNM model, as a few parameter estimates took particularly long to converge.
A SIMULATION STUDY COMPARING MODELLING PERFORMANCES
This section focuses on simulating data in order to compare the goodness-of-fit for the two previously specified models. The major advantage of evaluating model performances using a simulated set 245 of data is that the true form of the data generation process is known, which is generally not possible with real data sets. Various goodness-of-fit criteria are evaluated to compare the performance of a given models when the data are generated either from the same model (e.g. Tobit) or from another model (e.g. SLNM). These simulated data scenarios allow evaluation of the extent of bias induced by fitting a model to a data set that is generated from possibly a different model.
In simulating data, there are three key characteristics that align the simulated data set with the cattle production data set to be used in the empirical study, which include heteroskedastic errors (Belasco et al. Reference Belasco, Ghosh and Goodwin2009a), a degree of censoring around 0·50 and positive skewness. Data are repeatedly simulated based on samples sizes of 200, 500 and 1000. The first simulated model will be a heteroskedastic Tobit model, which fundamentally assumes a normally distributed latent variable, y* such that, y i*=β 0+β 1x1i+ε i and the dependent variable y i=max(y i*, 0) can be observed. In order to account for heteroskedasticity, ε i∼N(0, σ i2) is assumed, where σ i2=exp(α 0+α 1x1i).
In this scenario, the censored and uncensored variables (or continuous and discrete portions of the semi-continuous distribution) come from the same data generation process. Simulated values are based on (β 0, β 1)=(−3·0, 1·0) and (α 0, α 1)=(2·0, 0·2) where starting seeds are set in order to replicate results. For each sample size, values for x i are generated randomly based on a uniform distribution bounded at 1 and 5. For the above set of selected values of the parameters, the percentage of observed zeros these simulated data sets ranged from 0·45 to 0·55. In order to compute the sampling variation of the estimates over 10 repetitions, Monte Carlo standard errors (MCSEs) are reported. More precisely, the sampling variation of an estimator ![]() can be measured by
can be measured by ![]() , where
, where ![]() is the estimate obtained from the jth repetition and N denotes the number of MC repetitions. For all data generation scenarios, we performed N=10 MC repetitions.
is the estimate obtained from the jth repetition and N denotes the number of MC repetitions. For all data generation scenarios, we performed N=10 MC repetitions.
As an alternative to the preceding simulation scenario, data were also generated from an SLNM model. The major distinctions between this simulation and the previously developed Tobit-based data set are that the probability of a censored outcome is modelled separately and that the latent variable is positively skewed. For this SLNM model, the following values of the parameters were selected: (β 0, β 1)=(−1·5, 0·5), (γ 0, γ 1)=(−5·0, 1·7) and (α 0, α 1)=(2·0, 0·2). The proportion of observed zeros in this second scenario also ranged from 0·45 to 0·55, similar to the first scenario.
Results from simulations based on a Tobit regression and an SLNM regression are reported in Table 1. As expected, the performance of a correctly specified model is better than that of the wrong model. Lower MSPE indicates that the prediction of the out-of-sample portion of the data set favours that of the true model at all sample levels. MSPE penalizes observations with large residuals that tend to be more prevalent as the dependent variable value increases. Gurmu & Trivedi (Reference Gurmu and Trivedi1996) point out that mixture models tend to over-fit data. By over-fitting the data, model fit tests might improve while prediction remains less accurate. The Tobit model could outperform the SLNM due to the lack of positive skewness or the loss in degrees of freedom from irrelevant variables as part of the two-step process. However, a semi-continuous normal mixture model was also used and while the performance was superior to the SLNM, it still did not outperform the Tobit.
Model comparison based on data simulated from univariate Tobit and SLNM models (n=10)
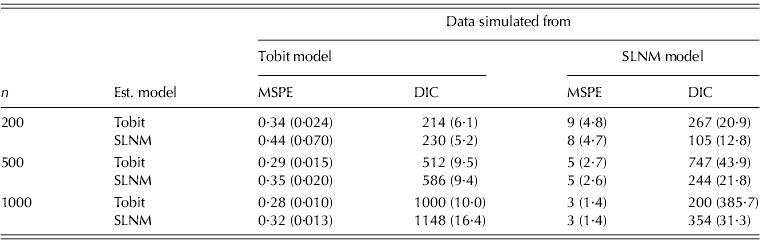
Note: MCSEs are reported in parentheses.
When data are generated from an SLNM model, the results indicate a superior model fit with the assumed model, relative to the Tobit model and a substantially lower MSPE, indicating better out-of-sample prediction performance, partially due to its ability to account for positive skewness. When the sample size is n=500, the relative loss (in terms of having lower DIC) by fitting an SLNM to data sets generated by a Tobit model is c. 0·14 ((586·331−512·361)/512·361) only, whereas the relative loss of fitting a Tobit model to data sets generated from an SLNM is 2·06 ((747·034− 244·106)/244·106). However, the relative loss (in terms of having lower MSPE) was about the same for each incorrectly assumed model. Thus, although by fitting an SLNM to Tobit-generated data sets DIC might be reduced there is a much larger loss in model fit when a Tobit is incorrectly assumed.
While univariate censored data are widely used in empirical studies, multivariate censored data are not as widely utilized, despite having many applications in production and agricultural economics. For this reason, it is important to simulate a multivariate data set that comes from both a Tobit and a multivariate version of the SLNM model. The Tobit model is constructed by first generating latent vectors (Y*1i, Y*2i) from a bivariate normal distribution with mean vector (β 11+β 12xi, β 21+β 22xi) and logarithm of the variance vector (α 11+α 12xi, α 21+α 22xi) and a fixed covariance of 0·6 for all i=1, …, n. The dependent variables are generated by setting Y 1i=Y*1i for all i and Y 2i=max(0, Y*2i), and thus only Y 2 values are censored at zero whereas Y 1 has a continuous distribution. The true value of the parameters were set at β=(0·0, 4·0; −1·5, 0·5), α=(1·5, 0·5; 2·0, 0·2), and covariance off-diagonal element, t 12=0·6. As in the univariate case, a second scenario was also generated which consisted of generating data from the multivariate extension of the SLNM, and the same parameter values were used as in the bivariate Tobit model with the additional parameter set at γ=(−5·0, 1·7). As in the bivariate Tobit model, Y 1 was set as a fully continuous variable, while Y 2 was semi-continuous with censoring in nearly half of its observations.
The results based on generating data from a bivariate Tobit model are shown in Table 2. It is not surprising to note that correct model specification matters in terms of within-sample fit, as DIC is lower when the assumed model matches the simulated model. The SLNM demonstrates an improved advantage (in terms of lower MSPE) when using the multivariate model and the assumed model is correct. This is probably because the ability to predict Y 2 is improved substantially in the SLNM from the use of a conditional distribution. Given the present hypothesis that cattle MORT are more accurately characterized from an SLNM model, it might be assumed that within-sample fit might be stronger than with the Tobit, while prediction improves marginally.
Model comparison based on data simulated from multivariate Tobit and SLNM models (n=10)

Note: MCSEs are reported in parentheses.
AN APPLICATION TO CATTLE PRODUCTION YIELDS
This section applies the preceding models to cattle production risk variables. The proposed SLNM regression model is hypothesized to characterize semi-continuous cattle MORT better than the Tobit model because of the flexibility of modelling the two components of the MORT distribution using a separate set of parameters. In the previous section, repeated simulations were used to mimic this type of data, which is characterized by heteroskedastic errors, a high degree of censoring and a system with cross-equation correlation. Results from such MC simulations demonstrate the power of the proposed SLNM model to fit data generated based on itself and the Tobit model as well, in both univariate and multivariate situations.
Past research has focused on modelling agricultural yields, while research dealing specifically with semi-continuous valued yields is limited. The main reason for the lack of research into censored yields is because crop yields are not typically censored at upper or lower bounds. However, with the emergence of new livestock insurance products, new yield measures must be quantified in order for risks to be properly identified. In contrast to crop yield densities, yield measures for cattle health possess positive skewness, such as the MORT and veterinary costs. Crop yield densities typically possess a degree of negative skewness as plants are biologically limited upward by a maximum yield, but can be negatively influenced by adverse weather, such as drought. Variables such as mortality have a lower limit of zero, but can rise quickly in times of adverse weather, such as prolonged winter storms or disease.
Cattle MORT are hypothesized to follow a two-step process because pens tend to come from the same, or nearby, producers and are relatively homogeneous. Therefore, a single mortality can be seen as a sign that a pen is more prone to sickness or disease and may distinguish a ‘healthy’ pen from an ‘unhealthy’ pen. Additionally, airborne illnesses are contagious and can be spread rather quickly throughout the pen. Other variables that describe cattle production performance are introduced and evaluated using the previously developed multivariate framework. These variables include dry matter feed conversion (DMFC), which is measured as the average kg of feed a pen of cattle require to add 1 kg of weight gain; average daily gain (ADG), which is the average daily weight gain (kg) per head of cattle; and veterinary costs per head (VCPH), which is the amount of VCPH that are incurred over the feedlot stay.
Cattle MORT from commercial feedlots are of particular interest due to their importance in cattle feeding profits. Typically, MORT are zero or small, but can rise significantly during adverse weather, illness or disease. The data used in the present study consist of five commercial feedlots residing in Kansas and Nebraska, and include entry and exit characteristics of 11 397 pens of cattle at these feedlots from 1996 to 2005. Of the five feedlots, two are closely located to one another in Kansas, while the remaining are located in close proximity to each other within Nebraska. Preliminary analysis suggested the use of aggregating feedlots into two clusters that are distinguished by state. The data did not exhibit any time trends or structural breaks in dependent variables (ADG, DMFC, MORT and VCPH) over the 10 years. Independent variables are also included that are hypothesized to impact on the mean and variance of the dependent variables. Independent variables included in the present study include entry weight (InWt) and categorical variables to indicate gender (steers, heifers and mixed); whether the pen was placed in a Kansas feedlot (Kansas) as opposed to a feedlot in Nebraska; and season of placement in order to indicate whether the pen was placed on a feedlot between December–February (Winter), March–May (Spring), June–August (Summer) or September–November (Autumn). Table 3 presents a summary of characteristics for different levels of MORT, including no mortalities.
Mean comparison of pens using average values of both dependent and predictor variables with differing mortality losses
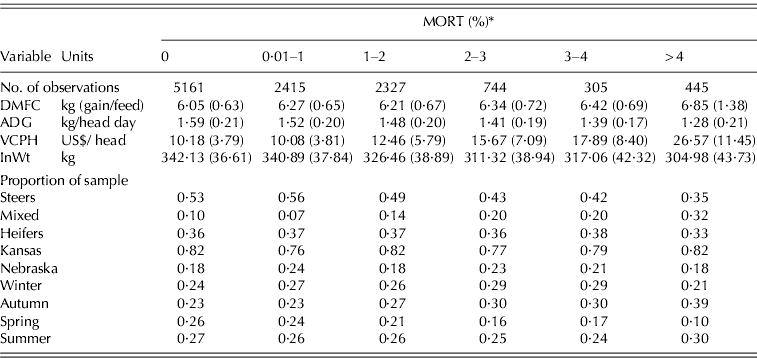
* Note: A MORT that results in a whole number is placed into the higher bins (i.e. 3·00% is placed in 3–4 bin). Standard errors are in parentheses.
DMFC, dry matter feed conversion; ADG, average daily gain; VCPH, veterinary costs per head.
Particular attention will be placed on whether zero or positive MORT can be strongly determined based on the data at hand. The degree of censoring in this sample is 0·46, implying that almost half of the observations contain no mortality losses. There is strong evidence that MORT are related to the previously mentioned conditioning variables, but whether censored mortality observations are systematically different from observed positive values must be determined. Positive MORT may be a sign of poor genetics coming from a particular breeder or sickness picked up within the herd. The assumption is that the cattle within the pen are quite homogeneous. Homogeneity within the herd is desirable as it allows for easier transport, uniform feeding rations, medical attention and the amount of time on feed. If homogeneity within the herd holds, then pens that have mortalities can be defined as a distinct type that is separate from those with no mortalities.
However, mortalities may also occur without warning and for unknown reasons. Glock & DeGroot (Reference Glock and DeGroot1998) report that 0·40 of all cattle mortalities in a Nebraska feedlot study were directly caused by sudden death syndrome. Glock & DeGroot (Reference Glock and DeGroot1998) loosely define sudden death as any case where feedlot cattle are found dead unexpectedly, but they also point out that these deaths were without warning, which could be due to a ‘sudden death’ or lack of observation by the feedlot workers. Smith (Reference Smith1998) also reports that respiratory disease and digestive disorders are responsible for c. 0·44 and 0·25 of all mortalities, respectively. The high degree of correlation between dependent variables certainly indicates that lower MORT can be associated with different performance in the pen. However, the question in the present study will be whether positive MORT significantly alter the performance. For this reason, additional parameters were estimated to examine the likelihood of a positive mortality outcome in the mixture regression model.
A recent study by Belasco et al. (Reference Belasco, Taylor, Goodwin and Schroeder2009b) found that the mean and variance of MORT in cattle feedlots are influenced by entry-level characteristics such as location of the feedlot, placement weight, season of placement and gender, all of which are used in the present study. The influence of these parameters will be estimated using the previously formulated models, based on two-thirds of the randomly selected data set where n=7598. The remaining portion of the data set, m=3799, will be used to test out-of-sample prediction accuracy. Predictive accuracy is important in existing crop insurance programmes, where past performance is used to derive predictive density functions for current contracts.
ESTIMATION RESULTS
The results from using a univariate Bayesian Tobit model with heteroskedastic errors to model cattle MORT are shown in Table 4. Tobit estimates for β measure the marginal impact of changes in the conditional variables on the latent MORT (Y*). To measure the approximate marginal impact on the observed MORT (Y), the following relationship from Greene (Reference Greene2008) is used, where dE[y i|xi]/dx ki=β k×Pr(y i*>0). For example, the coefficient corresponding to in-weight states that a one-unit increase in logarithm of the entry weight decreases the observed MORT by 1·7% (=3·9%×0·54). The estimates for α measure the relative impact on the variance, since α k=(dσ i2/dx k)(1/σ i2). For example, the estimated coefficient corresponding to autumn implies that a pen placed in the autumn months is associated with a variance that is 40·7% lower than pens placed in summer months.
Estimates of fed cattle mortality parameters based on a univariate Tobit and SLNM models

* Standard deviations (s.d.) are reported for continuous variables, while standard error differences (s.e.d.) are used for all categorical variables.
† MSPE is decomposed into ECT, ER and ED (Bibby & Toutenburg Reference Bibby and Toutenburg1977).
‡ Proportion of error.
NS: not significant at P<0·05.
Next, the same set of data is estimated using the previously developed SLNM model in order to test the hypothesis that they will have a better fit. Results from the SLNM model are also shown in Table 4. Parameter estimates in the SLNM model refer to two distinct processes. The first process includes the likelihood of a zero outcome or one described by a log-normal distribution. Based on this formulation, the parameter estimates for γ can be expressed as the negative of the marginal impact of the conditional variable k on the probability for individual i of a positive outcome, relative to the variance of the Bernoulli component:
![$$\gamma _k = - \displaystyle{{\partial \rho _i} \over {\partial x_{ki}}} \cdot \displaystyle{1 \over {\rho _i}} \cdot \left[ {\displaystyle{{1 + \exp \left( {x'_i \gamma} \right)} \over {\exp \left( {x'_i \gamma} \right)}}} \right] = - \displaystyle{{\partial \rho _i} \over {\partial x_{ki}}} \cdot \displaystyle{1 \over {\rho _i (1 - \rho _i )}}$$](https://static.cambridge.org/binary/version/id/urn:cambridge.org:id:binary:20160927070350882-0247:S0021859611000608:S0021859611000608_eqn7.gif?pub-status=live)
where the variance is shown as ρ i(1−ρ i). For example, entry weight largely and negatively influences the likelihood of positive MORT, as indicated by the positive parameter estimate (γ 5=2·901). This is not surprising given that more mature pens are better equipped to survive adverse conditions, whereas younger pens tend to be more likely to result in mortalities. Alternatively, mixed pens (mixed) have a negative γ coefficient (γ 3=−0·289) which implies that there is a positive relationship, relative to heifer pens. Estimates for steers and mixed indicate the difference in probability of a positive mortality, relative to a heifer pen. Therefore, if a pen is mixed, it has a higher probability of incurring positive mortality realizations that can be modelled with a log-normal distribution.
In the SLNM results, when γ coefficients are negatively related to β coefficients it implies that covariates impact on the mean of positive and observed values in the same direction as the likelihood of a positive value. For example, increases to entry weight shift the mean of MORT downward (β 5= −1·434) and also decrease the probability of a positive outcome (γ 5=2·901). This does not necessarily mean that the two processes work identically, as is assumed with the Tobit model, but rather tend to generally work in the same direction.
Parameter estimates for β refer to the marginal impact that the conditioning variables have on the positive realizations of MORT. Interpretations for these parameters refer to the marginal increase in the log of MORT. For example, a one-unit increase in the logarithm of entry weight is associated with a reduction in MORT by 1·4% (β 5=−1·434) for the observations that experience a positive MORT.
It is interesting to note the different implications from parameter estimates from the Tobit and SLNM models. For example, an insignificant mean difference parameter estimate for the variable Kansas in the Tobit model implies that MORT are not significantly impacted by feedlot location. However, parameter estimates from the SLNM model infer that pens placed into feedlots located in Kansas have a lower likelihood of a positive MORT (γ 4=0·099), relative to Nebraska feedlots. At the same time, pens placed in Kansas that have a positive MORT can be expected to realize logged MORT that is 0·13 higher than Nebraska feedlots (β 4=0·130). It might be strange to have significant impacts in opposite directions that influence both the likelihood of mortality and the positive MORT, but by distinguishing between these processes their respective impacts can be isolated. One possible explanation might be that Kansas lots spend more time on preventing mortalities from occurring through vaccinations or backgrounding, but are not able to detect the spread of disease as quickly as the Nebraska feedlots. This is a notable departure from the Tobit model, which saw no significant influence since these impacts essentially cancelled each other out.
The SLNM model also demonstrates a better overall ability to fit the within-sample data with a DIC measure of 20 752, as compared to the Tobit model, which has a DIC value of 23 020. However, MSPE is minimized when using the Tobit model, indicating a trade-off between within sample fit and out-of-sample prediction effectiveness.
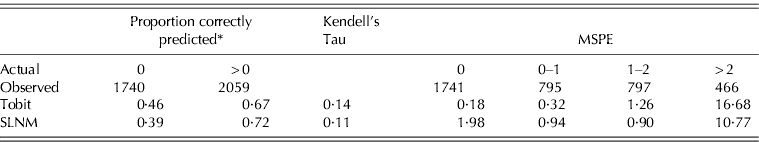
Table 5 breaks MSPE into four distinct groups based on actual values. The SLNM model does not appear to do as well fitting low actual values, relative to the Tobit. The SLNM model appeared to do much better in correctly predicting the positive actual values, as only 0·39 of the actual zero values were correctly predicted, while 0·72 of the positive values were correctly predicted to be positive values. A lower Kendall's Tau for the SLNM model also demonstrates that the Tobit more accurately predicts whether a value is zero or positive. This is likely due to the inability of the given ex ante variables to explain much of the variation in the model which is also shown in past studies (Belasco et al. Reference Belasco, Taylor, Goodwin and Schroeder2009b). While the results shown in Table 4 reflect significant estimates corresponding to γ, they may not be large enough in magnitude to have a real impact on the probability of positive observations. To illustrate, the mean of predicted values for ρ i was 0·544, which is close to the actual degree of censoring in the out-of-sample values (0·55). However, the standard deviation around predicted ρ i was 0·07. The implications of this lack of spread means that the model will tend to over-predict the amount of non-censored values. The SLNM model does do very well in fitting actual positive values that are greater than one, which is likely due to its accommodation for positive skewness.
Out-of-sample prediction results for Tobit and SLNM models
* Note: Correct prediction corresponds to predicting a zero or positive value that matches the actual value.
Regressions from univariate mortality models offer information concerning the relative impact each conditioning variable has on MORT. However, this variable is likely better characterized in a multivariate setting with other variables that explain the health and performance of cattle on feedlots, ultimately describing production risk in cattle feeding enterprises. To this end, the multivariate Tobit model and multivariate SLNM models were used to characterize these four variables, described earlier.
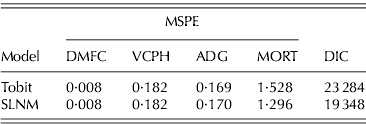
The multivariate SLNM model is applied to the cattle feedlot data set and more accurately fits the within-sample data and predicts with more accuracy, relative to the Tobit model, as shown in Table 6. DIC for the SLNM model is substantially lower than with the Tobit model, mainly due to the more accurate fit for MORT, which contributes quite a lot of unexplained variability to the system of equations. MSPE is significantly lower for semi-continuous variables when applied to the multivariate mixture model. This is particularly interesting given the contradictory univariate results; however, these results are more consistent with data generated from an SLNM model in the simulation study. MORT are shown to be more accurately characterized in a multivariate setting because of the effects from other non-censored variables as MSPE improves significantly from 2·612 (shown in Table 4) to 1·296 (shown in Table 6). Recall, that the expected value and variance of MORT accounts for the uncensored variable levels in the multivariate setting. This link allows for information from the continuous variable to feed into the semi-continuous variable on non-continuous portions of the density.
Model fit and predictive power estimates of fed cattle parameters based on a multivariate Tobit and SLNM models
DISCUSSION
The present paper provides two distinct contributions to existing research. The first is to develop an alternative modelling strategy to the Tobit model and more traditional mixture models, specifically for semi-continuous data. This model originates in a univariate case similar to that of Duan et al. (Reference Duan, Manning, Morris and Newhouse1983), then is extended to allow for multivariate settings. In the multivariate setting, the covariate relationship accounts for the correlation between semi-continuous and continuous variables. The second contribution is to more accurately describe production risk for cattle feeders by examining the model performance of different regression techniques. MORT play a vital role in cattle feeding profits, particularly due to the skewed nature of this variable. A clearer understanding of mortality occurrences will assist producers as well as private insurance companies, who offer mortality insurance, in managing risk in cattle operations. Additionally, production risk in cattle feeding enterprises play a significant role in profit variability, but is currently uninsured by current federal livestock insurance programmes. Existing livestock insurance programmes include the Livestock Revenue Product, which provides insurance against drops in cattle output prices, and the Livestock Gross Margin, which insures against the net impact of cattle output price drops and corn input price spikes. An accurate characterization of production risk plays an important role in addressing risk for producers and insurers.
Modelling semi-continuous data remains a large area of concern and current research in econometrics. While use of the Tobit model may be well-justified in certain instances, the results from both simulated and actual cattle production data sets suggest the use of an SLNM regression model. This is particularly true in instances where data come from a two-step process. While two-step processes have been applied to Hurdle models, mixture regression models have largely been ignored in economic studies. This is mainly a result of the past limitation of mixture regression models to count data (zero-inflated models). In the present study, a mixture regression model is developed that can handle both univariate and multivariate situations efficiently, in addition to nesting the standard Tobit model. Additionally, the inherent parametric flexibility allows for distributional assumptions to change based on the data on hand, rather than strictly using truncated or normal distributions. Here, a log-normal distribution is used to capture the positively skewed nature of cattle MORT, which gives the SLNM model significant advantages over the Tobit model. Advantages in model fit for the SLNM model stem from the ability to isolate and identify the impacts from observing a positive MORT and the level of MORT.
Production risk in cattle feeding enterprises is inherently complex, given the many areas risk can originate. The results from the present research demonstrate the potential gains from using this particular mixture model. Before applying this model to the data, simulations were conducted to test the model's ability to predict and fit data generated in different forms. These simulations provide results that support the use of the mixture model, in both prediction and model fit, when the data are from a two-step process. However, the mixture model did not demonstrate a strong ability to fit the data when the data are generated based on a Tobit model.
A solid understanding of cattle production risk is limited by the ability to characterize variability. The proposed model takes a step forward in developing a modelling strategy that can be used to measure other livestock or live animal productive measures. By more accurately characterizing these risks insurance companies, animal producers and operators can better understand the risks involved with animal production. Additionally, a more general form allows for a more accurate depiction of ex ante variables and their impact on MORT and other production variables. Future research is currently focusing on developing this model to account for systems where censoring occurs in more than three variables, which is currently problematic in classical estimation techniques. Examples where this particular model might be useful include health outcomes, consumption, livestock disease spread or production processes. The framework detailed in the present paper naturally extends to situations of more complex censoring systems.
The major flexibility in the proposed model lies in the ability to make different distributional assumptions. Distributional assumptions typically need to be made in cases when data cannot fully explain variability. However, non-parametric and semi-parametric methods may be of particular interest when large data sets are evaluated, since they allow empirical data to create a unique density. Semi-continuous production and demand systems where each component may not be accurately described by a single distribution may provide an excellent application for semi- or non-parametric extensions of the derived model.


