





Notations
- A
rut cross-sectional area
- c p
ice heat capacity (2040 J kg−1 K−1)
- dc
maximum crushed depth
- Ec, Ew, Es, Esq
crushing energy, wear energy, shearing energy, squeeze-flow energy
- E ice, E blade, E sen
heat loss into ice, heat loss into blade, sensible heat
- el
ice latent heat of fusion
- Fn, Ff
normal force, friction force
- Fc, Fw, Fs
crushing friction, wear friction, shearing friction
- g
gravitational acceleration (9.81 m s−2)
- H
ice hardness
- h
slurry-film thickness
- h sq
slurry thickness reduction from squeeze flow
- kA
Archard wear coefficient
- k i, k b
ice thermal conductivity, blade thermal conductivity
- l
blade-ice contact length
- Mc, Mw, Ms, Msq, Mm
crushed-ice mass, wear-particle mass, slurry-ice mass, squeeze-flow mass, melted mass
- m
skater mass
- pc, pw
crushing pressure, wear pressure,
- q b
blade heat flux
- R
blade longitudinal radius
- Ra, Rc
average blade roughness, composite blade roughness
- r
plate radius for squeeze flow
- s
sliding length
- Ti, Ts, Tm, Ta
bulk-ice temperature, slurry temperature, pressure-melting temperature, ambient temperature
- T0, TTC
blade-bottom temperature, thermocouple reading
- t
time
- Δtcontact, Δtlift
blade-ice contact time, blade-lift time (during regular strides)
- U
blade forward speed
- v
steady indentation speed (without sliding)
- Vc, Vw, Vice
crushed-ice volume, wear-particle volume, slurry-ice volume
- W
skater weight
- w
effective blade width
- x
horizontal position from front of blade-ice contact
- z
vertical position from front of blade-ice contact
- zc, zw, zm
crushing depth, wear depth, melt depth
- η s, η 0
slurry viscosity, supercooled water viscosity
- κ i, κ b
ice thermal diffusivity, blade thermal diffusivity
- μ = Ff /Fn
friction coefficient
- μc, μw, μs
friction coefficient for crushing, wear, shearing
- μsq, μi, μblade
equivalent friction from squeeze flow, ice heat loss, blade heat loss
- ρ i
density of ice (917 kg m−3)
- σ n
normal stress on contact patch
- σ R
Std dev. of roughness
- φ
slurry volumetric solid fraction
- φ ss
slurry volumetric solid fraction during steady indentation
1. Introduction
The remarkable slipperiness of ice skates has defied simple explanation for over a century. Reynolds (Reference Reynolds1899) proposed that pressure-melting produced a lubricating water film under a skate blade. Bowden and Hughes (Reference Bowden and Hughes1939) agreed that lubrication was likely but suggested that frictional heating generated the lubricating water layer. This ‘self-lubrication’ by meltwater subsequently gained wide acceptance as the mechanism controlling friction on ice (Evans and others, Reference Evans, Nye and Cheeseman1976; Colbeck and others, Reference Colbeck, Najarian and Smith1997; Kietzig and others, Reference Kietzig, Hatzikiriakos and Englezos2010; Persson, Reference Persson2000), and it formed the basis of models to predict skate friction (Lozowski and Szilder, Reference Lozowski and Szilder2013; Le Barre and Pomeau, Reference Le Barre and Pomeau2015; van Leeuwen, Reference van Leeuwen2017).
Lever and others (Reference Lever2022) reviewed postulated skate-friction mechanisms and conducted micro-scale observations of blade-ice interactions during skating trials on an indoor rink. They concluded that the brittle failure of ice under rapid compression plays a strong role. Their observations did not confirm the presence of full-contact water films and were more consistent with the presence of lubricating ice-rich slurries at discontinuous high-pressure zones (HPZs). Extensive ice-indentation research, with and without concurrent shear motion, has confirmed that the formation and extrusion of ice-rich slurries, at contact pressures approaching melting pressures, govern the energetics of indentation. The analogy of ice indentation to skating persuaded Lever and others (Reference Lever2022) to suggest that the presence of ice-rich slurries supporting skates through HPZs merges pressure-melting, crushing, abrasion and lubricating films as a unified hypothesis for why skates are so slippery across broad ranges of speeds, temperatures and normal loads. Figure 1 shows a schematic of blade-ice interactions during skating strides and their similarity with ice-indentation processes.
Blade-ice interactions and their similarity with ice-indentation processes, based on skating trials by Lever and others (Reference Lever2022) (credit: A. Manheimer-Taylor).

We present a new model that embodies this hypothesis. Our objective was to assess whether the formation and evolution of an ice-rich slurry could account for the characteristic slipperiness of ice skates. We formulated and coupled the mechanics of the key processes: crushing, abrasion, pressure-depression of the melting temperature, longitudinal shearing and lateral squeezing of the slurry film, and heat conduction into the ice and the blade. The model includes a key characteristic: the viscosity of the ice-rich slurry depends strongly on its ice fraction. Shearing of the initially high viscosity (ice fraction) slurry at the front of the blade rapidly melts ice particles to reduce its viscosity and quickly produces stable, low-friction conditions with thicker films than are possible from meltwater alone.
2. Background research
We summarize some of the key background research on ice-skate friction to set the context for a new skate-friction model. Lever and others (Reference Lever2022) presented comprehensive details and discussion of this research. More broadly, Lever and others (Reference Lever, Asenath-Smith, Taylor and Lines2021) reviewed the mechanisms thought to govern ice and snow kinetic friction, with a focus on how the brittle behavior of the substrates could influence those mechanisms. Those two studies guided our skate-friction modeling approach.
2.1 Friction measurements
High-quality measurements of skate friction remain rare, with measurements by de Koning and others (Reference de Koning, de Groot and van Ingren Schenau1992) on long-track speed-skates the most comprehensive. Their tests used an experienced speed skater (72 kg) on instrumented skates and measured friction through regular strides. This provided remarkable detail on the variation in normal force, Fn, friction force, Ff, and friction coefficient, μ = Ff / Fn, throughout the strides. Average friction coefficients during four strides at 8 m s−1 were μ = 0.0046 ± 0.0004 for straightaways and 0.0059 ± 0.0004 for curves across ice-surface temperatures of −1.8°C to −11°C. Minimum straightaway friction was measured at temperatures of −6 to −9°C, and friction increased slightly with increasing speed over the range 4.5–10 m s−1. During straightaway strides, friction varied significantly from an initial peak at blade touch-down, through lower but noisy glide values, to a final, larger spike at push-off. The authors suggested that the noticeable grooves formed during the touch-down and push-off phases could account for their respective friction spikes, owing to greater ice penetration.
Kobayashi (Reference Kobayashi1973) measured the deceleration of a weighted sled to determine the friction coefficient of long-track speed-skate blades (26.4 kg per blade, initial speed 1.4 m s−1) on outdoor lake and artificial ice used for competitive skating. Average coefficients were similar on both surfaces, dropping from μ = 0.0102 at −10°C to 0.0042 at −2.2°C. Friction on the artificial ice increased at warmer temperatures, while friction on the lake ice decreased to μ = 0.0031 at −0.6°C. Kobayashi attributed the warm-temperature difference to the structural differences in the ice resulting from top-down (lake) vs layered freezing.
Tusima (Reference Tusima and Ghrib2011) used a 1-m-long linear tribometer to measure the friction of a long-track speed skate and found lower friction on basal-plane (0001) ice compared with polycrystalline ice, which he attributed to its lower shear strength. Remarkably, Tusima then created a 400-m speed-skating oval consisting entirely of (0001) surface ice. Using sled deceleration (30 kg, 0.9–1.1 m s−1), he measured μ = 0.0038 ± 0.0002 on (0001) ice at −3.1°C compared with μ = 0.0045 ± 0.0002 on polycrystalline ice at −4.1°C. He also measured μ = 0.003–0.007 on polycrystalline ice at −3°C across sled speeds 0.26–3.5 m s−1, with slightly higher friction at the low-speed end.
Federolf and others (Reference Federolf, Mills and Nigg2008) measured the deceleration of a weighted sled to determine the friction of standard hockey blades and three sets of novel blades flared at their bottoms. Unlike speed-skate blades, hockey blades are hollow ground to produce sharper corners aimed to improve performance during rapid turns, accelerations and stops common during play. Hockey blades also have smaller rocker radii than speed skates for similar reasons. Baseline conditions loaded each blade with 53 kg and launched the sled at 1.8 m s−1. Two test series varied mass from 32–74 kg and launch speed 1.2–2.1 m s−1. Ice-surface temperatures varied −5. °C to −4.9°C. Friction on the standard blades averaged μ = 0.0071 ± 0.0005 and decreased slightly with increasing normal load. The 4°, 6° and 8° flared blades reduced average friction by 13%, 21% and 22%, respectively. Speed variations over this low-speed range had little effect.
These data confirm that both speed skates and hockey skates produce low friction over a range of conditions of interest, despite differences in their rocker and bottom profiles and surface finishes. Similar contact mechanics probably govern friction on both types of skates.
2.2 Ice-indentation research
Indentation tests, with or without concurrent sliding, have revealed key processes that are directly relevant to skate friction: formation of local HPZs that transmit the majority of interaction loads; microcracking and dynamic recrystallization under the indenter; splitting, spalling and ejection of ice fragments near the edges of HPZs; crushing and extrusion of the crushed ice and ice-rich slurries as HPZs compress. With μ < 0.01 for skates, the vast majority of applied load is compressive, and the mechanics are analogous to ice indentation.
Peak pressures within HPZs can reach the pressure-melting point for the ambient ice temperature (Gagnon and Molgaard, Reference Gagnon and Molgaard1991; Gagnon, Reference Gagnon1994a; Wells and others, Reference Wells, Jordaan, Derradji-Aouat and Taylor2011; Kim and others, Reference Kim, Golding, Schulson, Løset and Renshaw2012; Browne and others, Reference Browne, Taylor, Jordaan and Gurtner2013; O'Rourke and others, Reference O'Rourke, Jordaan, Taylor and Gürtner2016). Brittle fracture energies are low (Nixon and Schulson, Reference Nixon and Schulson1987). Consequently, pressure-melting and extrusion of the ice-rich slurries consumes the majority of the indentation energy (Jordaan and Timco, Reference Jordaan and Timco1988; Gagnon and Molgaard, Reference Gagnon and Molgaard1991, Gagnon, Reference Gagnon1994b, Gagnon, Reference Gagnon2016). Gagnon and Molgaard (Reference Gagnon and Molgaard1991) and Gagnon (Reference Gagnon1994b, Reference Gagnon2016) estimated the liquid-water content of the slurries as 12–20%, and Gagnon (Reference Gagnon2010) observed ice-water jets exiting the HPZs during rapid ice-indentation tests.
These processes appear to govern friction during concurrent indentation and sliding. Gagnon and Mølgaard (Reference Gagnon and Mølgaard1989) measured low kinetic friction (μ ~ 0.02–0.1) with the concurrent crushing of fresh water ice against a rotating steel wheel. The tests produced periodic crushing and extrusion of pulverized ice, along with some meltwater, similar to ice-indentation tests without sliding. Gagnon (Reference Gagnon2016) crushed ice against mm-scale rough surfaces with concurrent sliding motion and measured surprisingly low friction (μ ~ 0.02–0.14). High-speed video identified ice-rich slurries separating the intact-ice zones from the contacting slider elements. Gagnon noted that ‘The layer may be thought of as a self-generating squeeze film that is powered by the energy supplied by the loading system that causes the ice crushing.’ Gagnon noted that these processes should be considered to explain the friction of skate blades on ice.
2.3 Self-lubrication by meltwater
Bowden and Hughes (Reference Bowden and Hughes1939) first proposed that frictional heat from sliding could melt the contacting ice and produce a hydrodynamic film that governs ice friction. Despite no direct confirmation that skates produce a lubricating meltwater film, this hypothesis was widely accepted as the mechanism governing skate friction (Evans and others, Reference Evans, Nye and Cheeseman1976; Colbeck and others, Reference Colbeck, Najarian and Smith1997; Kietzig and others, Reference Kietzig, Hatzikiriakos and Englezos2010; Lozowski and Szilder, Reference Lozowski and Szilder2013; Le Barre and Pomeau, Reference Le Barre and Pomeau2015; Persson, Reference Persson2015; van Leeuwen, Reference van Leeuwen2017).
Stiffler (Reference Stiffler1984) formulated a first-principles, self-lubrication model by coupling the Reynolds' equation for hydrodynamic lubrication with an energy equation, wherein the heat source was viscous shearing of a water film and the heat sinks were transient heat flow into the two bodies and latent heat needed to melt one surface. He recognized that, even for parallel surfaces, steady melting would compensate for mass-loss by squeeze flow to provide normal pressure to support the slider. Applied to an ice skate (−2°C, 1 MPa normal pressure, 1 ms−1 speed), the model predicted μ = 0.011 and film thickness h = 0.17 μm. However, Stiffler noted ‘The difficulty in applying the theory to engineering problems is the magnitude of the melt thickness. It is necessary that the melt thickness exceeds the combined peak roughness of the surfaces.’ He concluded that ‘A skater on typical ice would probably fail the test’.
Expanding on this approach, Lozowski and Szilder (Reference Lozowski and Szilder2013) assembled the first comprehensive model of self-lubrication to predict skate friction. The mechanics included ice-crushing (termed ‘ploughing’) to form a groove of sufficient length to support the skater's weight. Although the model calculated resistance from crushing, it did not consider the role of the crushed particles along the interface and instead assumed that a hydrodynamic meltwater film develops at the front of the contact zone. As with Stiffler (Reference Stiffler1984), the model separated the flow of this film into longitudinal Couette flow (laminar shearing between parallel plates) and lateral squeeze flow, with the Couette flow generating the viscous heat needed to melt the underlying bulk ice. Formulated for a vertical blade, the model gave reasonable agreement with the friction measurements of de Koning and others (Reference de Koning, de Groot and van Ingren Schenau1992). Lozowski and others (Reference Lozowski, Szilder and Maw2013) expanded this model to include blade tilt. The revised model improved agreement with the de Koning and others (Reference de Koning, de Groot and van Ingren Schenau1992) measurements. Indeed, it predicted friction variations with tilt angle that mapped remarkably well onto the time-varying values measured during each stride. Both the vertical and tilting-blade models predicted water-film thicknesses below about 0.5 μm for most speed-skating conditions (75 kg skater gliding on one blade).
Le Barre and Pomeau (Reference Le Barre and Pomeau2015) and Van Leeuwen (Reference van Leeuwen2017) formulated similar self-lubrication models for skates. These models relaxed the assumption of constant pressure (equal to ice hardness) to calculate the length of the contact zone, but both also neglected the mechanics of dry contact at the front of the blade and the role of any crushed ice.
Lever and others (Reference Lever2022) noted several concerns regarding the formulation of self-lubrication models:
• The models omit any role for crushed ice or abrasive-wear particles, including whether the particles partially or completely melt from continued blade movement or contribute some portion of the power expended to create them to the water-film heat budget. Specifically, how does dry-contact indentation and sliding at the front of the blade transition to lubricated contact?
• The models assume ice crushing or yielding at hardness values obtained during drop-ball tests (Poirier and others, Reference Poirier, Lozowski and Thompson2011). However, as Lever and others (Reference Lever, Asenath-Smith, Taylor and Lines2021, Reference Lever2022) noted, average ice-indentation pressure (hardness) under brittle failure varies with indenter geometry, contact area and state of confinement. That is, ice hardness is not a uniquely defined material property. The models omit the observed indentation mechanics of HPZ formation, pressure-melting and the formation and extrusion of ice-rich slurries.
• The formulations used for the hydrodynamics of the water film, including squeeze flow, assume that the blade roughness is much smaller than the water-film thickness. This may not be true for many conditions of interest, especially for unpolished hockey or recreational skates (Lever and others, Reference Lever2022).
2.4 Skating-trial observations
Lever and others (Reference Lever2022) conducted skating trials on an indoor rink to investigate the contact mechanics during actual skating to assess the merits of the various friction hypotheses. They used high-resolution infrared thermography, high-speed video, optical profilometry and microscopy to document processes during single-skate glide passes of short-track speed skates and hockey skates. They also captured the patterns of scattered ice particles during normal strides.
Several observations weighed against the presence of full-contact water films supporting the skates:
• Striations along the ruts mimicked the roughness of the blade bottoms, likely a result of abrasion by blade asperities.
• Average roughness for both blades was similar to or greater than water-film thicknesses predicted by the model of Lozowski and Szilder (Reference Lozowski and Szilder2013). This discrepancy challenges the modeled hydrodynamics, which requires roughness to be much smaller than film thickness (Stiffler, Reference Stiffler1984; Bhushan, Reference Bhushan2013).
• The irregularly shaped rut-depth profiles did not map simply onto blade profiles, suggesting random fracture of ice beneath the blade rather than smooth melting.
• Fractured ice under the blade could provide local traps for pressurized melt-water, complicating the formation of full-width water films.
Collectively, their observations were more consistent with skate friction generated at irregularly spaced HPZs that support most of the skater's weight. Supporting observations included:
• Thermal signatures of ruts showed significant lateral and longitudinal variability, with localized warm patches, suggesting the presence of HPZs of contact rather than full-contact melting.
• Spalling along skate edges was consistent with documented spalling at indenter edges and along the sides of HPZs.
• Striations along the ice were consistent with abrasion by blade asperities, a result of direct blade-ice contact that would generate micron-scale ice particles by a brittle fracture to contribute to the slurries.
Lever and others (Reference Lever, Asenath-Smith, Taylor and Lines2021, Reference Lever2022) also reviewed the recent hypothesis that the presence of nm-scale quasi-liquid layers (QLLs) on ice surfaces accounts for the slipperiness of ice (Louden and Gezelter, Reference Louden and Gezelter2018; Weber and others, Reference Weber2018; Nagata and others, Reference Nagata2019). However, given the dominance of crushing failure and micron-scale blade roughness, we see no direct role for QLLs on skate friction.
3. Model description
The model of Lozowski and others (Reference Lozowski, Szilder and Maw2013) reproduces measured speed-skate friction remarkably well, and hence it must approximate the net energetics. However, it treats ice crushing separately from hydrodynamic lubrication, whereas crushing, abrasion and lubrication of the interface must be coupled and vary in influence along the blade. The mechanics of brittle failure observed under rapid ice indentation suggest a way to couple these processes through the creation, shearing and extrusion of ice-rich slurries under HPZs.
We present here a 1D model to capture these mechanics. We simplify several complex processes (e.g., the formation of HPZs, slurry lateral squeeze and viscous heating, slurry rheology) and formulate the equations for a vertical, gliding blade. Primarily, we sought to assess whether the formation and evolution of an ice-rich slurry could account for the characteristic slipperiness of skates via mechanics more consistent with brittle failure observed during skating trials and ice-indentation research. Specifically, we postulate the following skate-friction mechanics by analogy with ice indentation:
• Brittle fracture from downward motion pulverizes the ice.
• Ice particles initiate an ice-rich slurry to support the blade.
• The fracture energy consumed to create the ice-particle surface area is small.
• Most crushing energy is lost to the viscous squeeze-flow of the pulverized ice.
• Normal pressures are sufficient to depress the slurry melting temperature appreciably below 0°C.
Additionally, we postulate mechanics relevant to concurrent shearing:
• Blade asperities abrade the ice and add wear particles and heat into the slurry unless the slurry film is much thicker than blade roughness.
• Forward motion of the blade shears the ice-rich slurry, producing additional friction and heating of the slurry.
• Very efficient heat transfer occurs within the slurry to melt some portion of the pulverized ice.
• Slurry viscosity is high at high ice-fraction and strongly decreases with increasing water content as ice particles melt along the blade.
Figure 2 shows a schematic of the postulated friction mechanics. The 1D assumption implies that a constant-width, rectangular contact patch supports the blade through a slurry whose properties vary only with the longitudinal position.
Schematic of postulated friction mechanics under a skate blade.

The following sections describe the specific mechanics implemented and their process contributions:
• Ice crushing (frictional resistance, heat input, pulverized ice)
• Abrasion (frictional resistance, heat input, abraded wear particles)
• Longitudinal shear flow (frictional resistance, heat input)
• Lateral squeeze flow (extruded slurry)
• Heat conduction into the ice (heat loss)
• Heat conduction into the blade (heat loss)
• Viscosity dependence of the slurry on ice fraction
The model couples these processes to predict conditions along the blade:
• Blade-friction evolution
• Slurry-film thickness evolution
• Ice-fraction and viscosity evolution
3.1 Crushing mechanics
We model ice crushing by modifying the 1D approach of Lozowski and Szilder (Reference Lozowski and Szilder2013) for a vertical blade: we assume that crushing occurs at constant pressure approaching the melting pressure for the bulk ice temperature. Crushing inputs pulverized ice particles and heat to the slurry and produces crushing friction. Figure 2 inset shows a schematic of incremental crushing by an incremental motion of the blade.
Skate blades are circular arcs with longitudinal radius R. We model the blade-ice contact width, w, as a constant along contact length, l, to produce a rectangular contact patch. The coordinate frame sets x = 0, z = 0 at the front of the blade-ice contact zone. For crushing depth zc ≪ l ≪ R, the blade-ice contact slope is

Maximum crushed depth, dc, occurs at x = l,

and we assume that the blade loses contact with the ice rearward of its longitudinal centerline. A vertical force balance provides the contact length:

where mg = W is skater weight (assumed on one blade), and pc is contact (crushing) pressure.
The work needed to crush ice, d2Ec, for forward displacement dx = Udt is

where the second-order change refers to the work on an elemental length of blade resulting from an increment of forward motion.
Consequently,

where dFc is the longitudinal friction force from crushing. The local friction coefficient from crushing, μc, is thus

Maximum crushing friction, μ cmax = (l/R), occurs at the front of the contact zone where the blade-ice contact slope is a maximum.
In addition to generating heat and frictional resistance, downward crushing releases a mass of pulverized ice into the slurry film. We assume that the volume of pulverized ice is equal to the volume swept out by the downward movement of the blade:

Spalling at blade edges widens the rut but does not release ice into the slurry. The mass of crushed ice released into the slurry is thus:

where ρ i is the bulk ice density, 917 kg m−3, and we have inserted Eqn (1) for dz c. The generation rate of pulverized ice is also a maximum at the front of the contact zone.
3.2 Abrasion mechanics
Archard (Reference Archard1953) presented a family of models to predict the real area of contact between two flat surfaces pressed together and the resulting wear rate as they slide past each other. Based on experimental evidence that wear rate is proportional to the total load, Archard suggested that plastic deformation at the contacting asperities, coupled with lump removal at the contacts provided the most suitable wear model. The resulting Archard equation is remarkably simple but has proven effective in predicting wear rates for dry-contact sliding. Lever and others (Reference Lever, Taylor, Hoch and Daghlian2019) found that it reasonably predicted the evolution of contact area for polyethylene sliding on sintered snow grains. We include abrasive wear here for completeness, although the resulting model predicts it has only a minor influence on skate friction.
We apply a modified Archard equation to estimate the volumetric wear rate of the bulk ice by the forward motion of the blade:

where kA is the Archard coefficient for wear of ice by steel, dF n = σ nwdl is the normal load on the elemental patch of the blade, and H is the ice hardness. Assuming that all normal load transfers through the HPZs, σ n = p c = H, the mass of abraded ice particles released into the film is

The Archard equation assumes that the sliding surfaces are in direct contact. However, the slurry film acts as a lubricant between the blade and the bulk ice. Wear rates and friction drop significantly as the film thickness significantly exceeds the combined roughness of the sliding surfaces and hydrodynamic lubrication fully separates the surfaces (e.g., Beerbower, Reference Beerbower1972; Jones, Reference Jones1982; Tabor, Reference Tabor2006; Bhushan, Reference Bhushan2013). An acceptable criterion for hydrodynamic lubrication, derived from studies of bearing performance, is (h/R c) > 6 (Bhushan, Reference Bhushan2013), where the composite roughness, $R_c = ( {\sigma_{R1}^2 + \sigma_{R2}^2 } ) ^{1/2}$ , σ 1 and σ 2 are the Std dev. heights of the two surfaces (σ R ~ 1.25R a), and h is the slurry-film thickness. Although the effect on abrasion of thin lubricating films (boundary and mixed-mode lubrication) is poorly understood, we may modify the Archard equation to impose a linear reduction in wear rate with slurry-film thickness:


In addition to releasing wear particles into the slurry, abrasion will generate heat. The work of abrasion, d2E w, relates to the corresponding friction force opposing the forward motion, dF w:

The quantitative link between abrasion rate and frictional resistance is uncertain. We approximate it here by analogy with the work done by crushing (Eqn (4)):

where pw and zw are the normal pressure and downward movement of the blade during abrasion on the elemental patch wdl. We may apply pw = pc based on the assumption that contact with the bulk ice is through HPZs. The downward movement is given by the Archard volumetric wear (Eqn (9), omitting the linear variation with film thickness for simplicity):

Consequently, the estimated heat input from abrasion becomes

and the corresponding frictional resistance, μ w, from abrasion is

which is a remarkably simple expression that might only be valid (approximately) for wear at HPZs, pw = pc = H .
We apply the same linear reduction in wear rate based on film thickness (Eqn (11)) to obtain estimates for the abrasive heat and friction adjusted for film thickness:


The value of kA conceptually represents the probability that a sliding contact will generate a wear particle, and values range from ~10−5 for light wear to 10−2 for heavy wear (Archard, Reference Archard1953; Rabinowicz, Reference Rabinowicz1965). It is largely unknown for steel abrading ice. Lever and others (Reference Lever, Taylor, Hoch and Daghlian2019) measured wear rates for polyethylene (Ra = 0.65 μm) sliding on compacted and sintered snow (stationary ice grains) and determined kA ~ 3.0 × 10⁻⁵ to 6.0 × 10⁻⁴ across the temperature range −19 to −1.3°C. Ground or filed skate blades sliding across ice should generate more wear than polyethylene when the slurry film does not fully separate the surfaces. Here, we examine the effect of abrasion on skate friction for kA ~ 10−4 to 10−2.
3.3 Longitudinal shear flow
We follow others (Stiffler, Reference Stiffler1984; Jordaan and Timco, Reference Jordaan and Timco1988; Lozowski and Szilder, Reference Lozowski and Szilder2013) and model the fluid dynamics of the slurry film as independent, low Reynolds number longitudinal (Couette) flow and lateral squeeze flow. Strictly speaking, the resulting equations are valid for smooth, parallel surfaces and Newtonian fluids. We ignore the complexities that result from rough surfaces (Moore, Reference Moore1965; Bhushan, Reference Bhushan2013) and nonNewtonian fluids (Smyrnaios and Tsamopoulos, Reference Smyrnaios and Tsamopoulos2001; Nikkhoo and other, Reference Nikkhoo, Khodabandehlou, Brozovsky and Gadala-Maria2013; Wingstrand and others, Reference Wingstrand, Alvarez, Hassager and Dealy2016) as convenient simplifications but explore the effect of viscosity uncertainty on model predictions.
The shearing resistance, friction coefficient and work done on the elemental patch relate to the shearing rate, U/h, and are, respectively:


where η s is the effective Newtonian viscosity of the slurry, and we again apply the assumption that the normal pressure is the crushing pressure, pc. Consistent with our 1D formulation, these equations neglect variations in viscosity and shear rates vertically and across the film. We also neglect slurry-volume loss along the blade relative to squeeze flow along the sides.
3.4 Lateral squeeze flow
We ignore vertical and lateral variations of slurry properties to model squeeze flow, an important simplification. While the vertical pressure gradient is small for a thin Newtonian-fluid film, the lateral pressure distribution is parabolic, with zero pressure at the outflow edges. Le Berre and Pomeau (Reference Le Barre and Pomeau2015), van Leeuwen (Reference van Leeuwen2017) attempted to solve for 2D pressure and film-thickness distributions under a blade via assumptions for the material behavior of the bulk ice. However, they did not treat the ice as a brittle material, assumed that the lubricating film was liquid, and neglected any role of crushed particles on the interfacial mechanics. If we allow pressure, and hence melting temperature, to vary across the contact patch, we would need to model 3D variations ice fraction, viscosity, film thickness, etc. These complexities might warrant inclusion in an updated model if they can be guided by observations of the contact zone under a skate, but they would distract from the aims of this initial modeling effort.
The squeeze flow links contact pressure, viscosity and the reduction in film thickness, dh sq:

or

Ice-indentation research indicates that most of the work of crushing is dissipated within the slurry as it is squeezed out from under the HPZs (Jordaan and Timco, Reference Jordaan and Timco1988; Gagnon and Molgaard, Reference Gagnon and Molgaard1991; Gagnon, Reference Gagnon2016). Our approach includes the total work done by crushing in d2Ec (Eqn (4)). Nevertheless, we separately track the viscous squeeze energy of the slurry, d2E sq, driven by the change in film thickness, dhsq, to compare it later with the crushing work:

3.5 Heat conduction into the ice
As with other friction analyses (e.g., Evans and others, Reference Evans, Nye and Cheeseman1976; Lozowski and Szilder, Reference Lozowski and Szilder2013), each location on the bulk ice experiences transient heat conduction as the blade passes, whereas the slurry experiences this same heat transfer as steady in time but varying along the blade. Lever and others (Reference Lever2022) showed that lateral heat conduction was negligible, so we may model the heat flow into the bulk ice as simple 1D transient conduction into a semi-infinite medium:

where k i is the thermal conductivity of the bulk ice, κ i is the thermal diffusivity of the bulk ice, ΔT i = T s − T i is the temperature difference between the slurry and the bulk ice (both assumed to be constant), and we have inserted t = x/U as the duration of heating by the passing blade.
We assume that the slurry is uniformly at the melting temperature for the blade-ice contact pressure. That is T s = T m(p c), where p c = 0.5p m(T i) as a baseline condition (Section 3.11). This approach reduces the temperature difference driving heat conduction to about half of that when pressure melting is neglected (i.e., when $T_m = 0^\circ {\rm C}$ ).
).
Per Lozowski and Szilder (Reference Lozowski and Szilder2013), we avoid the singularity at x = 0 by starting the calculation at x = Δx. Note that Lever and others (Reference Lever2022) measured slower ice-rut cool-down rates after blade passage than predicted and suggested that the fractured ice beneath the blade could have lower thermal conductivity than solid ice. Nevertheless, we use the conductivity of solid ice, ki = 2.25 W m−1 K−1, as our baseline value.
3.6 Heat conduction into the blade
As the blade touches down and begins to glide, heat conducts from the slurry into the blade. Our previous analyses (Lever and others, Reference Lever2022) indicated that we may again model this heat loss as 1D transient into a semi-infinite medium, with the duration of heating now given by the glide duration, tg = s/U, where s is the glide length:

where dt = dx/U is the same time interval considered for heat loss from slurry into the ice. Note that this heat flux does not vary along the blade but varies with glide distance (glide time). For simplicity, we set ΔT b = T s − T i = ΔT i by assuming that the bulk ice and the blade are at the ambient temperature, Ta.
3.7 Viscosity of the ice-water slurry
The effective viscosity of solid-liquid slurries increases with increasing solid fraction (Thomas, Reference Thomas1965; Jeffrey and Acrivos, Reference Jeffrey and Acrivos1976; Delaye and others, Reference Delaye, Poitou and Chaouche2000; Nikkhoo and others, Reference Nikkhoo, Khodabandehlou, Brozovsky and Gadala-Maria2013). The slurry's constitutive behavior may also change from Newtonian to nonNewtonian at a high solid fraction. Thomas (Reference Thomas1965) compiled and corrected measurements of slurry viscosities to minimize nonNewtonian behavior and found a strong correlation up to volumetric solid fractions φ ≡ (V solid/V slurry) ~ 0.62 with the following equation:

where η s is the slurry viscosity and η 0 is the viscosity of the liquid at the slurry temperature. Its small intercept error, (η s/η 0)(0) = 1.00273, is negligible at the ice fractions of interest (φ > 0). We use the results of Dehaoui and others (Reference Dehaoui, Issenmann and Caupin2015) to model the viscosity of supercooled water, η 0(T s).
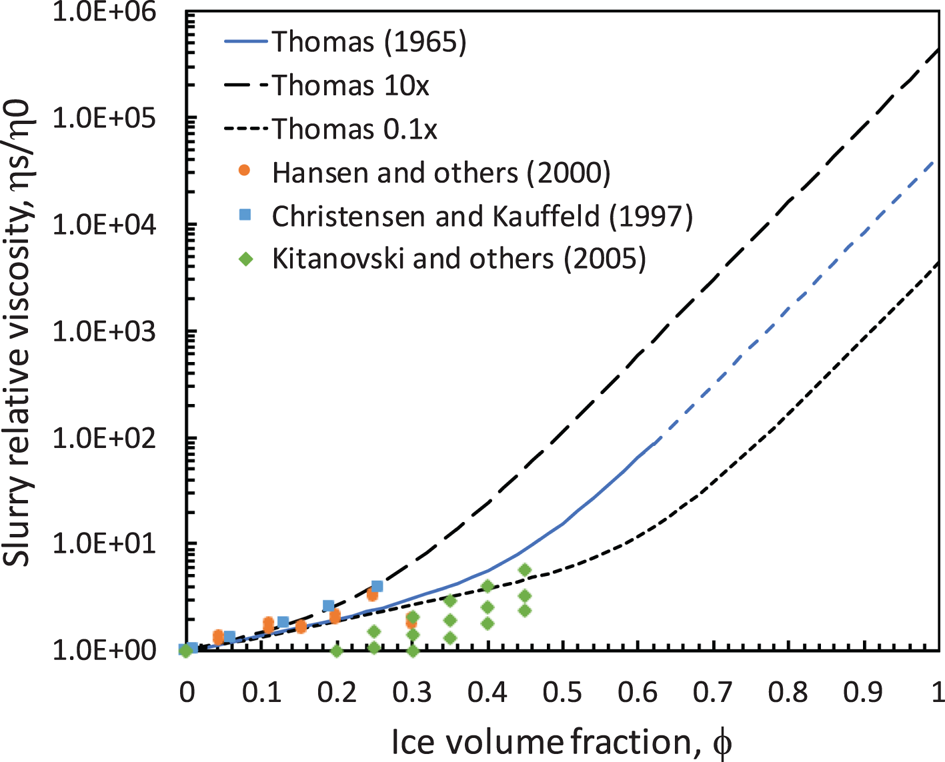
An industry has developed around the use of ice-water slurries (or ice-antifreeze mixtures) as heat-transfer fluids in refrigeration systems (Egolf and Kauffeld, Reference Egolf and Kauffeld2005; Kauffeld and others, Reference Kauffeld, Wang, Goldstein and Kasza2010). Researchers have measured the viscosity of such slurries up to φ ~ 0.5, with evidence of Bingham behavior beyond φ > 0.1 − 0.3 (Christensen and Kauffeld, Reference Christensen and Kauffeld1997; Hansen and others, Reference Hansen, Kauffeld, Grosser and Zimmermann2000; Ayel and others, Reference Ayel, Lottin and Peerhossaini2003; Kitanovski and others, Reference Kitanovski2005). The results are scattered (Fig. 3), and practitioners have used the Thomas equation for design calculations owing to its relative simplicity (Christensen and Kauffeld, Reference Christensen and Kauffeld1997; Guilpart and others, Reference Guilpart, Stamatiou, Delahaye and Fournaison2006). Furthermore, low measured threshold stresses for Bingham behavior (10–100 Pa) relative to the high shear rates under a skate blade (105 s−1 for U = 1 m s−1, h = 10 μm) suggest that Newtonian behavior should dominate and that the Thomas equation could provide a reasonable estimate for the slurry's viscosity, at least up its established limit of φ ~ 0.62, although there is essentially no empirical justification for this extension. We use it here as a baseline and examine the effect of varying the Thomas equation on model predictions. Following ice-indentation terminology, we apply the term ‘ice-rich slurry’ to reflect its development from pulverized and abraded ice particles and to denote that the slurry's ice fraction substantially increases its viscosity beyond that of supercooled water or dilute (φ < 0.1) mixtures.
Measured ice-slurry effective viscosities compared to the correlation by Thomas (Reference Thomas1965) used for baseline model predictions (Eqn (27)). We project the Thomas equation beyond its established limit of φ ~ 0.62 and vary the exponential multiplier by 0.1×–10× to assess uncertainty in its use.
3.8 Local friction coefficient
Crushing, wear and longitudinal shearing all contribute to local frictional resistance:

Heat flow from the slurry into the ice and blade increase the slurry's ice fraction and thus influence friction by increasing slurry viscosity.
3.9 Film-thickness evolution
As noted, self-lubrication skate models (Stiffler, Reference Stiffler1984; Lozowski and Szilder, Reference Lozowski and Szilder2013; Le Barre and Pomeau, Reference Le Barre and Pomeau2015; van Leeuwen, Reference van Leeuwen2017) assume that a lubricating meltwater film forms at the front of the blade-ice contact zone, and they consequently apply the viscous heat from shearing to melt the bulk ice to counterbalance squeeze-flow losses. The presence of an ice-rich slurry changes this energy flow.
Longitudinal viscous shearing occurs within the slurry film. The viscous heat generated should transfer very efficiently to warm and melt the small crushed and abraded ice particles. We assume that unless all the ice within the slurry melts, viscous shearing will not transfer heat to melt the underlying bulk ice. We apply similar reasoning to the energy dissipated by crushing and abrasion, which are both intimately entwined with the generation of ice particles. That is, the model preferentially applies the total input energy (crushing, abrasion and viscous shearing) to warm and melt the ice particles within the slurry.
Downward crushing and wear increase local slurry-film thickness by deepening the rut. Squeeze flow decreases the film thickness by lowering the upper boundary. If the ice fraction reaches zero, net energy generated (frictional heat less conduction losses) will cause the bulk ice to melt downward, increasing film thickness by dz m. Longitudinal shearing does not directly change the film thickness. Thus, we model the change in film thickness as


Equations (1), (14, adjusted for film thickness) and (23) provide expressions for dz c, dz w and dh sq, respectively. The energy budget for φ = 0 provides dz m.
3.10 Ice fraction and viscosity evolution
The ice mass within elemental slurry volume whdl with volumetric ice fraction φ is:

The incremental change in ice mass has two components:

This change in ice mass results from crushing and wear mass added, less mass lost through squeeze and melting:

Mass inputs d2M c and d2M w are given by Eqns (8) and (10). The mass loss from squeeze flow is related to the change in film height:

An energy budget provides the mass melted, d2M m. The work done by crushing, abrasion and longitudinal shearing input heat to the slurry film. The heat sinks are sensible heat to raise the ice particles (or bulk ice melted) to the slurry temperature, the heat conducted into the ice and the heat conducted into the blade. Thus,

where Eqns (4), (17) and (21) account for the energy inputs, Eqns (25) and (26) account for the conduction losses, el is the latent heat of fusion for ice, and E senis the sensible heat needed to raise the ice particles and any bulk-ice melted from Ti to Ts:

where cp is the heat capacity of ice (2040 J kg−1 K−1) and ΔT = T s − T i. Note that pressure-depression of the melting temperature slightly reduces the latent heat needed to melt ice, from 3.34 × 10⁵ J kg−1 at 0°C to 2.42 × 10⁵ J kg−1 at −20°C (Bridgman, Reference Bridgman1912).
Equations (31) with (32) and substituting for the mass changes yields the change in volumetric ice fraction (for φ > 0) or the increase in rut depth from bulk-ice melting (for φ = 0):
 $$ \eqalignb{\displaystyle{{{\rm d}\varphi } \over {{\rm d}x}} = \displaystyle{1 \over h}\left[{( {\mu_c + \mu_w} ) \left({1-\varphi + \displaystyle{{c_p\Delta T} \over {e_l}}} \right) \right}\right} \cr \hskip 7pc\qquad- \displaystyle{{\,p_c} \over {\rho_ie_l}}\left({\mu -\displaystyle{{k_i\Delta T_i} \over {{( {\pi \kappa_iUx} ) }^{1/2}p_c}}-\displaystyle{{k_b\Delta T_b} \over {{( {\pi \kappa_bUs} ) }^{1/2}p_c}}} \boldsymbolgg ) } \right]\;{\rm for}\;\varphi > 0, \;$$
 $$ \eqalignb{ \displaystyle{{{\rm d}z_m} \over {{\rm d}x}} = \displaystyle{1 \over {1 + ( c_p\Delta T/e_l) }} \left[{\displaystyle{{\,p_c} \over {\rho_ie_l}}\left({\mu -\displaystyle{{k_i\Delta T_i} \over {{( {\pi \kappa_iUx} ) }^{1/2}p_c}}-\displaystyle{{k_b\Delta T_b} \over {{( {\pi \kappa_bUs} ) }^{1/2}p_c}}} \right) \right}\right} \cr \quad - \displaystyle{{c_p\Delta T} \over {e_l}}( {\mu_c + \mu_w} ) } \right]\;{\rm for}\;\varphi = 0.$$
The first term in Eqn (36) relates changes in ice fraction to the ice particles released into the slurry and the slurry squeezed out. The second term relates the changes to ice melting via the heat flows into and out of the slurry. Note that for contact pressure of ~30 MPa, the term (p c/ρ ie l) ~ 0.1, so when φ ~ 1 the crushing and wear processes can cause some melting, via their energy inputs, in addition to injecting mass into the slurry. Also, viscosity is very high at φ ~ 1, and the slurry is thin at the front of the blade, which combine to cause very high shearing friction. Consequently, ice fraction rapidly converges to φ < 1 at the front of the blade.
Equations (28), (29) and (36) couple with the Thomas Eqn (27) to track the evolution, respectively, of local friction, film thickness, volumetric ice fraction and viscosity of the slurry film developed under the skate blade. We implemented this model in MATLAB's ode45 numerical solver for simultaneous differential equations.
3.11 Contact pressure and slurry temperature
Our model requires a choice for pc, the average crushing pressure governing blade-ice contact. Skating observations by Lever and others (Reference Lever2022) showed that HPZs (zones of warmest rut temperatures) were isolated rather than continuous, both longitudinally and laterally. Nevertheless, to formulate a 1D model, we neglect longitudinal variations in contact pressure and assume constant pressure across contact width, w. We processed the rut-depth measurements by Lever and others (Reference Lever2022) to estimate pc from the rut cross-sectional area. The measurements were for nearly vertical, but not perfectly vertical, blade angles. Figure 4 shows an example for a short-track speed skate test.
Rut profile measured by Lever and others (Reference Lever2022) after a glide pass by a short-track speed skate. The dashed outline of the blade shows its approximate location and contact angle, and the shaded area shows the estimated rut area used to calculate contact pressure. Note that the vertical distortion (10×) needed to reveal the rut profile exaggerates the 3° blade-ice contact angle. Rectangles at either end of the profile were registration strings used to coordinate the profile with IR and optical images.

The rut profiles were irregularly shaped and did not simply conform to the blade shapes owing to brittle fracture of the ice. To process these profiles, we estimated the rut cross-sectional area below the blade, A, and calculated the equivalent average depth, $\bar{d} = A/w$ . We then calculate the average contact pressure, $\bar{p}_c$
 , by combining Eqns (2) and (3):

Figure 5a shows that the resulting contact pressures varied approximately linearly with blade angle, with higher pressures at angles closer to vertical and for the speed skate at all angles relative to the hockey skate. We attribute both effects to greater fracture and spalling under the hockey skate (higher crushing rates) and at greater blade angles (less confinement of the ice).
(a) Average contact pressure vs blade angle from skating trials at −3–−5°C (Lever and others, Reference Lever2022) with best-fit lines for each skate type; (b) Ice pressure-melting equilibrium curve (Wagner and others, Reference Wagner, Riethmann, Feistel and Harvey2011) compared with drop-ball hardness (Barnes and Tabor, Reference Barnes and Tabor1966; Poirier and others, Reference Poirier, Lozowski and Thompson2011) and skating-trial data. The dashed line shown on (b) is the model's baseline contact pressure, pc = 0.5 pm(Ti).

Barnes and Tabor (Reference Barnes and Tabor1966) and Poirier and others (Reference Poirier, Lozowski and Thompson2011) conducted drop-ball hardness tests on ice to measure average hardness vs ice temperature, H(Ti). Lever and others (Reference Lever, Taylor, Hoch and Daghlian2019) fit the data of Barnes and Tabor with a hyperbolic equation, H(T i) = 250[((273.15 − T i)/273.15)2 − 1]1/2, and Poirier and others fit their own data with a linear equation, H(T i) = −0.6T i + 14.7, where H has units of MPa for both equations. These equations pass near the upper and lower ranges of the skate data, with Barnes and Tabor curve higher than that of Poirier and others (Fig. 5b). Lozowski and Szilder (Reference Lozowski and Szilder2013) used the curve by Poirier and others (Reference Poirier, Lozowski and Thompson2011) for their skate-friction model.
Ice-indentation research also offers guidance on contact pressures. Peak crushing pressures at HPZs are 50–120% of the melting pressure at the bulk-ice temperature, pm(Ti) (Gagnon and Molgaard, Reference Gagnon and Molgaard1991; Gagnon, Reference Gagnon1994a; Wells and others, Reference Wells, Jordaan, Derradji-Aouat and Taylor2011; Kim and others, Reference Kim, Golding, Schulson, Løset and Renshaw2012; Browne and others, Reference Browne, Taylor, Jordaan and Gurtner2013; O'Rourke and others, Reference O'Rourke, Jordaan, Taylor and Gürtner2016). Using pressure-sensing arrays, Wells and others (Reference Wells, Jordaan, Derradji-Aouat and Taylor2011) measured peak average pressures of 15–60 MPa and peak maximum pressures of 32–122 MPa at HPZs under a spherical indenter for tests at −10°C, where pm(−10°C) = 110 MPa. Pressure maps shown by Browne and others (Reference Browne, Taylor, Jordaan and Gurtner2013) show similar relationships of peak and average HPZ pressures.
Based on these considerations, we somewhat arbitrarily select pc = 0.5 pm(Ti) as baseline conditions. This baseline is reasonable relative to the data from ice-indentation tests, drop-ball tests, and hockey-skate glides. It is a bit low relative to the data from short-track skating trials. To reflect these uncertainties, we examined the influence of pc on predicted skate friction.
Note that Barnes and Tabor (Reference Barnes and Tabor1966) and Poirier and others (Reference Poirier, Lozowski and Thompson2011) drop-ball data show that high-rate indentation hardness can exceed the equilibrium pressure-melting curve for temperatures close to 0°C. Also, measured peak pressures during indentation tests have exceeded the bulk-ice melting pressure. That is, ice does not instantaneously lose its integrity (liquify) as applied pressure exceeds the melting pressure but requires latent heat and its attendant heat-transfer time to transition from a crystalline solid to a liquid. Our choice of pc = 0.5 pm(Ti) may thus underestimate contact pressure near 0°C.
The contact pressure sets the melting temperature of the slurry: Ts = Tm(pc). This quantitatively couples pressure melting into the model. We use the equilibrium pressure-melting equation by Wagner and others (Reference Wagner, Riethmann, Feistel and Harvey2011) to compute pm(Ti) and its inverse, Ts = Tm(pc). Figure 6 shows the resulting relationship of Ts to Ti. For example, on −5°C ice, pm(−5°C) = 60 MPa, so pc = 30 MPa and Ts = −2.36°C.
Slurry melting temperature and quasi-steady blade-bottom temperatures measured by Colbeck and others (Reference Colbeck, Najarian and Smith1997).

Colbeck and others (Reference Colbeck, Najarian and Smith1997) embedded a thermocouple flush with the bottom of a skate blade and measured temperatures during gliding and normal strides. Blade temperatures rose from the ice temperatures to quasi-steady plateau values, with ±0.3–0.5°C fluctuations, within 30–80 s. Blade-bottom quasi-steady temperatures remained well below 0°C, although the thermal pulses synched with the strides, and faster skating produced warmer temperatures. Colbeck and others argued that the thermocouple averaged blade temperatures over its vertical height. The resulting measurements would thus have been colder than the blade-ice interface temperatures. Given this consideration, the measurements are in reasonable agreement with the model's predicted slurry temperatures (Fig. 6).
4. Model results
4.1 Baseline conditions
We established three baseline conditions, two representing our skating trials for hockey and short-track speed skates (Lever and others, Reference Lever2022) and one representing long-track speed skates tested by de Koning and others (Reference de Koning, de Groot and van Ingren Schenau1992). Table 1 summarizes the baseline parameters.
Baseline skater parameters and model friction predictions

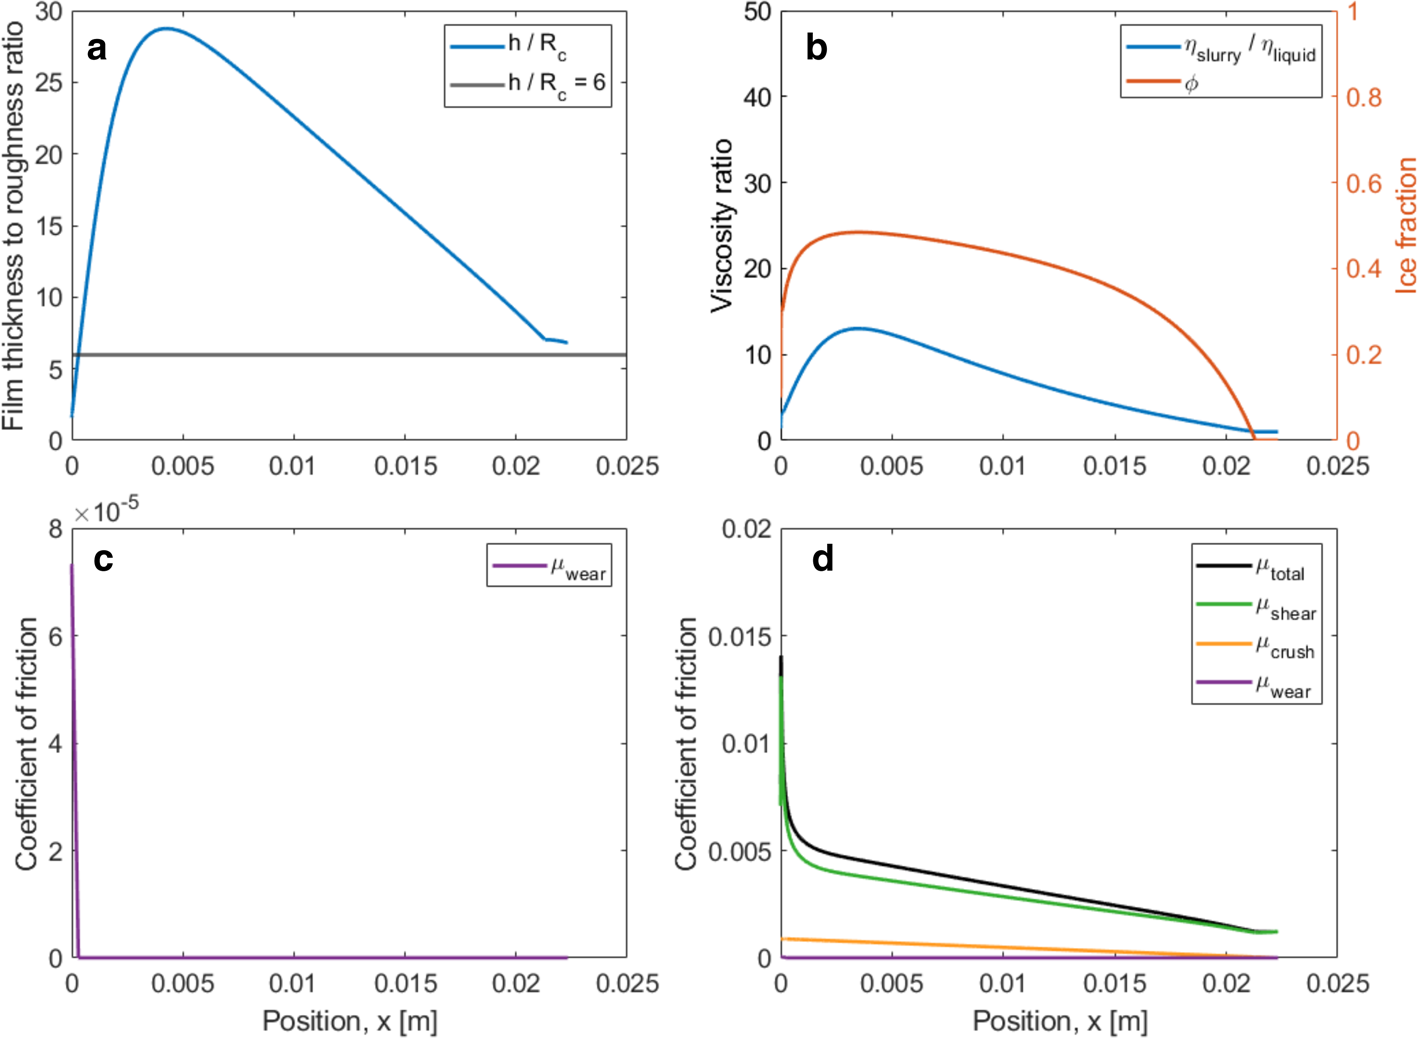
Figures 7–9 show the predicted variations in slurry properties and friction contributions along the blade for each baseline case. We set the contact width, w, for the two speed-skate blades equal to their measured blade widths. However, rut widths formed by the hockey skate during our skating trials (Lever and others, Reference Lever, Asenath-Smith, Taylor and Lines2021) showed large variations in the apparent contact width owing to significant spalling from the blade edges, with 1.5 mm (half of its blade width) a reasonable average value used here.
Model predictions for the baseline hockey skate as functions of position along the blade from the front of the contact zone.

Model predictions for the baseline short-track speed skate.
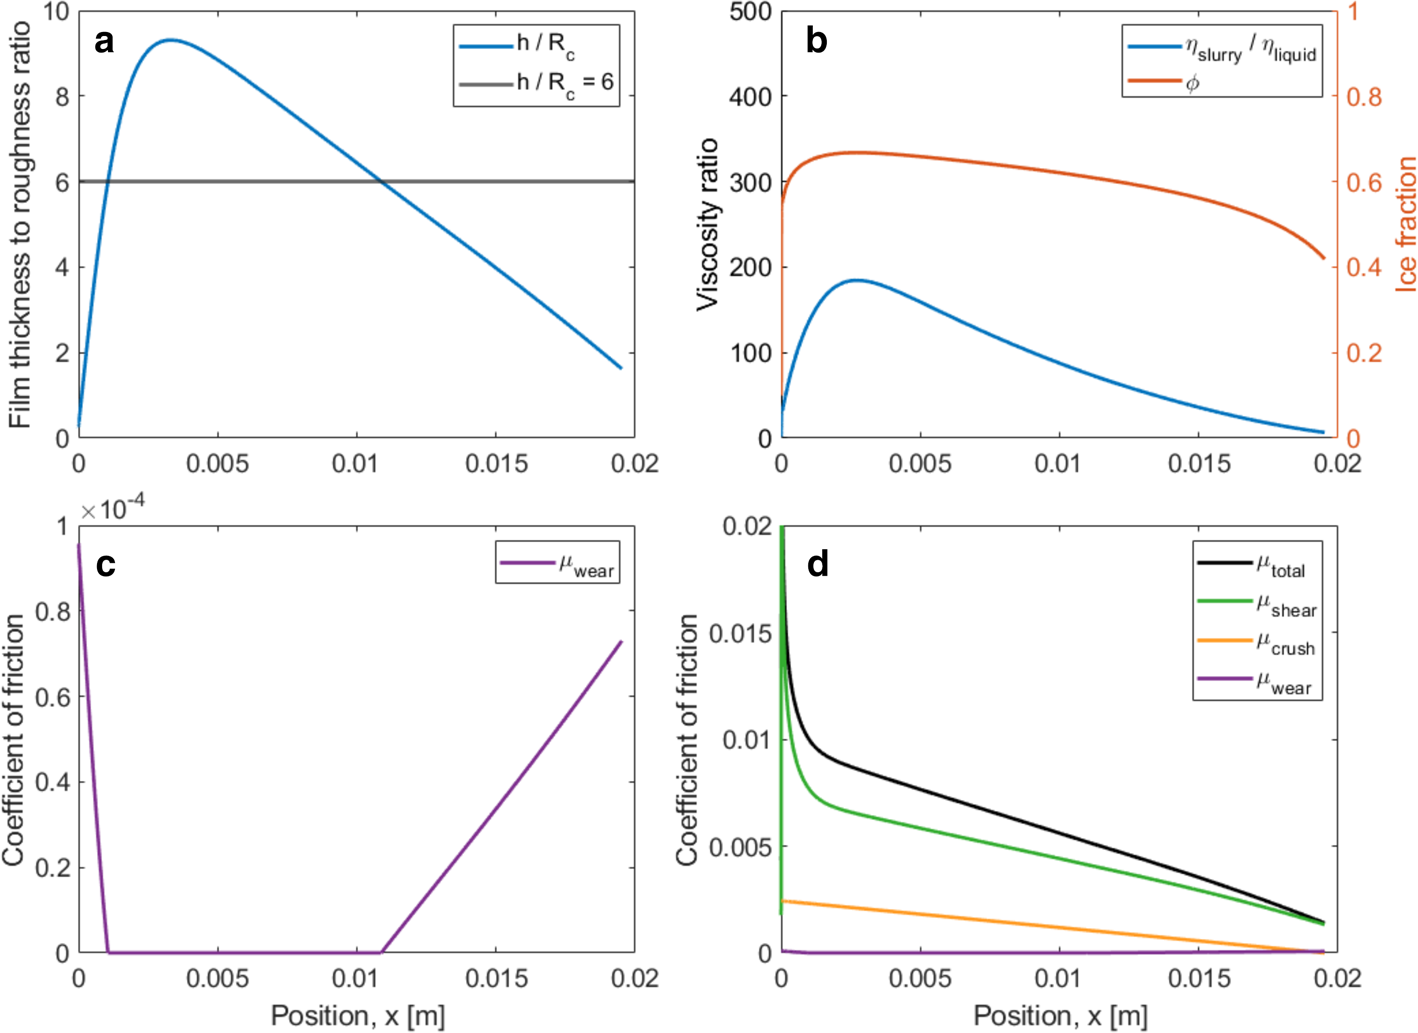
Model predictions for the baseline long-track speed skate.
We separately investigated the effect on friction of heat conduction into the blade and found it to be negligible after about four strides (see Section 4.5). Consequently, the baseline results ignore blade heat conduction.
Several features of these baseline results are worth noting:
• The total friction values for all three cases are reasonably consistent with the range of measured skate-friction values. The predicted hockey-skate value of μ = 0.0097 at 4 m s−1 is higher than that measured by Federolf and others (Reference Federolf, Mills and Nigg2008) of μ = 0.0071 ± 0.0005 at ~2 m s−1. The predicted long-track value of μ = 0.0032 is lower than that measured by de Koning and others (Reference de Koning, de Groot and van Ingren Schenau1992) for straightaway strides of 0.0046 ± 0.0004, although the touch-down and push-off spikes increased average friction relative to the glide portions of each stride. We are unaware of friction measurements for short-track speed skates, but their intermediate rocker radius suggests that the predicted value of μ = 0.0059, lying between hockey and long-track friction, is reasonable.
• Longitudinal viscous shear is the major contributor to skate friction, with crushing friction also important for the shorter-radius hockey and short-track blades.
• Friction from abrasive wear is negligible for all blades at the baseline conditions. This results from a combination of low wear coefficient (kA = 10−4) and thick mid-blade slurry films relative to blade composite roughness (abrasion is zero for (h/R c) > 6). Note that the model predicts abrasive wear at the rear of the contact zones for both the hockey and short-track blades, consistent with observations of striations left by these blades on their ruts (Lever and others, Reference Lever2022).
• The lubricating films consist of micron-thick viscous slurries, with peak viscosity ratios ranging from 320 for the hockey skate to 13 for the long-track skate. The film thicknesses are much thicker than those predicted for liquid-water films (Lozowski and Szilder, Reference Lozowski and Szilder2013; Lever and others, Reference Lever2022). These thicker films counterbalance higher film viscosities, compared with meltwater, to produce low skate friction.
• The slurry ice-fraction rapidly rises at the front of the blade from φ = 0 to values ranging 0.4–0.7 and then slowly decreases along the blade. Interestingly, this rapid convergence produces identical results whether the model begins with φ = 0 or φ = 1 at the front of the contact zone.
• Only at the very rear of the long-track blade does ice fraction drop to zero and bulk-ice melting occur. The depth of ice melted is negligible compared with the rut depth produced by crushing.
• As with self-lubrication models, rut depths are greater than slurry-film thicknesses owing to the latter's reduction by the lateral squeeze flow required to support the contact pressure.
4.2 Parametric and sensitivity studies
We independently varied several input parameters (skater speed and mass, ice temperature) and model parameters (slurry viscosity, contact pressure, Archard wear coefficient) while keeping the other parameters at their baseline values. Figures 10 and 11 show the effects of each variation on the predicted blade-averaged friction components and total friction for the hockey and long-track blades. The results are similar for the short-track blade.
Predicted hockey-skate friction components and total friction for variations in input and model parameters. Included here is the equivalent friction of squeeze flow (Section 4.3) to compare with crushing friction.

Predicted long-track-skate friction components and total friction for variations in input and model parameters.

Except for viscosity, variations were in physical units. Because the first three terms in the Thomas Eqn (27) have theoretical foundations for dilute slurries $( \varphi {\rm \lesssim }0.1)$ , we varied the exponential multiplier 0.1–10 × relative to its baseline value of 0.00273, to vary slurry viscosity at high ice fraction where greater uncertainty exists. Table 2 summarizes the sensitivity of predicted total friction on each parameter (ratio of percent change in total friction to percent change in input or model parameter) for small (± 10%) variations near baseline conditions.
Sensitivity of predicted total friction to small variations in input or model parameters near baseline conditions

Table values are the ratio of percent change in μ to the percent change in each parameter, with other parameters held at baseline conditions.
The model predicts similar friction variations for each blade type resulting from variations in input and model parameters. Because the model couples the influence of several mechanisms, we may only approximately attribute changes in predicted friction to each mechanism. Nevertheless, the following are common effects for all blade types:
• Increasing skater speed generally increases friction owing to higher shearing friction (Eqn (20)). An exception is for long-track skates, where friction increases at speeds below ~3 m s−1 primarily because low shearing rates melt less ice, which preferentially increases slurry viscosity from its relatively low value under baseline conditions.
• Friction increases nearly linearly with skater mass. Because we kept contact pressure at its baseline value, higher skate mass increases both crushing and shearing friction. Note that this result is inconsistent with measurements by Federolf and others (Reference Federolf, Mills and Nigg2008), who found that increasing normal load slightly decreased friction on standard hockey blades.
• Friction is relatively insensitive to ice temperature below ~ −5°C then increases significantly as temperatures approach 0°C. Ice temperature primarily influences predicted friction through the modeled relationship pc = 0.5 pm(Ti). Warmer temperatures result in softer ice, which slightly increases crushing friction and thereby ice mass introduced into the slurry. However, the main influence is on shearing friction through lower pc in the denominator of Eqn (20). De Koning and others (Reference de Koning, de Groot and van Ingren Schenau1992), Kobayashi (Reference Kobayashi1973) and Tusima (Reference Tusima and Ghrib2011) all measured higher friction on long-track blades near 0°C, although the results show significant scatter. Also, because the baseline results ignore blade heat losses, the model does not predict the slight increase in skate friction measured by de Koning and others (Reference de Koning, de Groot and van Ingren Schenau1992) at temperatures below ~ −7°C.
• Increasing contact pressure significantly decreases predicted friction. It essentially reverses the effects noted for temperature: higher pressure reduces the dominant shearing friction through pc in the denominator of Eqn (20). To a lesser extent, higher pressure decreases crushing friction and slurry mass fraction.
• Slurry viscosity can influence friction, although the effects are modest even for an order-of-magnitude increase or decrease in the exponential multiplier relative to its baseline value. Increased film thickness, via reduced squeeze flow, largely compensates for increased viscosity to minimize the resulting increase in friction.
• Variations in the Archard wear coefficient have little influence on friction for all three blades. Abrasive wear, as modeled, is not a significant skate-friction mechanism owing to the thick slurry films developed relative to blade roughness.
• Except for contact pressure (and temperature, through its influence on contact pressure), the model attenuates variations in its parameters (Table 2). That is, percentage variations in most parameters produce smaller percentage variations in predicted friction. The higher sensitivity of predictions to contact pressure suggests a need to understand the formation of HPZs under skate blades to reduce the dominant source of uncertainty in the model predictions.
Figure 12 compares model predictions for long-track blades against measurements by Kobayashi (Reference Kobayashi1973), de Koning and others (Reference de Koning, de Groot and van Ingren Schenau1992), Tusima (Reference Tusima and Ghrib2011). The model predictions use baseline values, which mimic test conditions by de Koning and others.
Comparison of model predictions for long-track speed skates with data as functions of (a) speed and (b) ice temperature. Other model properties are baseline values.

Predicted friction variations with speed (Fig. 12a) agree reasonably well with measurements by de Koning and others (Reference de Koning, de Groot and van Ingren Schenau1992), again noting that the measurements include higher friction at blade touch-down and push-off whereas the model reflects the glide portion of each stride. The measurements by Tusima (Reference Tusima and Ghrib2011) were at −3°C rather than the baseline of −5°C, and higher predicted friction at warmer temperatures would likewise improve agreement.
The model does not agree well with measured friction vs temperature (Fig. 12b). The data by de Koning and others show less scatter and less variation with temperature than those by Kobayashi, but the model overpredicts the increase in friction near 0°C and does not predict higher friction at temperatures below ~ −7°C. The over-prediction at warm temperatures is a consequence of setting pc = 0.5 pm(Ti), where pm(Ti) is an equilibrium-state variable that tends to zero at 0°C. As noted, average drop-ball hardness measured by Barnes and Tabor (Reference Barnes and Tabor1966) or Poirier and others (Reference Poirier, Lozowski and Thompson2011) show 15–20 MPa at −0.5°C rather than our modeled value of 3.4 MPa. As we discuss later, these higher average pressures could result from the time needed to transfer latent heat to melt the ice and would significantly lower predicted friction near 0°C.
4.3 Crushing vs squeeze energy
Indentation researchers have noted that the squeeze flow of ice-rich slurries extruded from HPZs accounts for the majority of work done by crushing (Jordaan and Timco, Reference Jordaan and Timco1988; Gagnon and Molgaard, Reference Gagnon and Molgaard1991; Gagnon, Reference Gagnon1994b, Reference Gagnon2016). We wanted to assess whether this relationship held true within our skate model. We may convert the energy dissipated in squeeze flow to an equivalent friction value based on its incremental work (Eqn (24)) per unit of forward displacement:

Figures 9 and 10 reveal that this equivalent squeeze friction plots just below crushing friction across the entire range of model parameters investigated. The only small divergence results from a hundred-fold increase in the Archard coefficient, which provides ice particles to the slurry independently of crushing. However, the rate of energy deposition along the blade is quite different for crushing and squeeze (Fig. 13). Crushing energy peaks at the front of the contact zone, while squeeze energy peaks slightly rearward of peak film thickness, reflecting its h 3 dependence in Eqn (39).
Distribution along blade of crushing friction vs equivalent squeeze-flow friction for baseline conditions: (a) hockey skate; (b) long-track speed skate.

Although our skate model couples crushing and squeeze with longitudinal shearing and ice-fraction dependent slurry viscosity, blade-averaged crushing and slurry-squeeze energy (friction) are quantitatively nearly identical. Integrating the film-thickness Eqn (29a) along blade demonstrates why:

For each term, $\int_0^l {\mu ( x ) {\rm d}x = \bar{\mu }l}$ , the average friction contribution along the blade, so rearranging the terms yields:

Wear friction is negligible for all baseline cases, and $( h( l ) /l) \sim \;0.015\,\bar{\mu }_c$ , for the hockey skate and $( h( l ) /l) < \;0.01\bar{\mu }_c$
 for both speed skates. The dominant viscous energy from longitudinal shearing reduces film viscosity and hence thickness towards the rear of the blade to cause $( h( l ) /l) \ll \bar{\mu }_c$
 for essentially all cases. That is, $\bar{\mu }_{sq}\approx \bar{\mu }_c$
 despite very different spatial distributions of crushing and squeeze friction along the blade.
4.4 Ice heat losses
Heat loss from the slurry film into the ice (Eqn (25)) reduces the heat available to melt ice within the slurry. This heat loss, together with heat losses into the blade, could account for the measured rise in skate friction at low ambient temperatures (Kobayashi, Reference Kobayashi1973; de Koning and others, Reference de Koning, de Groot and van Ingren Schenau1992). However, our model as formulated does not predict higher friction at low temperatures. To understand why, we may form an equivalent friction coefficient:


For a given skater, U and l are constant, and neglecting small temperature effects on k i and κ i, the equivalent ice heat-loss friction, $\bar{\mu }_{ice}$ , varies as ΔT i/p c, where ΔT i = T s − T i. Our model links slurry temperature and contact pressure with the ice temperature via pc = 0.5 pm(Ti), and T s = T m(p c). Both ΔT i and p c increase with decreasing ice temperature, and the ratio ΔT i/p c increases only slightly, so $\bar{\mu }_{ice}$
 varies little with temperature. For the baseline long-track speed skates, $\bar{\mu }_{ice}( {-1^\circ {\rm C}} )$
 = 0.00042 and $\bar{\mu }_{ice}( {-20^\circ {\rm C}} )$
 = 0.00064. The difference is small relative to the predicted total friction of μ = 0.0032 at −5°C, and apparently coupling in the model through the ice-fraction dependence of slurry viscosity further attenuates temperature effects on heat losses into the bulk ice.
4.5 Blade heat losses
Heat loss from the slurry film into the blade (Eqn (26)) also reduces the heat available to melt ice within the slurry. Blade losses are a maximum as the blade touches down during each stride, but the scale of these losses depends on the temperature history of the blade. We examined this effect by formulating a 1D transient-conduction simulation, with Ts imposed at the blade bottom during ice contact and no heat transfer when the blade is off the ice. We approximated these durations using kinematic measurements by Marino (Reference Marino1977): Δtcontact = 0.5 s and Δtlift = 0.3 s. At the start of the simulation, the blade temperature was set to the ambient (ice) temperature, Ti.
Figure 14 shows the evolution of blade-bottom temperature, T(0), during the first four strides at −5°C ambient temperature and 4 m s−1. During the contact periods, heat conducts into the blade from the imposed Ts = Tm(30 MPa) = −2.36°C. During each lift-off period, the pulse of heat propagates into the blade and the blade-bottom temperature cools down. Each successive heating pulse diminishes in scale as the blade gradually warms up. Figure 14 also shows the evolution of temperature over the bottom 3 mm of the blade, TTC, as might be measured by a thermocouple (per Colbeck and others, Reference Colbeck, Najarian and Smith1997), which averages the propagation of the temperature pulses.
Evolution of blade-bottom temperature, T(0), and equivalent blade friction coefficient, during the first four strides at −5°C and 4 m s−1.

To characterize the influence of blade heat losses, we may form an equivalent friction coefficient:

where the blade heat flux q b = −k b(ΔT/Δz)z=0 and k b is blade thermal conductivity (15 W m−1 K−1 for 304 stainless steel). By comparison, $q_b = {-}( k_b\Delta T_0/\sqrt {\pi \kappa _bt} )$ for continuous gliding (e.g., sled deceleration tests), where ΔT 0 is the initial blade-slurry temperature difference, κ b is blade thermal diffusivity (4.0 × 10 6 m2 s−1) and t is the duration of sliding.
As shown in Figure 14, pulsed heating during each stride produces higher blade-friction pulses than continuous sliding for the same duration. Lever and others (Reference Lever2022) noted that these heat pulses complicate attributing the higher touch-down friction measured by de Koning and others (Reference de Koning, de Groot and van Ingren Schenau1992) to greater ice penetration. Nevertheless, after four strides, the equivalent pulsed friction drops below 10−4 and is thus negligible relative to crushing and shearing friction. Even for ambient temperatures of −20°C, the pulsed friction after four strides is below 4 × 10⁻⁴. Thus, the modeled 1D blade heat losses cannot account for higher measured skate friction at lower ambient temperatures.
4.6 Indentation without sliding
We may apply our model to the case of indentation without sliding to explore the role of viscous shearing on slurry properties. Furthermore, we may use ice-indentation results to validate the model, in part, at the upper range of ice fraction.
In the absence of forward motion, abrasive wear and longitudinal shearing do not occur. We may also neglect heat transfer into the ice and the blade. Equation (29a) for the change in film thickness thus becomes:

and the simplified energy budget reduces the ice-fraction Eqn (36) to

Ice-indentation tests often seek to produce sawtooth force patterns to mimic field indentation measurements, with a compliant test apparatus storing and abruptly releasing strain energy and causing variations in penetration rates. Stiffening the apparatus and increasing indentation speed reduce these fluctuations (Jordaan and others, Reference Jordaan, Xiao, Wells and Derradji-Aouat2008; Browne and others, Reference Browne, Taylor, Jordaan and Gurtner2013; O'Rourke and others, Reference O'Rourke, Jordaan, Taylor and Gürtner2016). For the case of constant-rate penetration, we may set (dh/dt) = (dφ/dt) = 0 to predict steady-state conditions:


where v is the indentation rate. Here, the steady-state ice fraction, φ ss, depends only on ice temperature because we have set T s = T m(p c), with p c = 0.5p m(T i). The middle term on the right side of Eqn (48) is the ratio of crushing work to latent heat, which melts ice particles in the slurry to reduce ice fraction. The third term captures the effect of sensible heat to reduce melting and is less significant.
For indentation without sliding, φ ss = 0.92 at $T_i = {-}5^\circ {\rm C}$ , which corresponds to (η s/η 0) = 1.1 × 10⁴. Sliding and the resulting viscous shearing significantly reduces ice fraction in the slurry, with φmax = 0.48–0.70 and consequently (η s/η 0)max = 13–310 for the baseline skaters (Table 1).
Gagnon and Molgaard (Reference Gagnon and Molgaard1991) and Gagnon (Reference Gagnon1994b, Reference Gagnon2016) conducted ice-indentation tests at −9°C and −10°C, respectively, and estimated liquid-water content of the resulting interfacial slurries as 12–20% (φ = 0.80 − 0.88). Equation (48) predicts ice fractions φss=0.84–0.86 at these temperatures, which agrees well with test values. However, the model predicts pc = 50–55 MPa, whereas these researchers estimated average contact pressures as 70–90 MPa or much higher than 50% of the corresponding melting pressures of 100–110 MPa. Furthermore, the indentation tests produced sawtooth force and indentation-rate patterns rather than the constant rates used to predict φ ss here.
Gagnon (Reference Gagnon1994a, Reference Gagnon1994b) also estimated slurry-film thickness using the squeeze-flow expression for a circular plate of radius, r,

and obtained h ~ 2–8 μm across the rising and falling portions of the sawtooth motion. However, Gagnon used the viscosity of water at 0°C (1.75 mPa s) rather than the much higher viscosity of an ~80% ice-fraction slurry. By comparison, our model predicts h ~ 120 μm at the average indentation velocity owing to ~3 × 10³ increase in slurry viscosity. Interestingly, Gagnon (Reference Gagnon1994a) mounted a conductance sensor at the indenter interface to measure the film's thickness and obtained an average value of 12 μm over the sawtooth cycles. Gagnon calibrated the sensor using liquid-water films. If we agree with Gagnon (Reference Gagnon2016) that the sensor measured the equivalent liquid content of the slurry, we would estimate a liquid fraction of 12/120 ~ 10%, similar to the model prediction of 1–φss = 16%.
Interestingly, Eqn (47) indicates that dz c = dh sq for constant-rate indentation and consequently indentation crushing energy, dE c = wlp cdz c, equals the energy dissipated by squeeze flow, dE sq = wlp cdh sq. Ice-indentation researchers have noted that this holds approximately true over a cycle of periodic crushing and extrusion (Jordaan and Timco, Reference Jordaan and Timco1988; Gagnon and Molgaard, Reference Gagnon and Molgaard1991; Gagnon, Reference Gagnon1994b, Reference Gagnon2016).
5. Discussion
We have formulated a model to test the hypothesis that lubrication by an ice-rich slurry can account for the characteristically low friction of ice skates. The model couples the mechanics of crushing, abrasion, pressure melting, longitudinal shearing and lateral squeeze flow, together with the ice-fraction dependence of slurry viscosity, to predict skate gliding friction. It utilizes insight from extensive ice-indentation tests that reveal the formation and extrusion of ice-rich slurries at HPZs under an indenter, with contact pressures approaching or exceeding the melting pressure of the bulk ice. It also relies on insight and data from recent skating trials that demonstrated the ubiquitous effects of brittle ice failure under both hockey and speed-skate blades, including abundant spalling from the blade edges and lateral and longitudinal variations in rut temperatures and cross-sections. To the extent that our simple 1D model captures the overall energetics of these complex processes, the results support the hypothesis that an ice-rich slurry can form an efficient lubricating film to account for low skate friction across a broad range of conditions.
Despite coupling several mechanisms, the model is quite simple and mimics the formulation by Lozowski and Szilder (Reference Lozowski and Szilder2013). Although that earlier model independently treated crushing and omitted abrasion, its meltwater-lubrication mechanics included a similar feedback mechanism by coupling viscous heating, bulk-ice melting, and film thickness governed by squeeze flow. Moreover, its extended version (Lozowski and others, Reference Lozowski, Szilder and Maw2013) provided remarkably good agreement with the speed-skate friction measurements by de Koning and others (Reference de Koning, de Groot and van Ingren Schenau1992). However, it predicted liquid films too thin to separate blade asperities for most skating conditions (Lever and others, Reference Lever2022). This situation poses two concerns: the thin films relative to blade roughness violate the modeled smooth-surface fluid mechanics for squeeze flow and shearing; boundary or mixed-mode friction, with attendant higher friction and wear, would be likely (Lever and others, Reference Lever, Asenath-Smith, Taylor and Lines2021).
Importantly, self-lubrication models (Lozowski and Szilder, Reference Lozowski and Szilder2013; Le Barre and Pomeau, Reference Le Barre and Pomeau2015; Van Leeuwen, Reference van Leeuwen2017) assume that a hydrodynamic meltwater film develops at the front of the contact zone without describing how dry-contact crushing and abrasion evolve to lubricated contact. Our model explicitly tracks this evolution, from high ice-fraction near the front of the blade through reduced values resulting from energy dissipated within the slurry. Despite very high dissipation from the combination of high viscosity, thin film and high crushing rate, ice fraction does not rapidly drop to zero but stays within the range φ ~ 0.4–0.7 where it strongly influences slurry viscosity. Even an order-of-magnitude increase in η s(φ) did not substantially change model results. Viscous shearing is insufficient to melt the pulverized ice particles that result from blade indentation. The energetics of these processes, at least as modeled, contradict the hypothesis that meltwater films govern skate friction.
The model here couples the key mechanics of film lubrication with those governing brittle ice indentation:
• Blade-ice contact occurs at pressures sufficient to depress the melting temperature of the ice within the slurry.
• Brittle crushing and abrasion introduce fine ice particles into the slurry, which preferentially melt under the action of viscous shearing compared with melting of the underlying bulk ice. The energy dissipated by crushing and abrasion adds to that of longitudinal shearing.
• The ice-fraction-dependent slurry viscosity couples with the mass and energy budgets to evolve the slurry properties along the blade. The resulting film viscosity and thickness are much larger those than predicted for meltwater films but compensate each other to yield low skate friction.
• Abrasion, while a small friction component, can occur at the front and rear of traditionally ground or filed skate blades when the film thickness drops below the requirement for hydrodynamic lubrication (h/R c > 6). The model predicts abrasion at the rear of hockey and short-track blades under baseline conditions, consistent with observed striations left in the ruts after glide passes (Lever and others, Reference Lever2022).
Model predictions are remarkably insensitive to most input and model parameters. The rapid convergence and general insensitivity of the model reflects the strong feedback between ice fraction and viscous heating and helps to explain why skates are slippery across such broad ranges of conditions. Importantly, the results are quite insensitive to the viscosity dependence of the slurry at high ice fraction, where data are lacking to assess the applicability of the Thomas Eqn (27). Even 100% increase in the viscosity multiplier increases baseline skate friction by 10% or less (Table 2). Ice-rich slurries with high ice fraction and high shearing rates could exhibit unusual behavior compared with other solid-liquid slurries. Unlike other solids, high stresses at ice-particle contacts could depress the melting temperature and cause micro-fracture or wear, which potentially would reduce contact stresses and hence the potential for jamming or shear-localization (thin shear bands). Also, although high solid-fraction ice slurries show Bingham behavior, the high shear rates during skating should favor Newtonian-fluid behavior by dominating over the plastic shear threshold.
The most significant uncertainties in the model relate to the assumed contact pressure between the blade and the ice and the simplifying assumption of 1D contact mechanics. Indeed, the assumption of constant contact pressure, also made by Lozowski and Szilder (Reference Lozowski and Szilder2013), is incompatible with the parabolic pressure distribution developed under squeeze flow for a Newtonian fluid. Based on observations (Lever and others, Reference Lever2022), HPZ contact pressure is likely to vary laterally and longitudinally, and ice-fraction dependent viscosity could vary longitudinally, vertically and laterally through the film based on local pressure and viscous shearing. In principle, these 2D and 3D complications could be addressed though more sophisticated modeling. More critical in the near term, however, is to verify through observations that an ice-rich slurry forms beneath a skate blade and governs its friction mechanics. Ice-indentation studies offer guidance on how we may undertake such observations, which could then be used to guide model refinements. Meanwhile, the current 1D model appears to capture the overall energetics of skate friction using coupled mechanics that are more consistent with skate-mechanics observations and ice-indentation research than the hypothesis of meltwater lubrication.
At present, no direct observations confirm that a liquid, meltwater film lubricates a skate to govern its friction. Owing to its low viscosity, water is considered a poor lubricant (Kinoshita and others, Reference Kinoshita, Nishina, Alias and Fujii2014; Rahman and others, Reference Rahman2021), although melting of the ice substrate compensates for high squeeze flow within self-lubrication models. The thicker slurry films predicted here are more consistent with the mechanics of Couette and squeeze flow provided the slurry behaves as a Newtonian fluid. The predicted average ice fractions for baseline conditions (φ ~ 0.4–0.6) fall within the range of the Thomas equation, and peak values lie only slightly beyond (φ ~ 0.7, Table 1). Nevertheless, 1D skate models, including ours, cannot account for the observed longitudinal and lateral variations in observed rut temperatures, which reflect the mechanics of brittle crushing under the blade (Lever and others, Reference Lever2022).
The model's poor agreement with the measured temperature-dependence of friction suggests that the model does not capture some important effects. Over-prediction at warm temperatures derives from the simple assumption that the contact pressure is a fixed fraction of the bulk-ice melting pressure, pc = 0.5 pm(Ti), which drives the dominant shearing friction high as p c → 0 (Eqn (20)). Melting pressure is an equilibrium-state variable, whereas the blade rapidly crushes the ice and pressurizes the slurry. Some time is required to transfer heat to melt ice, during which time the ice could retain a crystal structure strong enough to support pressures higher than pm(Ti). As noted, drop-ball hardness measurements by Barnes and Tabor (Reference Barnes and Tabor1966) indicate that pc > pm at temperatures warmer than about −3°C (Fig. 5). Some ice-indentation tests also show maximum local pressures higher than the bulk-ice melting pressure (Gagnon and Molgaard, Reference Gagnon and Molgaard1991; Wells and others, Reference Wells, Jordaan, Derradji-Aouat and Taylor2011). That is, for rapid indentation by a skate blade, ice near 0°C could retain sufficient integrity to create HPZs with average pressures much higher than given by pc = 0.5 pm(Ti). This would significantly reduce the predicted friction at warm ice temperatures.
Similarly, the model under-predicts friction at low temperatures. Again, the choice of pc = 0.5 pm(Ti) plays a role, as the resulting values steadily increase with decreasing temperature to decrease shearing friction (Eqn (20)). Also, blade heat losses under real skating could exceed the modeled 1D transient losses (Section 4.5), for example, as ice crystals commonly seen on blades enhance lateral heat transfer. Additionally, sliding heat-source theory indicates that contact on isolated HPZs, compared with uniform 1D contact, would direct more frictional heat into the blade (Lever and others, Reference Lever, Taylor, Hoch and Daghlian2019).
Despite uncertainty in the average contact pressure, we are persuaded by ice-indentation research that pressure melting should be included in skate-friction mechanics. Colbeck (Reference Colbeck1995) specifically dismissed pressure melting as an important process during skating. He argued that pressures needed to significantly reduce the melting point exceeded the crushing strength of ice, although his work largely predated discovery of HPZs via indentation tests. Colbeck (Reference Colbeck1995) made two other arguments refuting pressure melting during ice skating: (1) that heat conduction from the ambient to the interface is required and is weak compared with frictional heat generated at the interface, and (2) that any liquid-water films would be squeezed to small thicknesses by the high pressures required for pressure melting. Both arguments warrant reconsideration if the fluid at the interface consists of an ice-rich slurry.
As noted, skate-bottom temperature measurements by Colbeck and others (Reference Colbeck, Najarian and Smith1997) remained well below 0°C during skating strides and gliding. Figure 6 shows that they are more consistent with an ice-rich slurry melting under high pressure than with a blade-wide film of liquid water at 0°C. Note that after the skate passes and applied pressure drops to zero, the slurry film remaining in the rut would refreeze at 0°C. That is, accurate blade-ice contact temperatures can only be determined during, and not after, blade passage.
Because skate friction is characteristically low $( \mu {\rm \lesssim }0.01)$ , the vast majority of applied loads act downward on the ice. Comparisons with ice-indentation results offer some evidence that our model captures the basic energetics of indentation and thus of skating. The indentation-only version of the model predicts similar slurry ice fractions (~80%) as those measured during indentation tests. The model also predicts that blade-averaged crushing energy and squeeze-flow energy are nearly identical, and are exactly identical for steady-state indentation without sliding, consistent with the findings that these energies are similar during indentation tests. Importantly, it may be possible to use the simpler test configuration of indentation without sliding to provide insight into 2D and 3D contact processes to formulate and constrain a more ambitious skate model.
Interestingly, Canale and others (Reference Canale2019) appear to have confirmed the presence of lubricating ice-rich slurries under a vibratory slider. They measured the nano-scale tribology and rheology of ice-slider interfaces using a ‘stroke-probe’ tribometer consisting of a smooth glass bead mounted to a double-mode tuning fork. The resulting lubricating films were much thicker than QLLs and displayed viscoelastic behavior. Film viscosity-ratio ranged η s/η 0 ~ 1.1 − 45, increasing with velocity (0.005–0.92 m s−1) and temperature (−15 to 0°C). The corresponding range of ice fraction for such slurries, via the Thomas Eqn (27), would be φ ~ 0.04 − 0.58. Canale and others suggested that ‘… under abrasive wear, a suspension of liquid and submicron … debris is formed, hence resulting in composite lubrification of the contact’ and that the observed increase in friction and viscosity with temperature ‘… may be interpreted as an increasing density of ice fragments when the ice becomes softer close to the melting point.’
In a broader context, Lever and others (Reference Lever, Asenath-Smith, Taylor and Lines2021) suggested that ice-rich slurries potentially offer a unifying hypothesis for ice and snow friction by relating the transition from dry to fully- lubricated contact through increasing water-content, while linking the relative importance of crushing, abrasion, pressure melting and viscous shearing to sliding-system properties. Indeed, tribometer studies face a fundamental difficulty that friction modes (dry, boundary, mixed, lubricated) can vary with position along a slider and duration of sliding. The existence of different modes introduces a scaling requirement not generally acknowledged for laboratory ice- and snow-friction tests: to isolate and separately scale the contributions from each mode to extrapolate to full-scale systems. The common use of a ‘run-in’ period to achieve steady-state conditions complicates scaling to systems where the ice or snow substrate experiences only a single, brief passage of the slider, as for skates, tires and skis. We hope that the present framework, by explicitly modeling the evolution of contact from dry to lubricated through the mechanics of an ice-rich slurry, will help to resolve this scaling problem.
6. Conclusions
The presence of lubricating ice-rich slurries can account for the characteristically low friction of ice skates. This hypothesis couples the mechanics of brittle crushing, abrasion, pressure melting, longitudinal shearing and lateral squeeze flow, together with the ice-fraction dependence of slurry viscosity, to account for why skates are slippery across such broad ranges of skater speeds and masses and ice temperatures. Although the simple 1D model presented here is unlikely to capture the complex mechanics governing these processes, it appears to capture the basic energetics of skate friction and is more consistent with observations of blade-ice interactions, and with extensive ice-indentation research, than the hypothesis that a meltwater film governs skate friction. Clearly, direct observations are needed to confirm that ice-rich slurries form beneath skate blades and govern their friction. We suggest that the encouraging results of this simple 1D model justify undertaking such observations.
Acknowledgements
The authors thank Susan Taylor, Taylor, Garrett R. Hoch, Emily Asenath-Smith, Devinder S. Sodhi and Kathy Jones for their enthusiastic and tireless help to obtain the key observations during skating trials that informed the current modeling effort. We also thank Dick Dodds and the Hanover Improvement Society for the use of Campion Rink to obtain those observations within pandemic-related protocols. The authors appreciate the insightful comments by the scientific editor and the reviewers, which helped to improve the final manuscript. We are grateful for funding provided by the US Army Engineer Research and Development Center, Military Engineering Program under the Basic Research Portfolio.


 Open access

