


Impact Statement
Evolving nature of geospatial information systems (GISs) toward Wiki-like geography web systems (GWSs) makes it necessary to review the architectural foundations and building blocks of such systems to avoid common pitfalls known from Web 2.0 due to their critical functions at multiple types of governance levels. Dynamic geospatial knowledge graph described in this article was built to minimize the risks of deliberate misinformation while allowing for citizens’ web participation in urban planning processes.
1. Introduction
1.1. General context and problem space
Dynamic geospatial knowledge graphs that make use of existing standards (Radermacher, Reference Radermacher2020) ported to ontologies (Chadzynski et al., Reference Chadzynski, Krdzavac, Farazi, Lim, Li, Grisiute, Herthogs, von Richthofen, Cairns and Kraft2021) demonstrate the capabilities of scalable information systems based on sustainable digitization practices (Winkelhake, Reference Winkelhake2018) and enable interoperability (Buccella and Cechich, Reference Buccella and Cechich2007) between, otherwise, siloed datasets. As described by Chadzynski et al. (Reference Chadzynski, Li, Grisiute, Farazi, Lindberg, Mosbach, Herthogs and Kraft2022), such systems, coupled with intelligent automation based on cognitive architecture (Kotseruba and Tsotsos, Reference Kotseruba and Tsotsos2020), could aid efforts focused on finding answers to globally most pressing problems (United Nations Security Council, 2021) and existential threats (Ministry of the Environment and Water Resources, 2019). Both, the means and the ends, are recognized and agreed upon by the global governing bodies, such as the UN, G20, and the World Bank (Radermacher, Reference Radermacher2020), as well as many individual countries around the world (Chiang, Reference Chiang2012; Ates Aydar et al., Reference Ates Aydar, Stoter, Ledoux, Demir Ozbek and Yomralioglu2016; Al Kalbani and Abdul Rahman, Reference Al Kalbani, Abdul Rahman, Ben Ahmed, Rakıp Karaş, Santos, Sergeyeva and Boudhir2021; OGC Asia Forum – ShowCases, 2021; Wysocki, Reference Wysocki2021). There is also a recognition that, apart from the just mentioned capabilities as well as the capability to conduct complex multi-factor optimization scenarios at a city scale (Perera et al., Reference Perera, Javanroodi and Nik2021), urban modeling could serve as a tool for storytelling allowing decision makers to communicate the motivations behind policy implementations to wider audiences (Guhathakurta, Reference Guhathakurta2002). This, in turn, requires the design and development of appropriate interfaces to such knowledge graphs.
Cities Knowledge Graph (CKG; Cities Knowledge Graph – ResearchGate, 2021), an active research project collaboratively worked by the Cambridge Centre for Advanced Research and Education in Singapore (CARES; Cities Knowledge Graph – CARES, 2021) and the Singapore-ETH Centre (SEC; Cities Knowledge Graph – SEC, 2021), is an example of a dynamic geospatial knowledge graph based on sustainable digitization practices (Chadzynski et al., Reference Chadzynski, Krdzavac, Farazi, Lim, Li, Grisiute, Herthogs, von Richthofen, Cairns and Kraft2021). As a knowledge graph built around the Semantic 3D City Database (Chadzynski et al., Reference Chadzynski, Krdzavac, Farazi, Lim, Li, Grisiute, Herthogs, von Richthofen, Cairns and Kraft2021) that is a semantic equivalent of the 3D City Database (Yao et al., Reference Yao, Nagel, Kunde, Hudra, Willkomm, Donaubauer, Adolphi and Kolbe2018), originally developed at the Technische Universität München (TUM) for relational geospatial databases (Stadler et al., Reference Stadler, Nagel, König, Kolbe, Lee and Zlatanova2009), it is designed to produce and process multi-dimensional representations of urban environments modeled in accordance with the CityGML 2.0 standard by the Open Geospatial Consortium (OGC; Gröger et al., Reference Gröger, Kolbe, Nagel and Häfele2012). This knowledge persistence layer, developed to be compliant with the semantic web standards and recommendations provided by the W3C, is coupled with a system of intelligent autonomous agents (Chadzynski et al., Reference Chadzynski, Li, Grisiute, Farazi, Lindberg, Mosbach, Herthogs and Kraft2022) designed upon principles of a cognitive architecture (Langley et al., Reference Langley, Laird and Rogers2009).
CKG is a part of The World Avatar (TWA), a knowledge graph encompassing other micro- and macro-scale domains. This approach combines city-specific knowledge with knowledge from multiple heterogeneous domains and provides a comprehensive point of view applying to a feature under consideration. TWA has been already used for optimal site selection of modular nuclear power plants (Devanand et al., Reference Devanand, Kraft and Karimi2019), simulations of chemical kinetic reaction mechanisms (Farazi et al., Reference Farazi, Akroyd, Mosbach, Buerger, Nurkowski, Salamanca and Kraft2020), quantum chemistry calculations (Krdzavac et al., Reference Krdzavac, Mosbach, Nurkowski, Buerger, Akroyd, Martin, Menon and Kraft2019), combustion chemistry (Farazi et al., Reference Farazi, Akroyd, Mosbach, Buerger, Nurkowski, Salamanca and Kraft2020), and power systems optimization in eco-industrial parks (Devanand et al., Reference Devanand, Karmakar, Krdzavac, Rigo-Mariani, Foo, Karimi and Kraft2020). Cities are known to be one of the largest contributors into the global $ {\mathrm{CO}}_2 $
emissions due to their high energy demands, so far, mostly supplied by fossil fuels. A thorough understanding of those macrostructures, taking into account multiple points of view could optimize those energy demands (Malhotra et al., Reference Malhotra, Shamovich, Frisch and van Treeck2022) and reduce their carbon footprint (Eibeck et al., Reference Eibeck, Chadzynski, Lim, Aditya, Ong, Devanand, Karmakar, Mosbach, Lau, Karimi, Foo and Kraft2020). Knowledge graphs are designed to facilitate such interoperability as well as provide information that is usually inaccessible without combining multiple datasets.
$ {\mathrm{CO}}_2 $
emissions due to their high energy demands, so far, mostly supplied by fossil fuels. A thorough understanding of those macrostructures, taking into account multiple points of view could optimize those energy demands (Malhotra et al., Reference Malhotra, Shamovich, Frisch and van Treeck2022) and reduce their carbon footprint (Eibeck et al., Reference Eibeck, Chadzynski, Lim, Aditya, Ong, Devanand, Karmakar, Mosbach, Lau, Karimi, Foo and Kraft2020). Knowledge graphs are designed to facilitate such interoperability as well as provide information that is usually inaccessible without combining multiple datasets.
1.2. Human–computer interaction on the GeoWeb 2.0
A combination of issues related to data integration and the ability to easily update parts of existing models (Buyukdemircioglu and Kocaman, Reference Buyukdemircioglu and Kocaman2020) as well as collaborative work on them by multiple people simultaneously has been an Achilles’ heel of traditional GIS applications (Amović et al., Reference Amović, Govedarica, Radulović and Janković2021). This motivated research (Prandi et al., Reference Prandi, Devigili, Soave, Di Staso and De Amicis2015) and development (Chaturvedi et al., Reference Chaturvedi, Yao, Kolbe and Kersten2015) of GeoWeb services and applications that align geographical modeling closer with the rest of the modern software. Although the GeoWeb moves GIS into a new architectural pattern where data, applications and services are more openly available and accessible even to neo-geographers (Hudson-Smith et al., Reference Hudson-Smith, Crooks, Gibin, Milton and Batty2009) for content mashups, the service providers within the industry still emphasize the importance of standardization to facilitate interoperability (Dangermond, Reference Dangermond2008).
This new paradigm requires new interfaces allowing to enter new information, retrieve, remove, or correct existing information to the GeoWeb systems on a very large scale. The interfaces should be easy enough to operate as well as accessible to interested participants exposing feature-rich information systems without requiring extensive training or expertise. Interfaces to the traditional GIS should be extended or modified to adapt them to this new set of requirements. “Where once a geographer would pack a map, compass and notepad, the NeoGeographer merely needs a mobile device to explore, navigate, document, capture and log the environment” (Hudson-Smith et al., Reference Hudson-Smith, Crooks, Gibin, Milton and Batty2009). Web 2.0 proved to be able to integrate more traditional information systems as well as enable them for wider participation in the past. GeoWeb interfaces make use of similar human–computer interaction (HCI) principles and port proven existing designs to work with the new type of content (Roche et al., Reference Roche, Mericskay, Batita, Bach and Rondeau2012).
1.2.1. Computing environment for solution prototyping
The information system used for examples demonstrated in this article was deployed to a server with Microsoft Windows Server 2016 Standard as an operating system and 1 TB of storage space, 200 GB RAM as well as 2 Intel® Xeon® ES-2620 v3 @ 2.40 GHz CPUs. Out of the total 200, 32 GB of RAM is assigned solely to the Blazegraph™, deployed in Nano SPARQL Server mode. The dataset for Berlin examples has been provided by the Business Location Center via Berlin 3D Download Portal in Berlin (Reference Berlin2023). The data for Pirmasens examples were obtained by converting 2D building slot data from the Open Street Map (OpenStreetMap, 2023) dataset using QGIS and FME software to LoD1 CityGML 2.0 format. The Solarkataster dataset containing data on the roof solar potential of buildings in Rhineland-Palatinate has been obtained from Ministerium für Klimaschutz, Umwelt, and Energie und Mobilität in Germany (Ministerium für Klimaschutz, Reference Umwelt2021).
1.3. Synthesis
TWA could be regarded as an example of a new paradigm for the GeoWeb information systems that go beyond Web 2.0. Being based on the Semantic 3D City Database (Chadzynski et al., Reference Chadzynski, Krdzavac, Farazi, Lim, Li, Grisiute, Herthogs, von Richthofen, Cairns and Kraft2021) at its core, it ports existing GIS standards to a new graph database and takes advantage of the Open World Assumption (OWA), which is absent in the equivalent relational geospatial databases (Stadler et al., Reference Stadler, Nagel, König, Kolbe, Lee and Zlatanova2009). Coupling it with a system of intelligent autonomous agents based on cognitive architecture extends and scales existing geospatial data transformation tools. Its agents proved to be able to automatically create a semantic model of Berlin that consists of 419,909,661 subject–predicate–object statements in total. Apart from the traditionally laborious and error-prone process of model creation, the agents also autonomously created a representation of it suitable for interaction with the model using web interfaces. Moreover, the agents demonstrated the ability to track user interactions with the model on the web, create new knowledge and also display it to the user autonomously (Chadzynski et al., Reference Chadzynski, Li, Grisiute, Farazi, Lindberg, Mosbach, Herthogs and Kraft2022).
Although there have been similar attempts to visualize geospatial knowledge using semantic web principles, they seem not to reach large city model scale (Huang and Harrie, Reference Huang and Harrie2020). Moreover, it is well recognized that Web 2.0 systems introduce a new set of problems and challenges to overcome. As pointed out by Goodchild (Reference Goodchild2007), the risk of deliberate misinformation, which is prevalent on the other web domains, is inherited by GeoWeb 2.0. So far, misinformation on the Web 2.0 resulted in polarization of societies around the globe as well as increased amount of criminal and destructive opportunities to harm their members. Including financial, physical, and mental harm. Examples of such behaviors are data thefts, online bullying, manipulation of elections and influencers misleading consumers to purchase particular products for their own monetary gain. However, at the same time, systems that provide geospatial models are arguably more critical to the policymakers at the local as well as national governance levels. Therefore, it is even more important to minimize and mitigate such risks on the new GeoWeb that is designed to enable wider and non-expert participation to avoid potential deliberate policy misinfluence.
The purpose of this article is to present multiple web interfaces to the 3D city objects of the TWA that allow for interactions blending artificial and human intelligence as well as to point out how dynamic geospatial knowledge graphs can minimize Web 2.0 problems and open a new era of GeoWeb 2.5 systems. The issues concerning more traditional geospatial information systems (GISs) and the resulting motivation for the GeoWeb are elaborated in Section 2. It also shows how TWA already overcomes particular issues by providing a scalable way of interacting with large city models on the web. Section 3 focuses on the interfaces that allow TWA agents to autonomously enhance existing city models by upgrading their levels of details (LODs; Section 3.1.1), interact with city objects and retrieve information from other domains that is applicable to them (Section 3.1.2) as well as track user interactions with the city objects on the web to add new analytical knowledge (Section 3.1.3). The advantages of knowledge graphs, and the way in which they can avoid pitfalls of Web 2.0 systems and mitigate the risks of potential misuse of the GeoWeb systems are presented in Section 3.2. Section 4 includes conclusions and potential directions of the future research and development for GeoWeb 2.5 based on such dynamic geospatial knowledge graphs.
2. From GIS to GeoWeb 2.0 and Participatory Urban Design
The majority of the issues related to GIS of the past revolve around their scalability. They come to light when one starts trying to make use of traditional systems for applications imposed by Industry 4.0 (Lu, Reference Lu2017). Because of the concurrent real-time data collection from multiple heterogeneous sources that is constantly transformed and analyzed to fulfill its application demands, the era of Smart Cities is also the era of Big Data (Amović et al., Reference Amović, Govedarica, Radulović and Janković2021). Such demands motivated the evolution of the traditional systems to geospatial web services (GWSs) based on open standards to ensure interoperability (Dietz, Reference Dietz2010). Such systems are also referred to as GeoWeb 2.0 or even as WikiGIS (Roche et al., Reference Roche, Mericskay, Batita, Bach and Rondeau2012). The Wiki aspect indicates that GWS, apart from being able to accommodate and integrate heterogeneous data generated by machines, also open those systems to collaboration between their human counterparts with a diverse range of skills and motivations. This shows that GWS have even the potential to realize the idea of participatory urban design and planning (Pak and Verbeke, Reference Pak and Verbeke2014). TWA, being an information system containing web interfaces, could be regarded as a GWS, realizing some of the mentioned ideas. The next two subsections describe this aspect of it in more detail.
2.1. System architecture for city modeling at scale in TWA
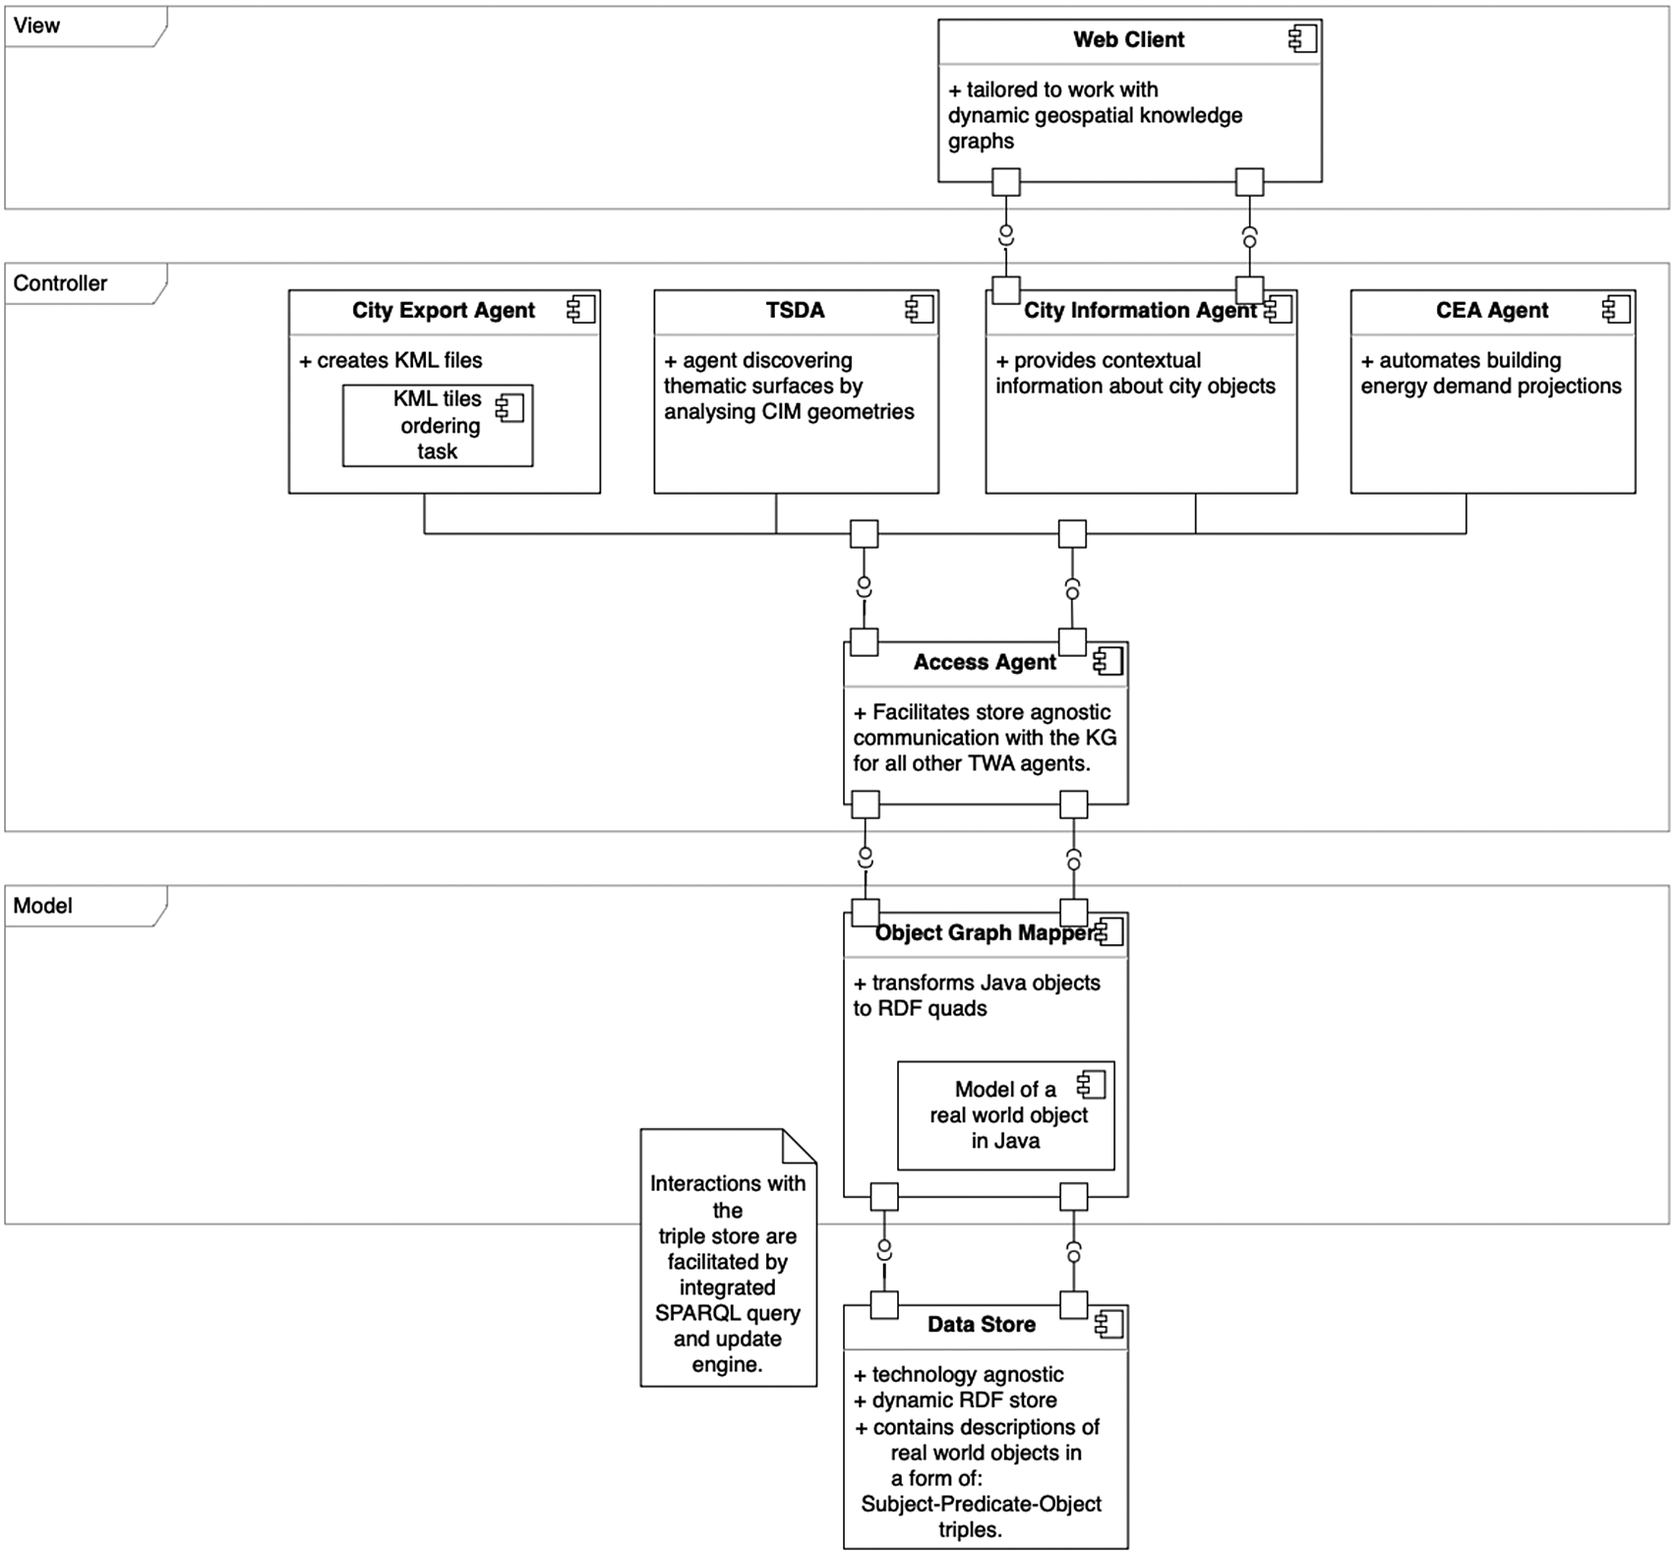
At the very high level, TWA architecture could be compared to the architectures following the model-view-controller (MVC) design pattern (Fowler, Reference Fowler2002). City objects are modeled within the Semantic 3D City Database that is a graph equivalent of the 3D City DB. The objects are described in a form of quads (RDF 1.1 N-Quads, 2014) that assign every statement to a named graph that is an equivalent to a corresponding original relational database table (Chadzynski et al., Reference Chadzynski, Krdzavac, Farazi, Lim, Li, Grisiute, Herthogs, von Richthofen, Cairns and Kraft2021). It allows mapping the semantically stored objects to software models in Java by using an object graph mapper (OGM) engine developed for this purpose within the TWA. It could be roughly compared to the existing object relational mapper (ORM) engines commonly used with object orientated programming languages (Linskey and Prud’hommeaux, Reference Linskey and Prud’hommeaux2007). The cognitive agents layer could be compared to the controller layer in the MVC. TWA agents are based on the cognitive architecture of the J-Park Simulator (JPS) Agent Framework (Chadzynski et al., Reference Chadzynski, Li, Grisiute, Farazi, Lindberg, Mosbach, Herthogs and Kraft2022). They operate on instances of the city objects in Java that are mapped to appropriate graphs. While agents perform intelligent operations on the instances, objects’ instantiation, persistence of updates, additions and deletions are taken care of by the OGM layer automatically. All the changes to the model as a whole as well as to the individual city object members could be immediately reflected on the TWA view layer thanks to its reuse of the augmented 3D web client, based on cesium virtual globe framework (Cesium, 2022) and previously worked on at TUM (Chaturvedi et al., Reference Chaturvedi, Yao, Kolbe and Kersten2015). The view specific data are exported in the keyhole markup language (KML; OGC – KML Standard, 2022) format by the City Export Agent (CExA), that is, capable of generating it for the whole large model at once or for individual model members, depending upon the request received from the other agents. The parts of the model are loaded dynamically on the client because of the adopted geospatially ordered data tiling strategy. This set of features put together also differentiates the TWA from the original TUM stack by making it capable of reflecting changes to the model on the web interface immediately. The original stack requires laborious manual work using desktop tools to achieve the same end result (Stadler et al., Reference Stadler, Nagel, König, Kolbe, Lee and Zlatanova2009). Eliminating manual steps from the process makes TWA a fully dynamic GWS solution that also retains other advantages of knowledge graphs at the same time.
Apart from reusing existing components, additions presented in this article required the design and development of the following novel elements, illustrated in the Figure 1:
Additional components (discussed in detail in this article) and their placement within the overall architecture of The World Avatar knowledge graph.
-
• A GeoSpatial Processor and SQL2SPARQL Transformer integrated into the CExA allowing the creation of KML files suitable for web visualization of the large city models by exporting data from raw triples stored in the Semantic 3D City Database.
-
• A task to geospatially order KML tiles, integrated into the CExA, allowing the rearrangement of unordered KML files for dynamic loading on the large city models in an ordered manner.
-
• An augmented 3D web client that is capable of working with dynamic geospatial knowledge graphs and detecting information required for context processing from internationalized resource identifiers (IRIs).
-
• An object graph mapping engine that can automatically instantiate model elements from the knowledge graph into Java objects as well as persist any changes to them resulting from interactions via the TWA interfaces.
-
• A Thematic Surface Discovery Agent (TSDA) that autonomously upgrades levels of details of buildings by surface geometry analysis and adds thematic information to the knowledge graph.
-
• A City Information Agent (CIA) that can retrieve contextual information related to the city objects from the TWA and presents it on the web.
-
• A City Energy Analyst (CEA) Agent that automates the creation of building energy demand projections and works with the CIA to present it on the web, when required.
2.2. Data processing components for HCI interfaces
Cesium framework is widely used to visualize 3D geospatial data and develop web-based 3D geospatial applications in a virtual globe. It supports many open formats to visualize 3D data, including CityGML, GeoJSON (FileFormatGuide, 2023), KML/COLLADA (Khronos, 2023), and so on. 3D Tiles within Cesium (2023) are designed for optimized streaming and rendering large volumes of 3D geospatial data. It is an open specification for sharing, visualizing, fusing, and interacting with massive heterogeneous 3D geospatial models across different platforms (Getz, Reference Getz2019), which is adopted by OGC as a community standard. TWA transforms the semantic 3D building representation from the knowledge graph data model to KML format based on the hierarchy level of detail of 3D Tiles (3DTiles, 2023), which can be dynamically visualized by cesium platform.
The framework offers an off-the-shelf web visualization component supporting open standards without requiring to build a custom 3D rendering engine (Prandi et al., Reference Prandi, Devigili, Soave, Di Staso and De Amicis2015). Visualization data preparation strategy in a form of geospatially ordered and dynamically loaded tiles allows to visualize cities of the size of Berlin in the TWA at LOD2 at the present moment (CKG Berlin, 2022). The framework has also been used for other thematic 3D visualizations on the web (Gede, Reference Gede2018) as well as for visualizations of dynamic data sources, such as floods (Kumar et al., Reference Kumar, Ledoux and Stoter2018) and energy flow simulations (Mao et al., Reference Mao, Ban and Laumert2020) which are of a particular interest when city models are combined with models from other domains within TWA.
The KML visualization data are prepared by the CExA, implemented as one of the TWA agents using the JPS Agent Framework. It embedded the augmented version of the Importer/Exporter tool (ImpExp) so that it can export the city model from the semantic data store (e.g., Blazegraph™) by sending an hypertext transfer protocol (HTTP) request with required inputs. After the validation of the inputs and preparation of the configuration file, the ImpExp code is used to export the city model and save it into KML files which are added as a data layer for visualization on the 3D Web Map Client. The connectivity to the semantic database has been augmented using Jena Java database connectivity (JDBC), a SPARQL over JDBC driver framework. Moreover, the ImpExp needed the development of two additional components to make it work with semantic database: SQL2SPARQL Transformer and GeoSpatial Processor. Their placement within the overall architecture is illustrated in Figure 2.
Additional components, not present in the original TUM tool, needed to export web visualization data in KML format from a raw semantic data store.
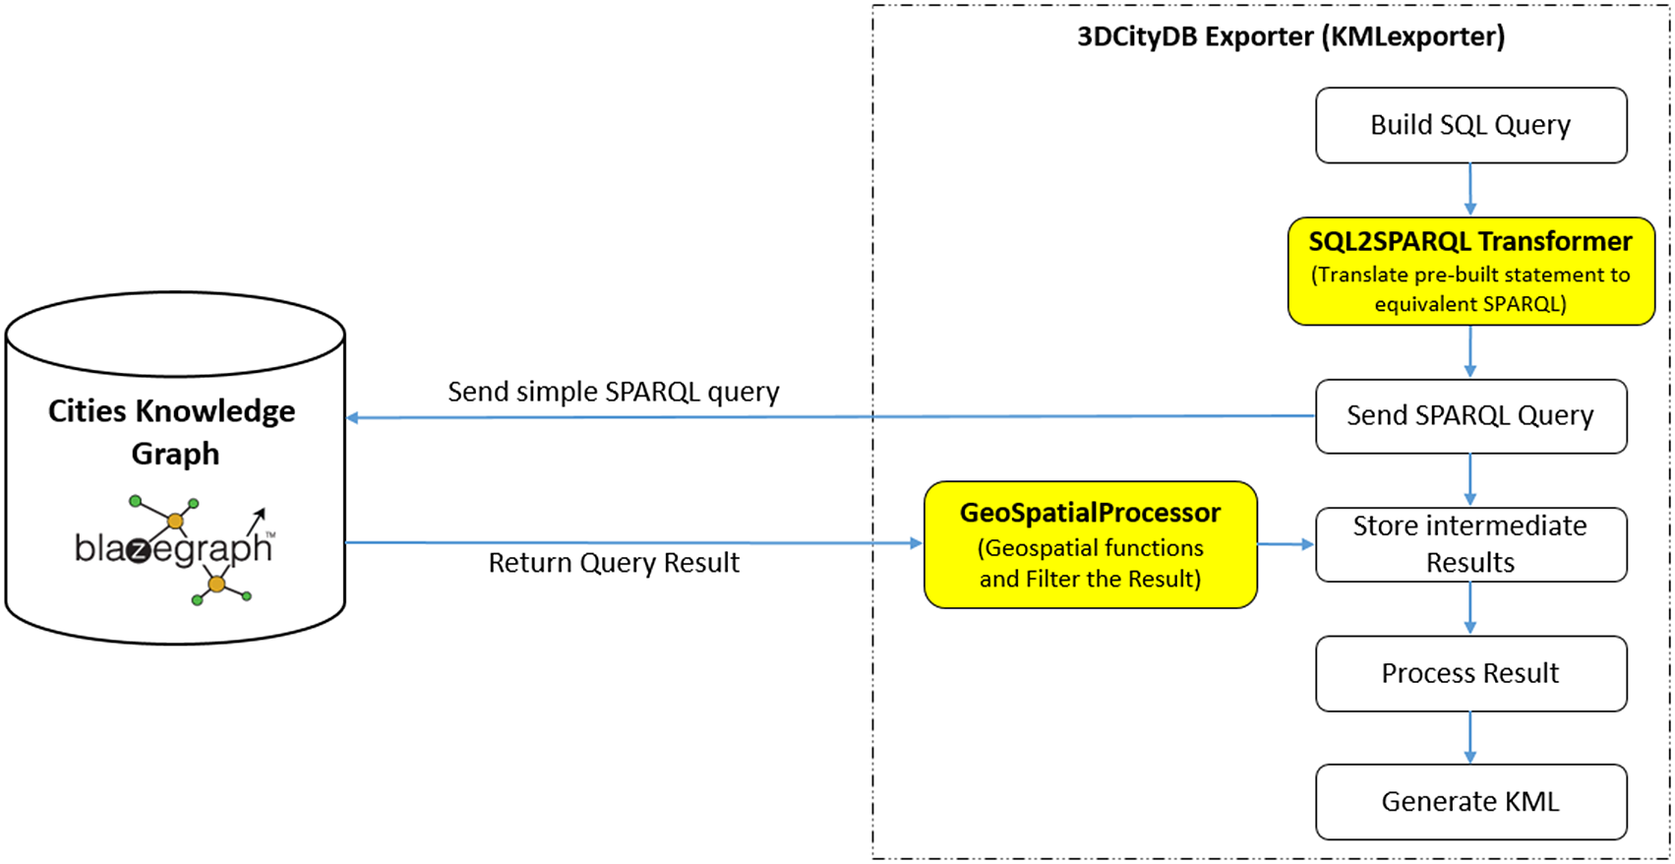
Relational and graph query languages used by 3D City Database and its semantic graph equivalent, namely, SQL and SPARQL, allow to query structured data and share similarities in terms of vocabulary and statement structure (Kumar et al., Reference Kumar, Kumar and Kumar2011). The SQL2SPARQL Transformer makes use of those similarities and translates the SQL statements to equivalent SPARQL statements according to the OntoCityGML schema. Geospatial aspect of the datasets complicates the transformation process due to the presence of language extensions added to certain query expressions within the relational database. Some SQL statements in the original ImpExp make use of the built-in geospatial functions provided by the PostGIS database. However, those functions are not present in the current Blazegraph™ version, such as $ ST\_ TRANSFORM $
for coordinate transformation,
$ ST\_ TRANSFORM $
for coordinate transformation, $ ST\_ Area $
for calculating the area covered by polygon,
$ ST\_ Area $
for calculating the area covered by polygon, $ ST\_ IsValid $
for checking valid geometry and so forth. To overcome the limitation of the current Blazegraph™, a GeoSpatial Processor component is implemented to post-process the query results in a similar manner to provide the same accurate information for generating KML files that are used for the visualization of the city model. Another limitation of current Blazegraph™ is limited computational power for large data storage. To overcome these limitations, some of the complex queries need to be factorized and executed one by one so that part of the computational load can be taken off the database. This implementation can be found in the SQL2SPARQL Transformer component.
$ ST\_ IsValid $
for checking valid geometry and so forth. To overcome the limitation of the current Blazegraph™, a GeoSpatial Processor component is implemented to post-process the query results in a similar manner to provide the same accurate information for generating KML files that are used for the visualization of the city model. Another limitation of current Blazegraph™ is limited computational power for large data storage. To overcome these limitations, some of the complex queries need to be factorized and executed one by one so that part of the computational load can be taken off the database. This implementation can be found in the SQL2SPARQL Transformer component.
To query the corresponding surface geometry of the buildings, a sequence of different queries are executed to retrieve the desired geometry information. One of the SQL examples is presented in the Listing 1:
A nested SQL query used by ImpExp tool to retrieve the surface geometry. The question mark ? is the input variable placeholder and is replaced by an actual value during the evaluation.
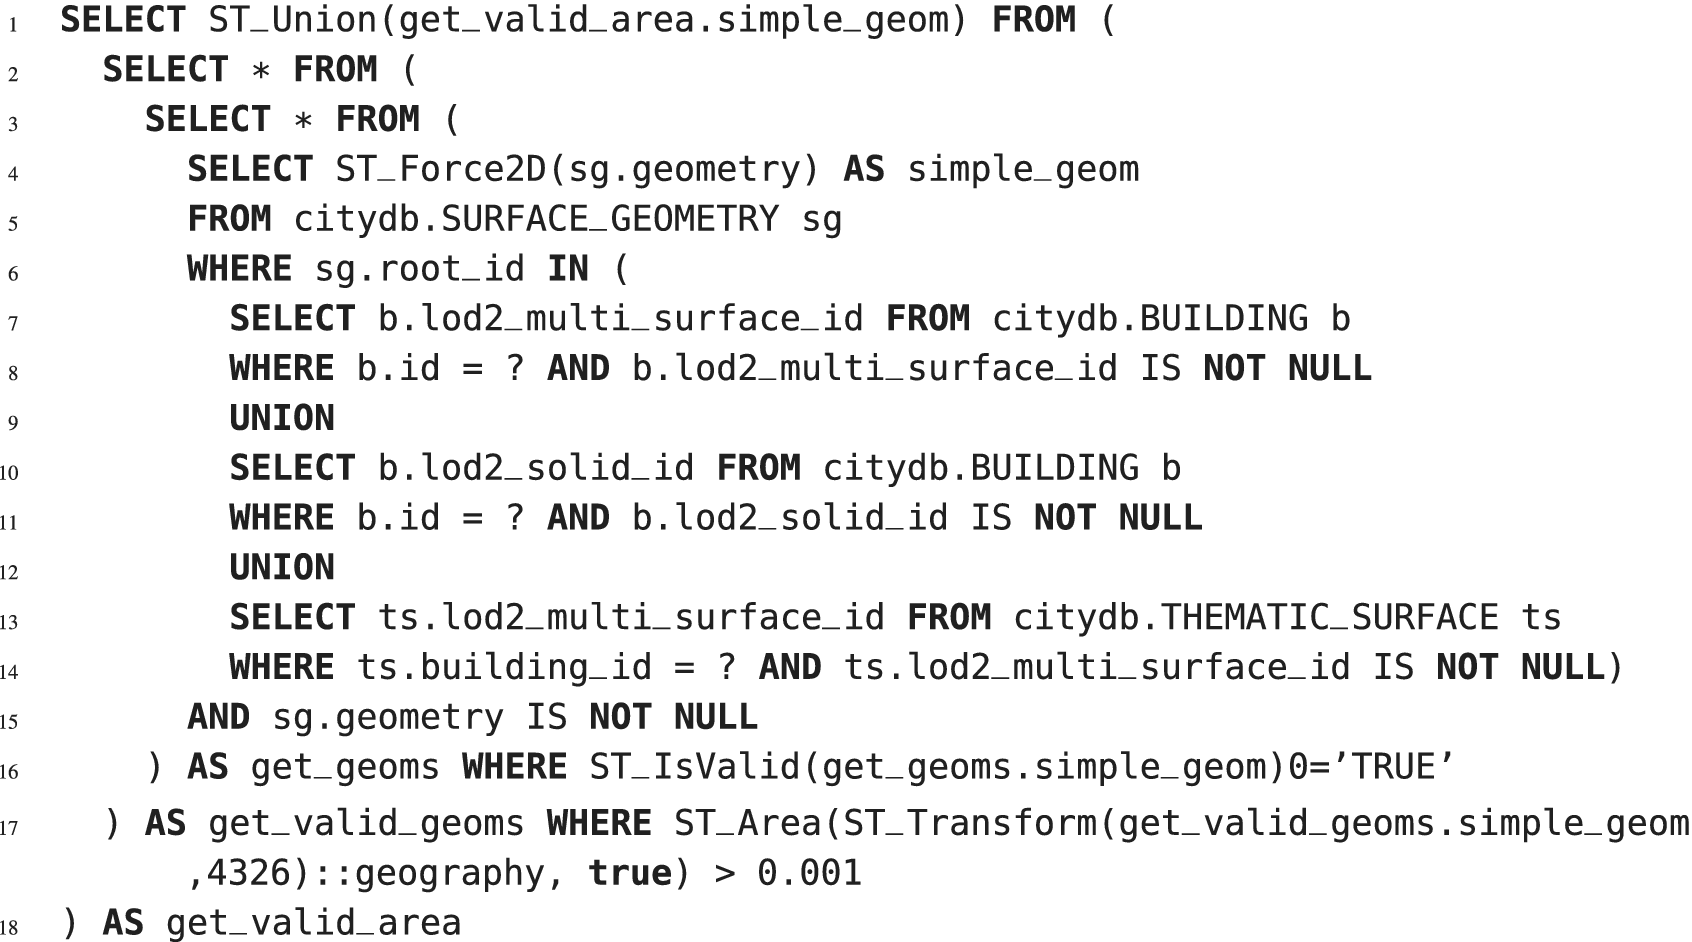
A nested query is a query within another SQL query and embedded within the WHERE clause. The results of the subquery are used in the main query as a condition to further restrict the data to be retrieved. The database engine evaluates a nested query from inner to outer, which means the most inner query is evaluated first (e.g., from lines 7 to 14 in the Listing 1). As the whole statement in the Listing 1 contains geospatial functions that are not present in the current Blazegraph™ version, a complete translation does not exist. However, part of this statement can be translated manually. The query statement transformation process consists of breaking down complex queries into independently executable sub-statements and translating those sub-statements between two languages. Existing similarities between SELECT statements of SQL and SPARQL allow for direct translation because of the shared vocabulary and statement structure. The WHERE clause defines a search pattern in both languages. The FROM clause in SQL specifies the table of the database the following WHERE clause is applied to. A table in SQL corresponds to a named graph in SPARQL, which could be specified by either using the keyword GRAPH or follow directly after the keyword FROM as in SQL statements. Therefore, an SQL statement pattern SELECT x FROM y WHERE z is syntactically identical to the SPARQL pattern with x and z variables expressed in either SQL or SPARQL specific syntax and y as a placeholder for either a table or graph name. It also returns the same data as an equivalent SPARQL pattern SELECT x WHERE {GRAPH y {z}}. Similarly, NOT NULL constraints in SQL can be translated to SPARQL using the FILTER and isBlank functions. Sub-statements transformed this way and recomposed via directly translatable UNION keyword return the same data as the original statements. Due to the complexity involved in such task to make the translation process generic, automated translator between SQL and SPARQL queries could be a subject of a separate research and it is out of scope of the present article that could motivate such research to be conducted in the future. The Listing 2 is the corresponding translation of the section from lines 4 to 15 in Listing 1.
Equivalent SPARQL statement translated from previous SQL statement (lines 4 to 15 in Listing 1).
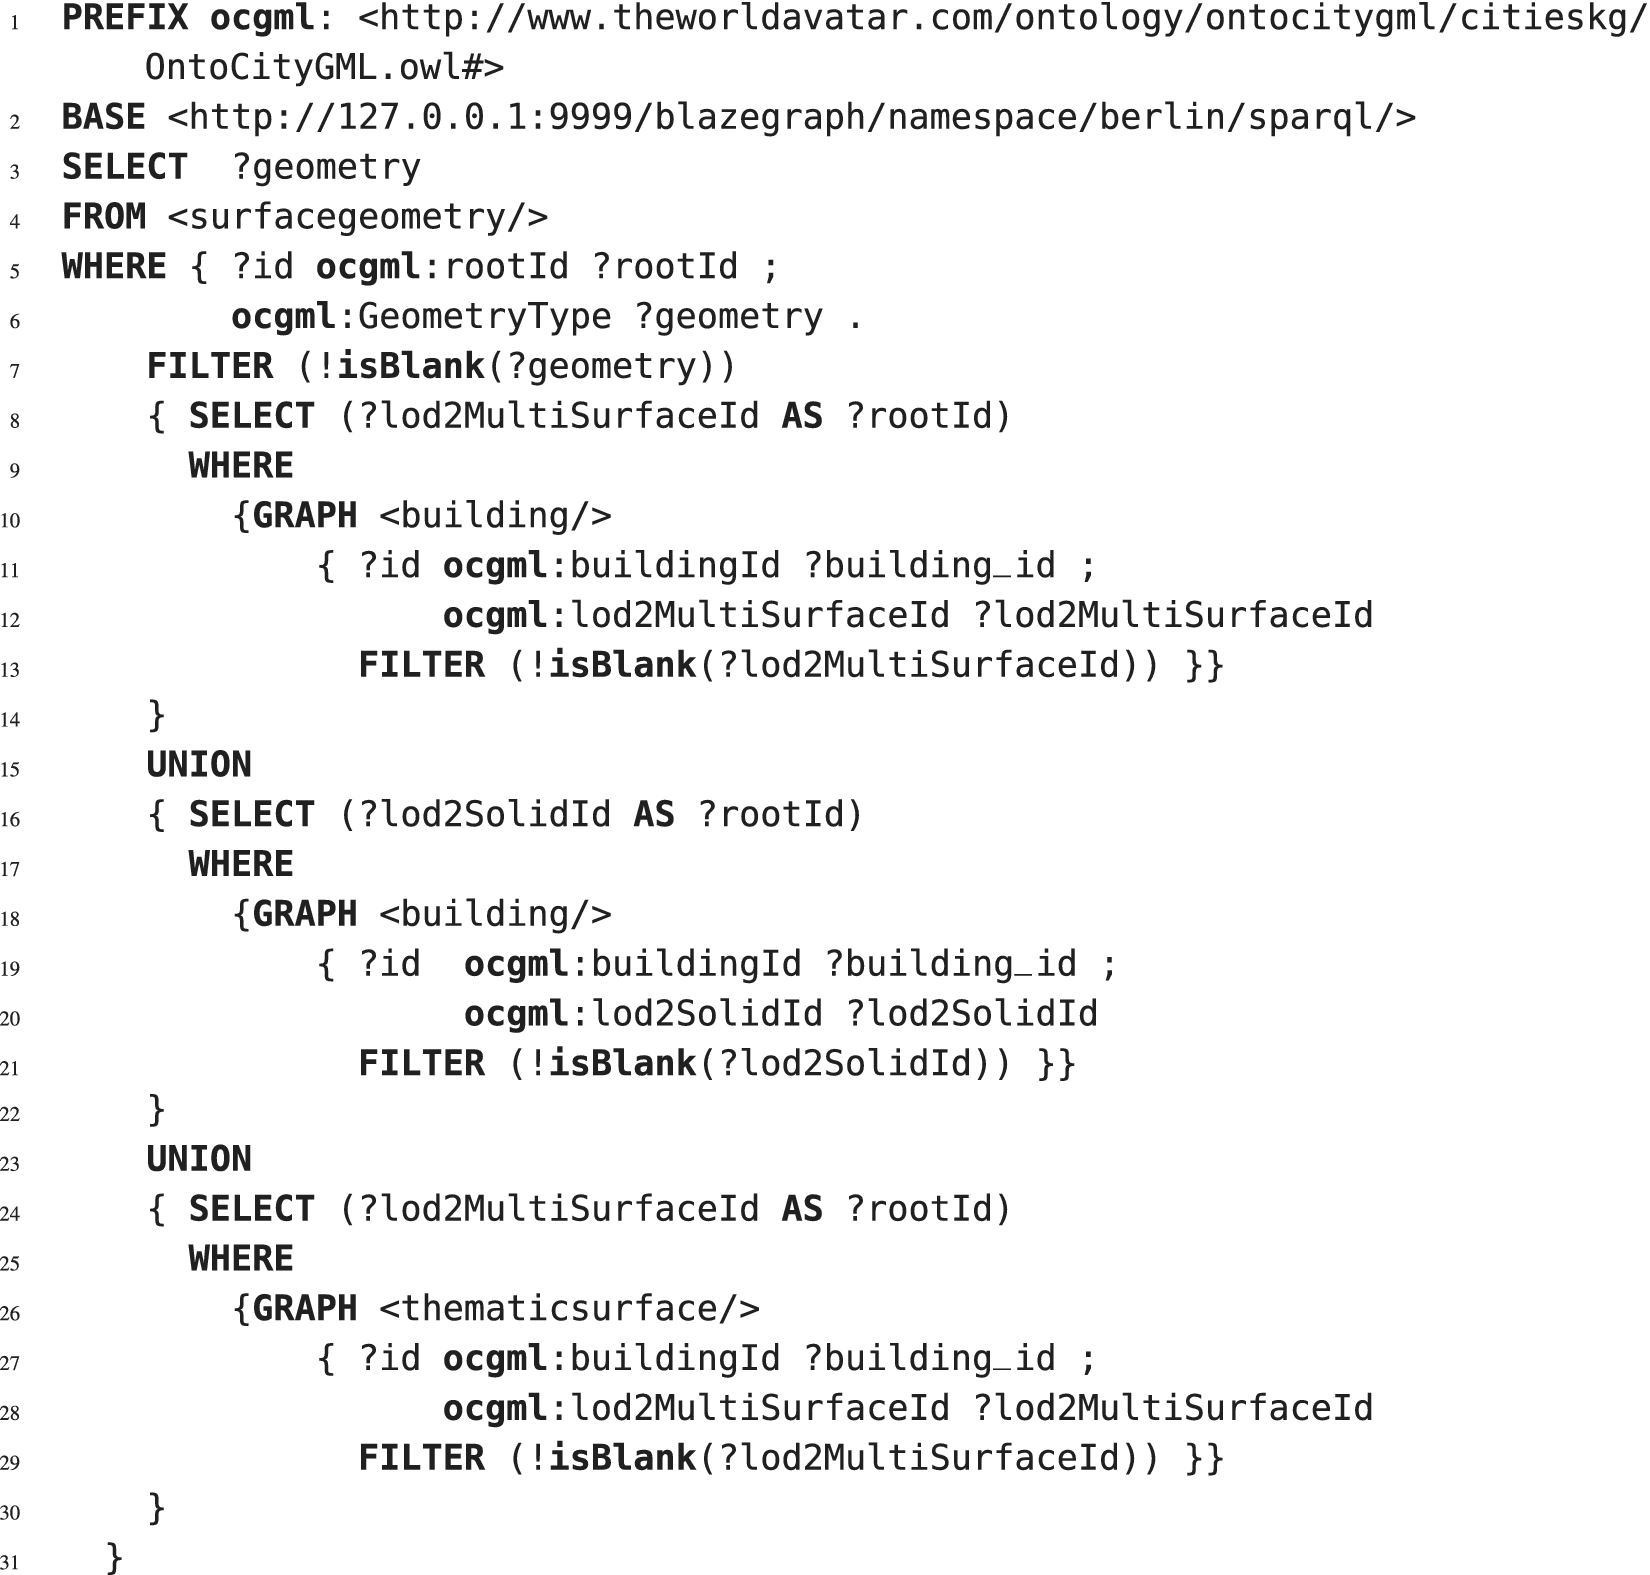
The Listing 2 is composed of a nested query with two stages. The first stage is a composition of three independent queries via a UNION operator where their results are merged and used in the WHERE clause of the outer query. The second stage is the outer query which queries the geometry information based on the WHERE condition of stage 1. One of the current limitations in Blazegraph™ is that its computational load increases with the increasing size of the data storage in the database. In general, this type of query can be executed seamlessly on a smaller database. However, it cannot be executed within a reasonable time range in TWA that combines city data with data representing other domains. To work with TWA, additional optimization of the software architecture is required to achieve an acceptable execution time. One of the implemented optimizations is to factorize the complex original SPARQL statement into multiple simple queries that are executed concurrently. Returned results are collected and merged by the SQL2SPARQL Transformer component added to the augmented ImpExp to reduce computational load on the database engine. This architecture is illustrated in Figure 2.
Some of the required SQL statements in the Listing 1 make use of built-in geospatial functions provided by PostGIS, but these are not present in the current version of Blazegraph™—the backend for the Semantic 3D City Database of the TWA. The GeoSpatial Processor component is implemented to provide the missing geospatial functionalities such as $ ST\_ Transform $
,
$ ST\_ Transform $
, $ ST\_ Area $
,
$ ST\_ Area $
, $ ST\_ IsValid $
using Geospatial Data Abstraction Library (GDAL; GDAL/OGR, 2022). As illustrated in the Listing 1, these functions are predominantly used to filter intermediate query results of SELECT sub-statements within nested queries of SELECT sub-statements within nested queries which can be used for the outer queries. The export process incorporating the SQL2SPARQL Transformer and GeoSpatial Processor components should provide identical information to the next process for generating KML files as the original implementation with PostGIS and SQL. In order to complete the translation from Listing 1 to 2 translation of the method ST_Force2D from POSTGIS that converts the 3D geometry to 2D geometry by discarding the z component is applied to the data returned by the SQL2SPARQL Transformer. The equivalent method Force2D is implemented in the GeoSpatial Processor class and is used to post-process the query results of Listing 2 returned by Blazegraph™. In the presented proof of concept, only functions necessary to instantiate previously described datasets, and not all PostGIS geospatial functions, are implemented this way. To make this process generic, apart from automation of the SQL to SPARQL transformation, implementation of the other geospatial functions will be needed within this component.
$ ST\_ IsValid $
using Geospatial Data Abstraction Library (GDAL; GDAL/OGR, 2022). As illustrated in the Listing 1, these functions are predominantly used to filter intermediate query results of SELECT sub-statements within nested queries of SELECT sub-statements within nested queries which can be used for the outer queries. The export process incorporating the SQL2SPARQL Transformer and GeoSpatial Processor components should provide identical information to the next process for generating KML files as the original implementation with PostGIS and SQL. In order to complete the translation from Listing 1 to 2 translation of the method ST_Force2D from POSTGIS that converts the 3D geometry to 2D geometry by discarding the z component is applied to the data returned by the SQL2SPARQL Transformer. The equivalent method Force2D is implemented in the GeoSpatial Processor class and is used to post-process the query results of Listing 2 returned by Blazegraph™. In the presented proof of concept, only functions necessary to instantiate previously described datasets, and not all PostGIS geospatial functions, are implemented this way. To make this process generic, apart from automation of the SQL to SPARQL transformation, implementation of the other geospatial functions will be needed within this component.
2.3. HCI interfaces data preparation strategy
The export process generates KML files that can be added as layers to the augmented 3D web client for visualization. However, the platform is unable to display large 3D models as a whole due to the limited memory capacity of the browsers. In contrast to the 3DCityDB Importer/Exporter, which embeds the tiling process as bounding box into an SQL query statement and executes the geospatial search on Postgres database, the augmented Importer/Exporter of TWA implements the tiling process externally as additional post-processing step after the export from the knowledge graph. This is comparably faster than performing geospatial search using the bounding box method directly on the open source version of Blazegraph™ without GPU acceleration. Another reason to implement the tiling process externally is that, the geospatial search on Blazegraph™ is essentially different than on Postgres. During the geospatial search, Blazegraph™ only returns the buildings which are totally enclosed by the given bounding box whereas similar search in Postgres returns all the buildings with centroids located within the given bounding box. Therefore, large buildings with parts outside of the given search bounding box are not returned by Blazegraph as parts of a building by using SPARQL query and bounding box method.
In order to utilize the dynamic visualization on cesium platform, the exported KML files have to be re-organized into hierarchical directory structure, illustrated in 3DCityDB (2019b). In such structure, each tile consists of a new KML file containing information about buildings geographically located within the area defined by the tile. This process allows large models exported by the CExA to utilize the existing feature in the augmented 3D web client to dynamically load and unload tiles based on the camera view. The augmented 3DCityDB Exporter exports the 3D geometry of the buildings based on a list of GMLIDs, which are not spatially organized—unsorted KMLs (as illustrated in Figure 3). While querying all existing buildings from a database, a long list of building IDs is equally split into multiple small lists with similar set size. This pre-processing step allows the export process to store the building data into multiple KML files of smaller size instead of creating one single big KML file containing all the buildings. In case of unexpected interrupt of the program, it can continually resume instead of restarting the whole process. This particular feature was not available in the unmodified 3DCityDB Importer/Exporter.
The flowchart on the left describes the reorganization steps that transform the exported KML files into spatial tiles. The graph on the right describes the tiling algorithms. The KMLTilingTask assigns each building into a tile based on the tile location and its boundaries (the grid in the foreground). The (X, Y) value on the grid indicates the tile location.
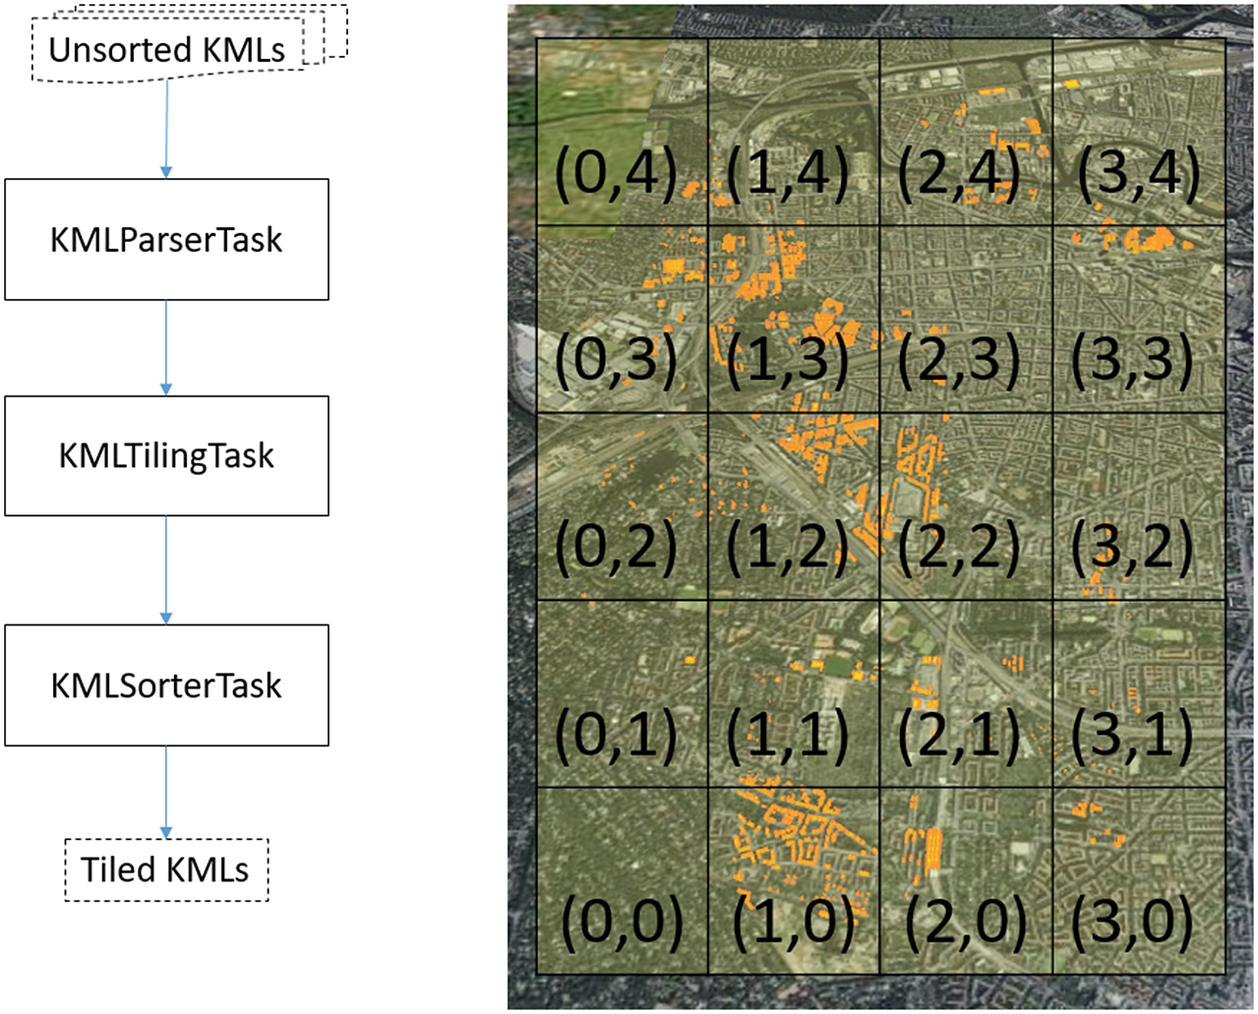
The tiling process consists of three tasks executed in the following order—the KMLParserTask, KMLTilingTask, and KMLSortingTask. The KMLParserTask is responsible for parsing all exported KML files to identify all building objects to be processed. The NASA WorldWindJava library (World-Wind Java/NASA WorldWind, 2022) is used to read and recognize the KML structure of the files parsed, allowing for the identification of each building object as a separate entity and extracting information from KML tags. For each building object, the coordinates of its envelope are read from the exported KML file and used to calculate the envelope’s centroid of the building object. During this process, the task also evaluates the extent of the bounding box that encloses all building objects based on the given parameters. The KMLParserTask also produces a summary of all building objects recorded in comma-separated values (CSV) format, which is passed to the KMLTilingTask. For each building object, this includes its gmlId, envelope, envelope centroid, as well as the exported KML file name where information of the building object is stored. The KMLTilingTask is responsible for assigning each building object to its respective tile. Using the extent of the bounding box and a predefined length of each tile, the location of tiles and their individual boundaries are determined. A building object is assigned to a tile if its envelope centroid is located within the boundaries of the tile. This algorithm follows the documentation of the 3DCItyDB Software (3DCityDB, 2019a).
Following the assignment of all building objects, the KMLSorterTask works to generate a new KML file for each tile. The task extracts the relevant building object information from the associated exported KML file, and inserts it into a newly created tile KML file while iterating through the set of tiles. This read and write process uses the Java API for the KML library (Java API for KML – Micromata Labs, 2022) to preserve the KML structure when extracting building information and to create new KML files. This process requires a lot of I/O operations, which can slow down the program when the unsorted KML files are very large. The summary file created during the KMLParserTask and the use of hash table can decrease the search time and reduce the redundant I/O operations during the KMLSortingTask. Such optimization can prevent an unsorted KML file from being read more than once, as each of these files can be very large. Reading large files multiple times would increase the total processing time.
The CSV summary file created during KMLParserTask records the associated KML filename for each building object. Two hash tables are introduced during KMLSortingTask for the program optimization: the first one is a building hash table that stores the building id and its geometry information, the table content is growing when an unsorted KML file is parsed into this hash map. The second hash map is called the file status hash table which records the file name and its respective status. If a file is read, the object information of all buildings within the file is added into the building hash map. While the KMLSortingTask is writing a KML file for a tile, for each building in this tile, the program firstly gets the respective file location from the CSV summary file and checks the file status in the hash table. If the status of the relevant file is false, meaning that it has not been read, the program adds the unsorted KML file into the existing building hash map and updates the file status. After the relevant building information is written into a KML file, its record is removed from the building hash table to prevent the hash table from growing too large. Described optimization can prevent an unsorted KML file from being read more than once as each of these files can be very large. Reading large files multiple times would increase the total processing time. The task handles cases when the whole buildings’ ground surface areas span multiple tiles by dimensionality reduction. It assigns the buildings based on the centroid of the building which, as a point in space, can only appear in one tile.
2.4. Further impact and gap analysis of WebGIS components in TWA
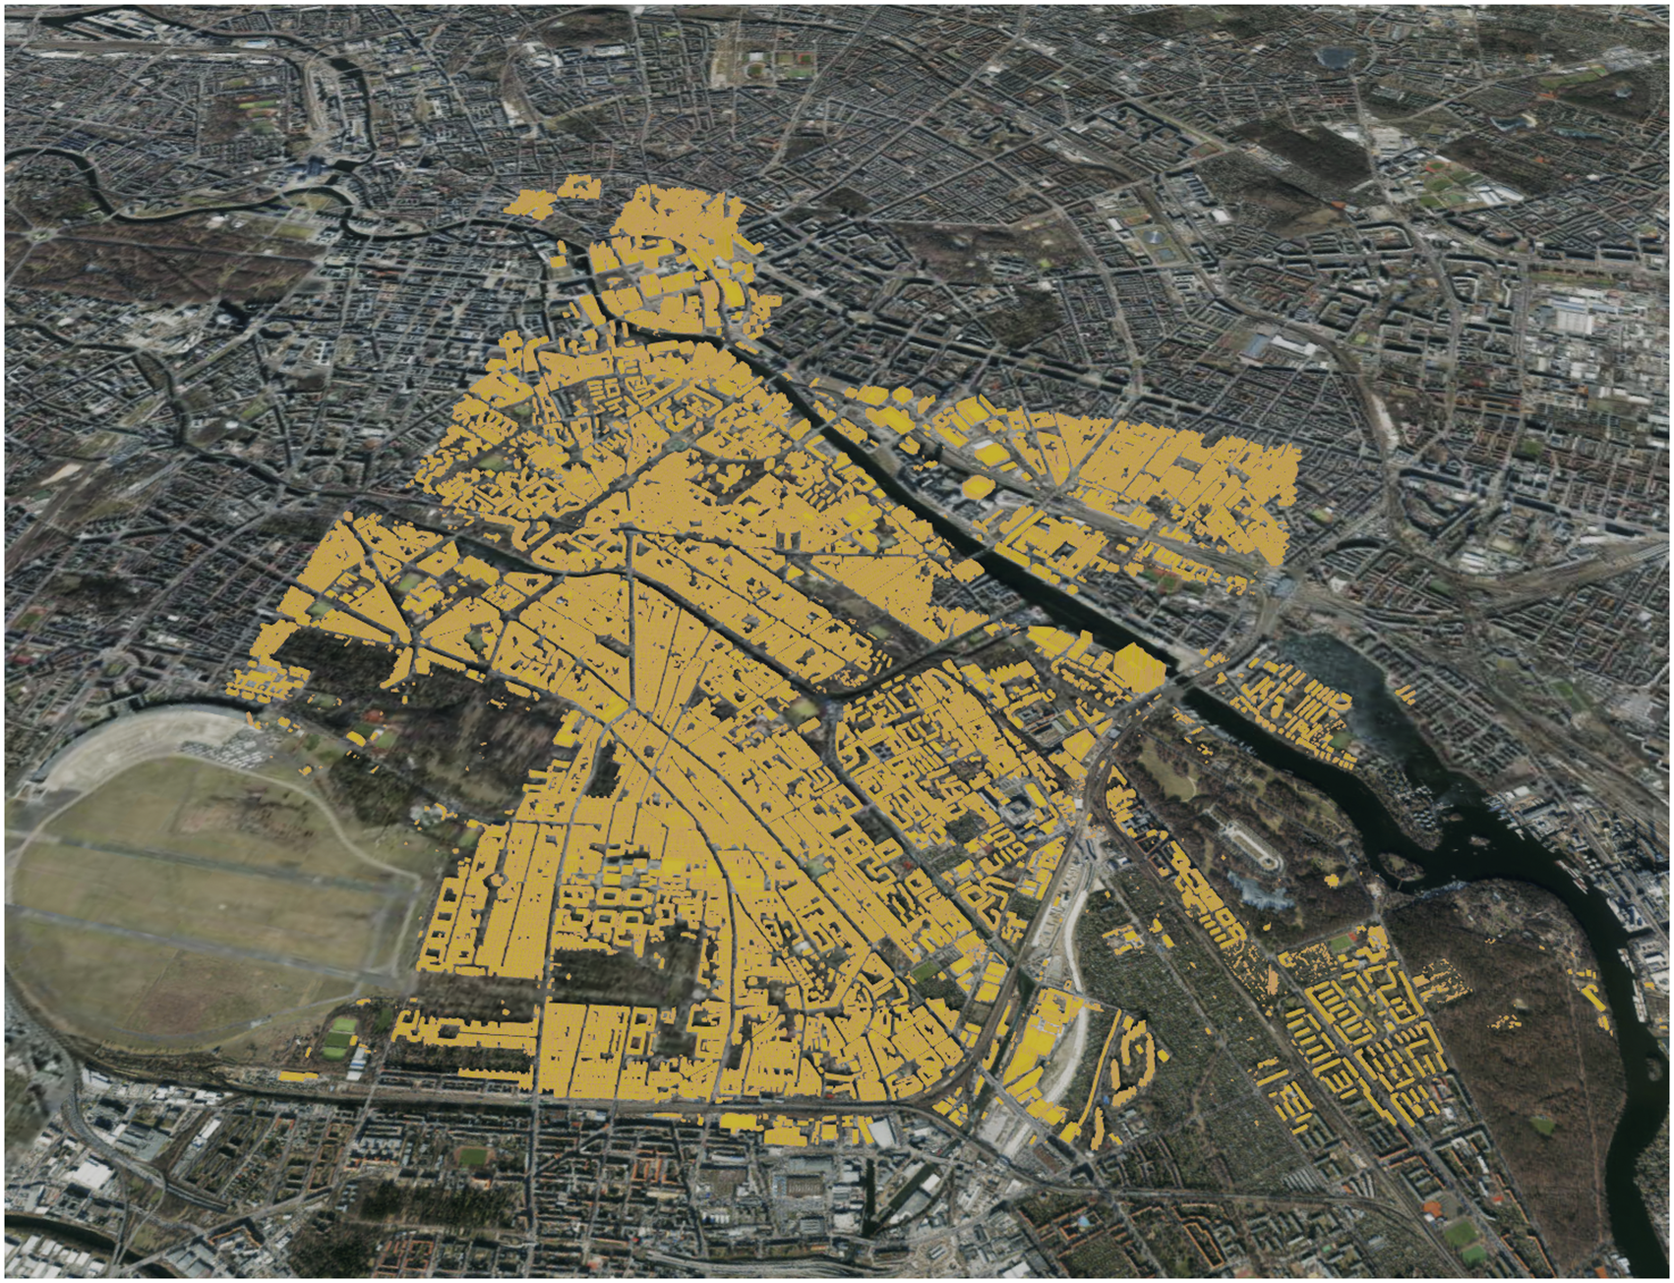
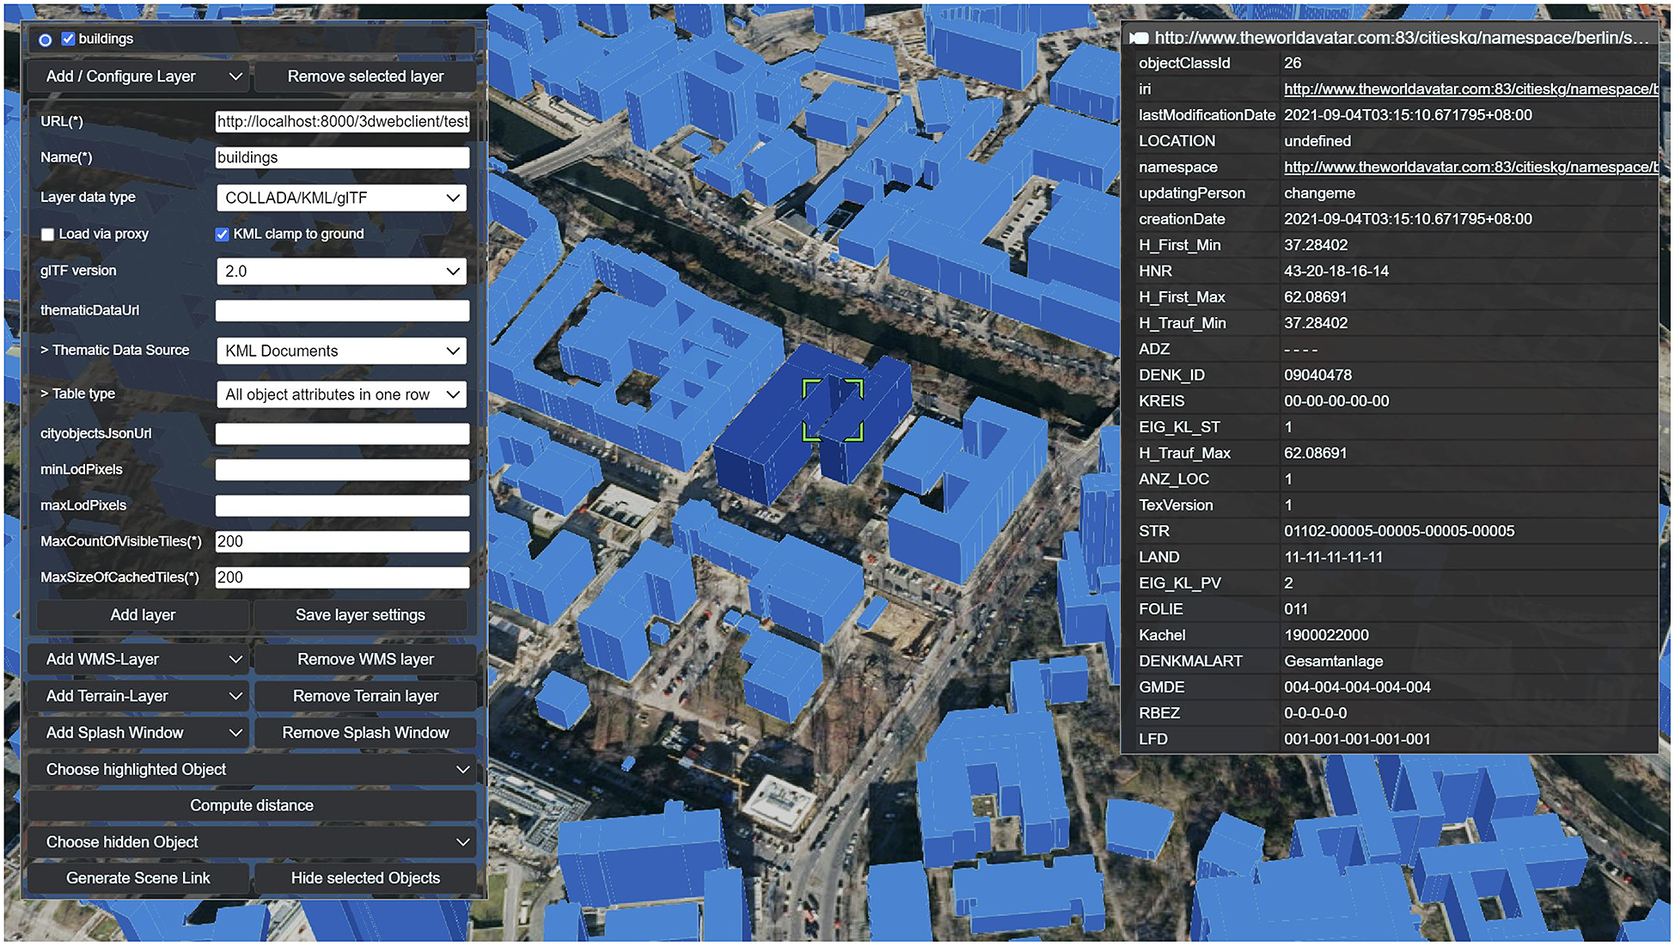
The web interface to the semantic representation of Berlin in the TWA presented at the Figure 4, showcases its capabilities to handle the so-called five V problems in the smart city data management (Amović et al., Reference Amović, Govedarica, Radulović and Janković2021). As described by Chadzynski et al. (Reference Chadzynski, Krdzavac, Farazi, Lim, Li, Grisiute, Herthogs, von Richthofen, Cairns and Kraft2021), its underlying Semantic 3D City Database uses Blazegraph™ as a data store. Because of that, this technology supports up to 50 billion edges on a single machine, and it is fully compliant with the semantic web standards; TWA is the only knowledge graph of this kind that is capable of handling Volumes of data needed to store models of large cities, so far described in the literature on the subject matter. Such models undoubtedly have a Value from the perspective of city planning (von Richthofen et al., Reference von Richthofen, Herthogs, Kraft and Cairns2022) that can address issues mentioned in Section 1 to the present article. When built environment representation is put in the context of TWA, the large Variety of data and different domain models could be combined with the data stored solely for city modeling. This also means that the system is designed to perform complex analytics operations over such a huge amount of heterogeneous data and this way addresses problems of Velocity and Variability. Moreover, dynamic data source coupled with the web interface capable of reflecting changes immediately in the TWA eliminates the need for the whole model being generated again every time there is an update on the model, noticed by Buyukdemircioglu and Kocaman (Reference Buyukdemircioglu and Kocaman2020) during the attempt to work on the CityGML 2.0 model for the whole country in the past.
Visualization of Berlin on the dynamic knowledge graph architecture of the Cities Knowledge Graph, part of the World Avatar Project. KML tiles for visualization are dynamically loaded based on the current scope. Typical problems found in traditional GIS systems that relate to model updates have been solved. Partial model updates are possible and, thanks to the design of the City Export Agent, reflecting changes on the user interface is not a problem anymore.
Experiments conducted within the computing environment described in Section 2, on the large city information model (CIM) of Berlin, show that load time of a page on the augmented web client without caches depends the number of tiles within the visible area. On average, the first element was loaded at 5.22 s. Duration of loading time from the first element to last of the base map and terrain was between 3.5 s and 5 s. The total page loading time was between 38 s and 40 s. It took around 1 s to load all the background images and the rest of the load time was consumed by loading tiles.
3. Enabling GeoWeb 2.5 on Dynamic Geospatial Knowledge Graphs
Whenever a particular narrative reaches its goal of persuading or justifying the implementation of certain policies, it results in some changes to the actual city landscape. Such changed landscapes are then reflected in the original models and form a part of the new base model for the next cycle of narratives that may result in similar changes as well. Because of that, some authors describe digital models that facilitate such recursive interactions using a metaphor of “digital mirrors” (Hudson-Smith et al., Reference Hudson-Smith, Milton, Dearden and Batty2007). When looked at as narratives, they provide insights into some potential futures. When considered as base models, they reflect the current state of affairs. TWA, as a system that is built around principles of cognitive architecture (apart from a knowledge base that forms a set of models represented in a semantic form), contains a layer of intelligent autonomous agents that work with such models by creating them, analyzing, enhancing and discovering new knowledge. Therefore, in such systems, the recursion of changes is also a result of interactions between human and artificial intelligence. Such a blend of actors has also got some properties specific to knowledge graph architecture that help with mitigation of the mentioned GeoWeb 2.0 risks. GWS built on such architectures blending human and artificial intelligence to solve Web 2.0 issues may be already regarded as GeoWeb 2.5 systems.
Capabilities to automatically create and enhance CIMs and, in this way, discover new knowledge about cities are discussed in Section 3.1. Section 3.1.1 introduces TSDA capable of analyzing OntoCityGML models equivalent to CityGML LOD1 and upgrading them to LOD2 by associating semantic descriptions of their parts with their geometrical orientation in space. CIA is presented in Section 3.1.2 by discussing its capabilities of combining multidomain knowledge concerning different aspects of city objects, such as gross plot ratios (GPRs) and projected building energy demands. Interactions with all city objects are tracked by the Distance Agent (DA), presented in Section 3.1.3. This knowledge could be also used for analysis of the objects of particular interest in CIMs contained within the knowledge graph. Lastly, Section 3.2 contains presentation of the dynamic geospatial knowledge graphs based on Semantic Web technologies (SWTs) as systems supporting knowledge storage, retrieval and enhancement while assuring ground truth maintenance and, because of this, opening WebGIS to the Web 2.5 era.
3.1. Intelligent autonomous agency and knowledge enhancement
The layer of intelligent autonomous agents of the TWA is built upon the cognitive architecture of the JPS Agent Framework, previously described by Chadzynski et al. (Reference Chadzynski, Li, Grisiute, Farazi, Lindberg, Mosbach, Herthogs and Kraft2022). The agents operate on memories, and their elements are stored in the form of subject-predicate-object triples in the knowledge graph. Those memories form larger structures, such as city models. The framework offers a security mechanism in the form of syntactic validation, preventing invalid agent inputs’ from entering the downstream data processing and knowledge graph. The framework is built around a microservices architecture and a minimal services model, making the components independent of each other and replaceable with minimal impact on the whole system. The agents operating on the knowledge graph can create, analyze, and, enhance existing knowledge without human involvement or supervision in those processes. Cognitive agents, similarly to any other intelligent beings, typically demonstrate the following capabilities: recognition, decision making, choice, monitoring, execution, action, interaction, communication, as well as acquisition, representation, refinement, and organization of knowledge. As demonstrated in the next three subsections, web interfaces of the TWA allow for the blending of human and artificial intelligence while working on city modeling and knowledge enhancement.
3.1.1. Interactive interfaces to the Thematic Surface Discovery Agent
The objective of the TSDA is to upgrade buildings of CityGML LOD1 representation to LOD2 representation by converting the geometry tree describing the exterior shell to an array of CityGML BoundarySurface entities describing the exact same exterior shell geometry, but semantically differentiated into the different surface types. The polygon classification is a result of applying algorithm 1 to a set of CityGML SurfaceGeometry objects with no thematic information. This process is referred to as “thematization.” Specifically, the TSDA classifies the polygons in the direct surface geometry trees of buildings into wall, roof, and ground polygons. It transforms their surface geometry trees to an OntoCityGML-compliant wall surface-, roof surface-, and ground surface-based hierarchy while preserving as much of the original tree structure as possible. The scope of valid inputs are buildings with top-down topography, that is, theoretically encodable in heightmaps of rooftop (and base) elevation, with no overhangs or interior geometry and well-conditioned winding order, that is, polygon coordinate sequences consistently indicate the direction of face normals by a right- or left-hand rule. The TSDA is nevertheless executable on buildings of different levels of detail that do not satisfy the topographical requirement but may result in errors. However, this may still be useful for some applications which do not require high precision, for example, estimating the total area of roof. Detailed implementation details of the agent are included in the Appendix A of the Supplementary Material.
Algorithm 1. Surface theme identification algorithm for a single building.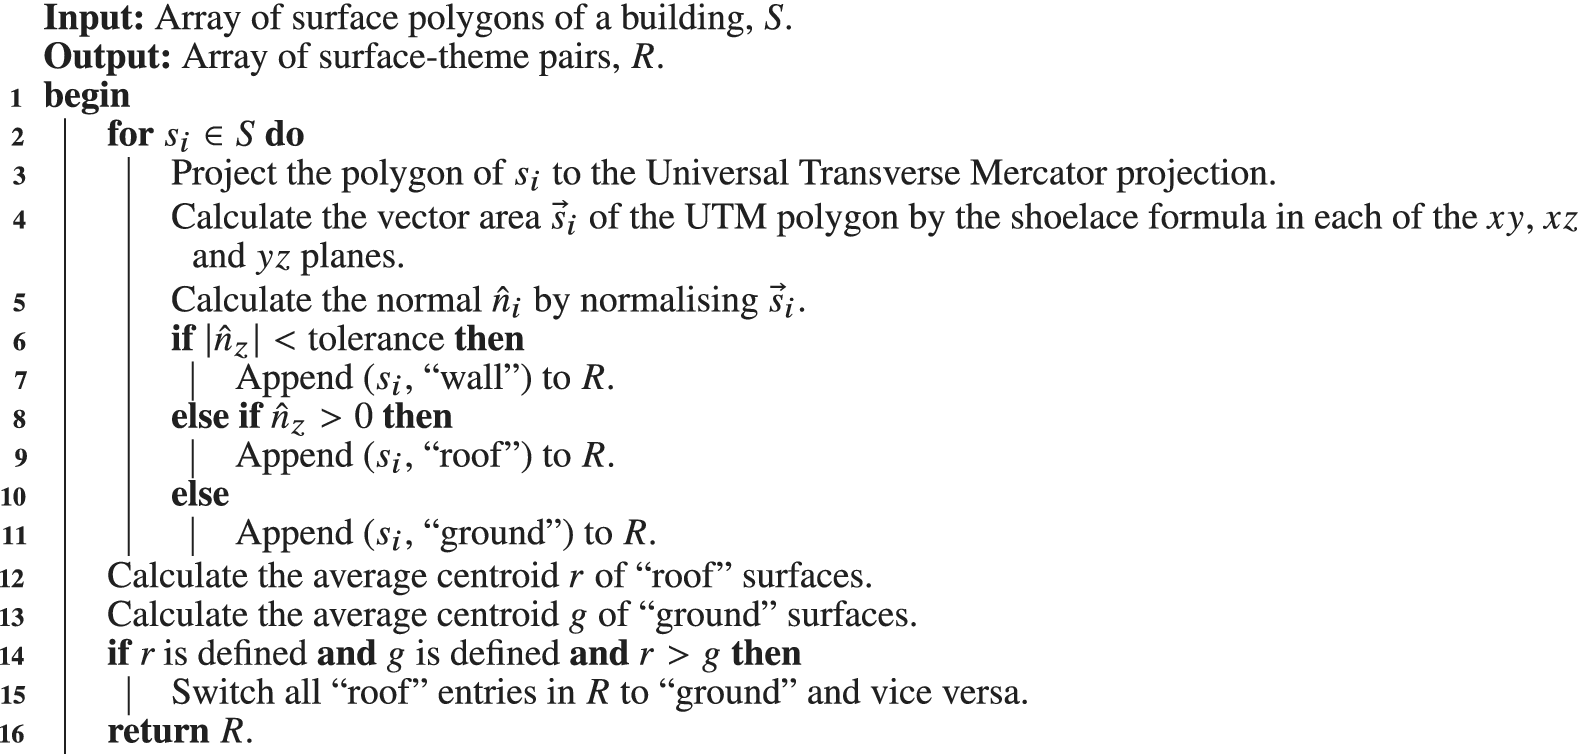
Algorithm 1 is developed for classifying the surfaces of a building into different themes, for example, roof, wall, and ground. It takes as input an array of surface polygons of a building and returns an array of surface-theme pairs. The algorithm begins by projecting each polygon to the Universal Transverse Mercator (UTM) projection to project the polygon to the 2D plane. This is done because UTM has a standard measurement unit of meters, which is useful for the calculation of vector area of the polygon. Then the shoelace formula is used to calculate the vector area of the UTM polygon in each of the $ xy $
,
$ xy $
, $ xz $
, and
$ xz $
, and $ yz $
planes. The face normal,
$ yz $
planes. The face normal, $ \hat{n} $
is then calculated by normalizing the vector area, and this normal is used to fully determine a polygon’s theme: if
$ \hat{n} $
is then calculated by normalizing the vector area, and this normal is used to fully determine a polygon’s theme: if $ \hat{n} $
is orthogonal to the vertical axis (with a configurable angular tolerance), it is a wall; else, if
$ \hat{n} $
is orthogonal to the vertical axis (with a configurable angular tolerance), it is a wall; else, if $ {\hat{n}}_z>0 $
, it is a roof; else, it is a ground surface. However,
$ {\hat{n}}_z>0 $
, it is a roof; else, it is a ground surface. However, $ \hat{n} $
determining requires assuming a polygon winding convention. Initially, a counter clockwise (right-hand) rule is assumed. However, if the average centroid of the identified roof polygons for a building are discovered to lie below the average centroid of its ground polygons, then the ground and roof classifications are switched (the building is “flipped”).
$ \hat{n} $
determining requires assuming a polygon winding convention. Initially, a counter clockwise (right-hand) rule is assumed. However, if the average centroid of the identified roof polygons for a building are discovered to lie below the average centroid of its ground polygons, then the ground and roof classifications are switched (the building is “flipped”).
To evaluate the performance of the TSDA in identifying the thematic surfaces of city objects, the agent was validated using the Semantic 3D City Database of Berlin, described by Chadzynski et al. (Reference Chadzynski, Krdzavac, Farazi, Lim, Li, Grisiute, Herthogs, von Richthofen, Cairns and Kraft2021). The process resulted in the report of the accuracy with which the TSDA identifies the roof-, wall-, and ground-type bottom-level thematic geometries linked to the thematic surfaces. The validation of the TSDA was performed independently on each of the 12 districts in Berlin, namely, Friedrichshain-Kreuzberg, Lichtenberg, Charlottenburg-Wilmersdorf, Marzahn-Hellersdorf, Neukoelln, Spandau, Pankow, Tempelhof-Schoeneberg, Steglitz-Zehlendorf, Reinickendorf, Mitte, and Treptow-Koepenick.
A namespace called “berlin” was created in the Blazegraph™ workbench, which serves as the triple store. The namespace was created in the quads mode with the geospatial feature enabled. For each district, the data in n-quads format was uploaded to this triple store. A SPARQL update was executed to insert the coordinate reference system (CRS) information in the namespace. This was followed by two SPARQL updates which served to fix any missing links (if present) in the building and thematic surface named graphs to link the buildings and thematic surfaces with the actual bottom-level thematic geometries, respectively.
For each building in each district, all the thematic surfaces linked to it have an attribute called objectClassId which can assume three possible values: 33, 34, or 35 representing roof-, wall-, and ground-type thematic surfaces, respectively. This information serves as the ground truth.
For the validation purpose, the TSDA is run in the VALIDATE mode, whereby it uses the polygon data of each bottom-level thematic geometry and classifies it into one of the three categories: roof, wall, or ground. The classifications are added into the surface geometry named graph as rdfs: comment tags of “roof,” “wall,” or “ground.”
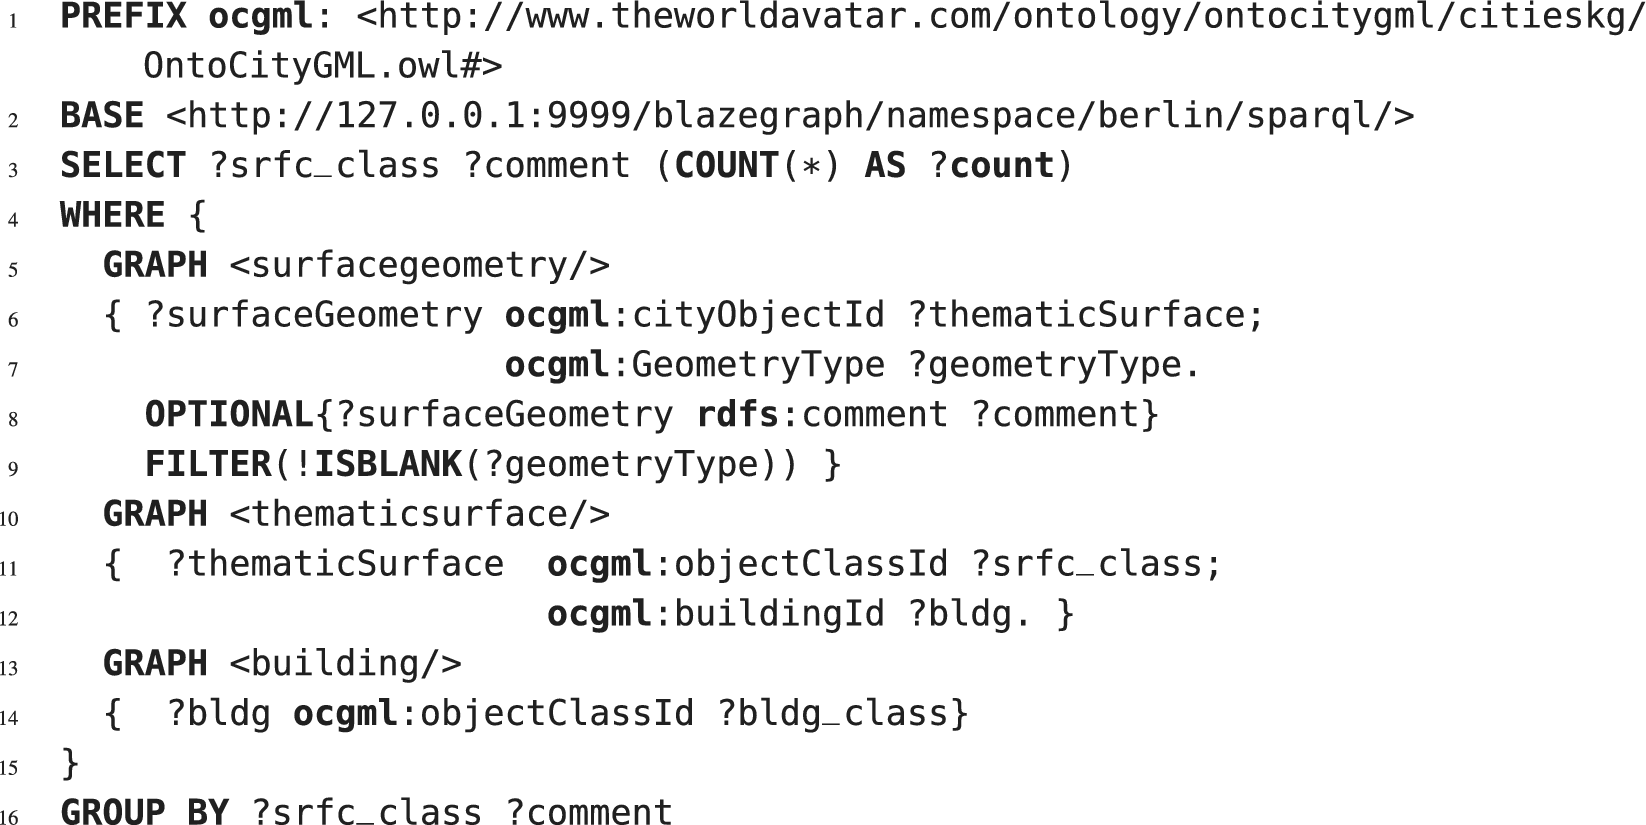
A SPARQL query is executed to compare the bottom-level thematic geometry type (roof, wall, or ground) identified by the TSDA with the ground truth objectClassId (33, 34, or 35) associated with those surface geometries. The SPARQL query used to carry out this validation is included in the Listing 3.
Thematic surface discovery validation SPARQL query.
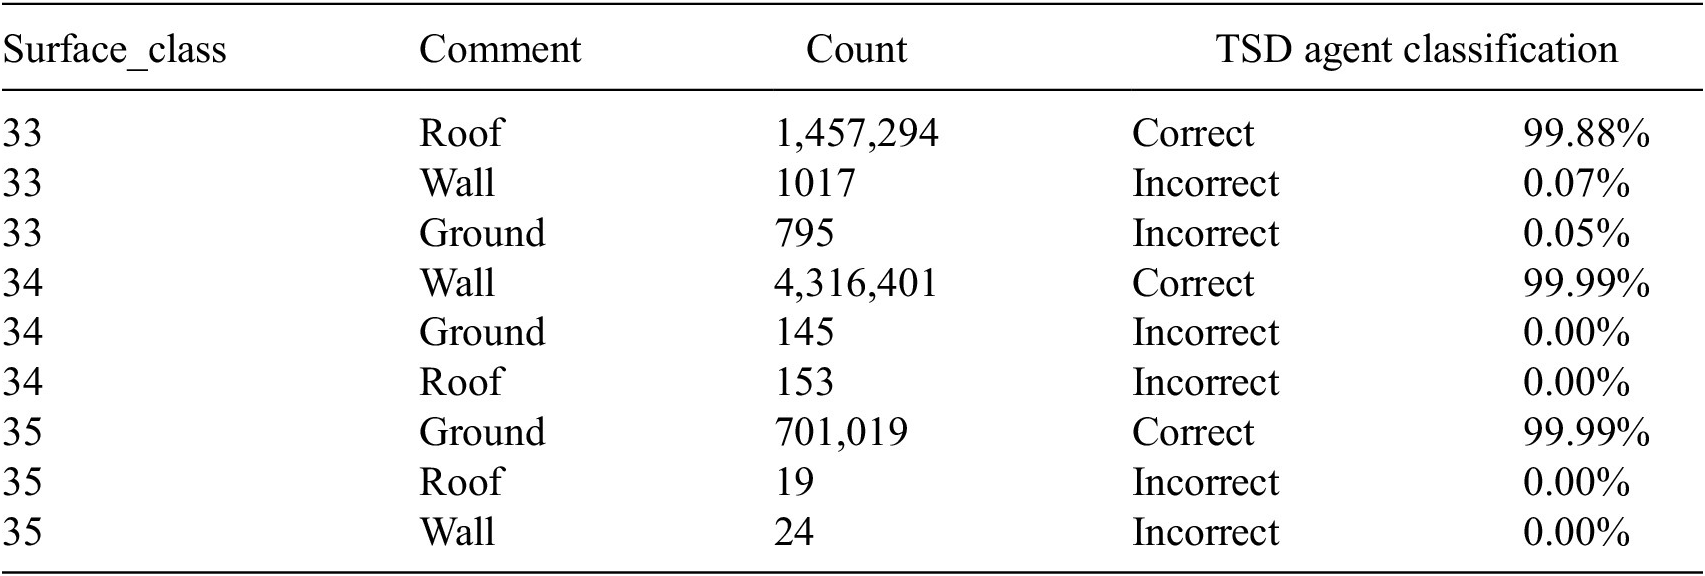
For each district, the results from the above query are tabulated and the combined accuracy of the TSDA on all 12 districts is computed. The correct classification according to the Semantic 3D City Database is shown in Table 1. The combined validation results for all 12 districts in Berlin are shown in Table 2.
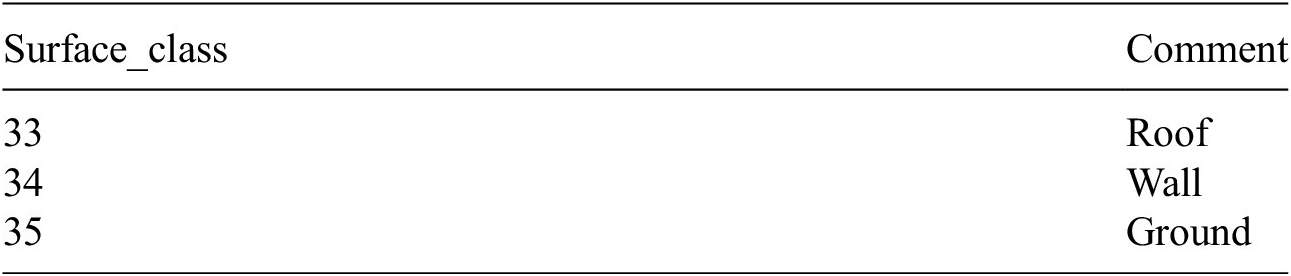
Correct thematic surface classification according to the Semantic 3D City Database.
TSDA validation results on Berlin dataset consisting of 539,274 buildings, 9,558,218 surface geometries, and 2,936,408 thematic surfaces in total.
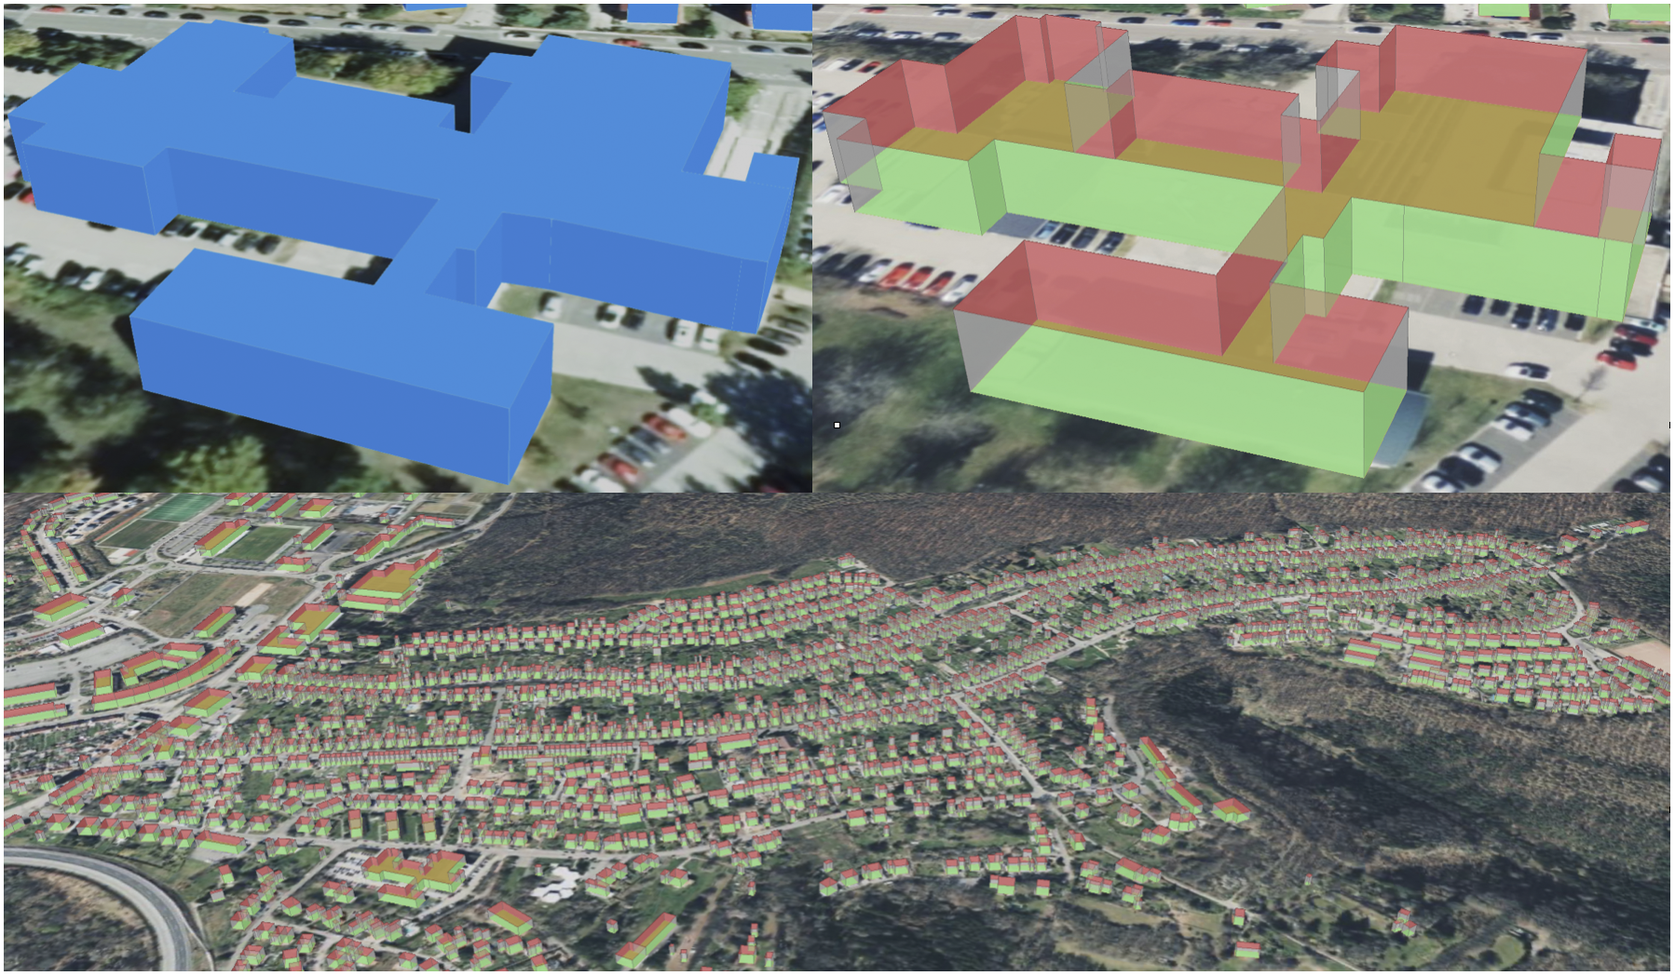
The TSDA has been applied to transform a LOD1 model of Pirmasens in Germany, described in OntoCityGML, to LOD2. Results of identifying roofs, walls, and ground surfaces are presented in Figure 5. The dataset was initially prepared by extruding ground surfaces into buildings in LOD1. In this level of detail, buildings are represented as solids without any thematic information. After transforming the model to the KML format by CExA and visualizing it on the augmented 3D web map client in TWA, it is possible to interact only with the whole buildings, by retrieving information out of the TWA that is applicable to them. All buildings are presented as blue geometrical 3D figures of various shape complexity. After the agent broke down such solids into sets of polygons and discovered their spatial orientation, it assigned individual surface polygons into three thematic groups and added thematic surface-specific models to the knowledge graph. When the enhanced dataset was exported into the KML, the individual thematic surfaces started being displayed in separate colors—walls in gray, ground surfaces in green, and roof surfaces in red. A richer set of interactions became possible as well. Clicking on individual thematic surfaces makes it possible to retrieve information that is applicable to those surfaces specifically, apart from information concerning the whole building. This may become important in assessing the energy efficiency of the buildings, by examining the thermal insulation properties of walls as well as the solar potential of roofs, and so forth. The total transformation time of the model contained that contained 18,639 buildings from LOD1 to LOD2 was 25 h within the computational environment described in Section 1.
CityGML level of detail (LOD) upgrade performed by the Thematic Surface Discovery Agent at the city level (the bottom part showing Pirmasens in Germany) and the appropriate knowledge enhancement of a single building before and after the transformation (the top part, from left to right). The agent discovered walls, roofs, and ground surfaces from the set of surface geometries and assigned them to appropriate thematic surface categories in the knowledge graph. The thematic surfaces are assigned different colors on the user interface and can be interacted with separately, whereas before the enhancement, it was only possible to interact with the whole buildings and not any of their parts.
3.1.2. Interactive interfaces to the City Information Agent
CIA facilitates contextual interactions with city objects. The agent serves as a general-purpose semantic information retrieval mediator on its own as well as by involving other intelligent agents. In essence, the agent finds, retrieves, and provides the required information to the user interface of Web-Map-Client (WMC) upon detecting an interaction event with a particular city object.
The CIA utilizes an earlier presented OGM engine to interact with structured graph data. OGM represents OntoCityGML ontology-based knowledge graph classes as Java models and ontological properties or relations as model fields. These models and fields are populated with object-related information from the knowledge graph.
Upon interaction with the city object on the WMC interface, CIA receives an HTTP POST request containing unique object IRI and if provided, context-related information. Then, the CIA creates a JAVA city object class instance using the OGM engine. The created city object model is populated with data from the knowledge graph using the pullAll() function. By executing this function, the graph database is queried for all quads or triples containing the city object model instance’s IRI as the subject or object. Each row of the query response is processed, and the value and data type are injected into the city object model instance’s corresponding field. The city object model is packaged into the HTTP response body that is displayed on the interface.
Populating city object model instances with values from the knowledge graph may be performed recursively. While non-recursive pulls straightforwardly populate the specified model, the recursive pulls proceed to execute more recursive pulls on model objects linked in the parent level pull. According to the CityGML schema, the city object is linked to genericAttribute and externalReference CityGML classes. Therefore, when creating a city object Java model counterpart, by setting recursion depth, the pullAll() can be used to populate the created corresponding linked object model fields with query results.
CIA also recognizes the “context” parameter in the received HTTP request. The parameter typically contains another agent IRI and request body that should be passed. Using this information, the CIA contacts any other agents to compile an answer that consists of statements about the city object of interest relevant to the specified context and display it on the web interface. For instance, it can provide information about urban regulations or energy usage projections that apply to a particular city object. The form in which such information is currently displayed is presented in Figure 6.
The City Information Agent (CIA) facilitates contextual interactions with city objects. The agent finds and provides the required information to the user interface upon detecting an interaction event with a particular city object. It contacts any other agents to compile an answer that consists of statements about the city object of interest relevant to the specified context. That is, it can provide information about urban regulations or energy usage projections that apply to the city object interacted with.
CIA supports synthesis processes in participatory city planning and mediates information between knowledge graphs and end-users. By retrieving all related information about a particular city object, the agent automates otherwise labor-intensive tasks, enabling more resources for design explorations, like public engagements or workshops. Further, individual unique use cases or research questions can be targeted using the CIA context parameter, determining the agent’s communication with other agents for retrieving relevant information, for example, factual as well as simulated with other software. Thus, the synthesis capabilities of the CIA, when integrated together with the visual WMC interface, remove cognitive loads that end users typically experience when confronted with multi-source, unstructured urban data. Thus, inspections of geospatial and related semantic data and engagement with such data may be performed with greater ease, catering to non-expert end-users. Detailed implementation details of the agent are included in the Appendix B of the Supplementary Material. The following two distinctive CIA applications illustrate the agent’s synthesis support capabilities.
In the first application, the CIA is used to return site regulation data for plots across Singapore. It creates a JAVA model for the interacted city object—a building plot represented as a 2D polygon—and populates it with retrieved information from the knowledge graph. In such a way, plot zoning type data and GPR are visualized on the web interface. Further planning operations can be performed on it, for example, querying allowable land uses or programs for the selected city object or comparing estimated gross floor area (GFA) with retrieved GPR.
The second use case makes use of the context parameter to contact the CEA agent. The CEA agent is used to automate the workflow of running the CEA software (Fonseca et al., Reference Fonseca, Nguyen, Schlueter and Marechal2016). The agent has a run endpoint that, on receiving a request with a building IRI in the body, retrieves the required input data using queries sent to the TWA and then runs a predetermined CEA workflow on the building. Key outputs returned by the CEA are represented ontologically and added to the TWA through automatic SPARQL updates. This removes the requirement for any domain knowledge in how to operate the CEA manually, as well as to understand the output results. The output data added are the building energy demand (grid consumption, electricity consumption, heating consumption, and cooling consumption) and the potential solar energy availability of the building (solar panel area and solar panel energy supply).
The CIA can display this information if the CEA Agent query endpoint is added as a context parameter. This means the CIA sends an HTTP request to the CEA agent’s query endpoint to retrieve the energy profile information of the building specified by the IRI given in the body of the HTTP request. The returned energy information is then displayed on the web interface alongside the city object information. This brings data from multiple sources together in one access point for a user to get detailed information about buildings. Detailed implementation details of the agent are included in the Appendix C of the Supplementary Material.
Experiments conducted within the computing environment described in Section 1 show that the average running time of the CEA agent for one building is 105.375 s. It was calculated from 16 different buildings and two different CIMs. The comparison of CEA results to results found in the Solarkataster dataset Ministerium für Klimaschutz (Reference Umwelt2021) for the annual electricity yield per area is as follows: difference (CEA – Solarkataster) is −117.20 $ kWh/{m}^2 $
, relative difference ((CEA – Solarktaster)/Solarkataster) is −13.06%. Both numbers at 2 d.p. CIA’s average load time for one city object information retrieval was 2.404 s once the view was set and all tiles were loaded. The time was increasing if the tiles in the current view were still loading.
$ kWh/{m}^2 $
, relative difference ((CEA – Solarktaster)/Solarkataster) is −13.06%. Both numbers at 2 d.p. CIA’s average load time for one city object information retrieval was 2.404 s once the view was set and all tiles were loaded. The time was increasing if the tiles in the current view were still loading.
3.1.3. Interactive interfaces to the Distance Agent
The DA is an example of intelligent autonomous agents tracking interactions on the city models and their parts presented on the TWA’s web interface. Similarly to the other JPS agents deployed as web services, while operating in the listening mode, the agent waits to receive HTTP POST requests about the city objects interacted with on the web. As presented in Sections 3.1.1 and 3.1.2, web users of the TWA can interact with the whole buildings or their individual thematic parts to retrieve more specific contextual information that applies to a particular object of interest in a given situation. Upon clicking on those objects, their IRIs are sent over to DA in JSON format. This operational mode allows the agent to make sense of its environment and react accordingly to the detected events and processes.
The agent performs syntactic input validation for cybersecurity purposes by checking whether all the IRIs in the request payload are well-formed and conform to the HTTP specification. It responds with the HTTP error 400 to the invalid inputs and halts any further data processing. Valid inputs trigger the agent to operate in the distance calculation mode.
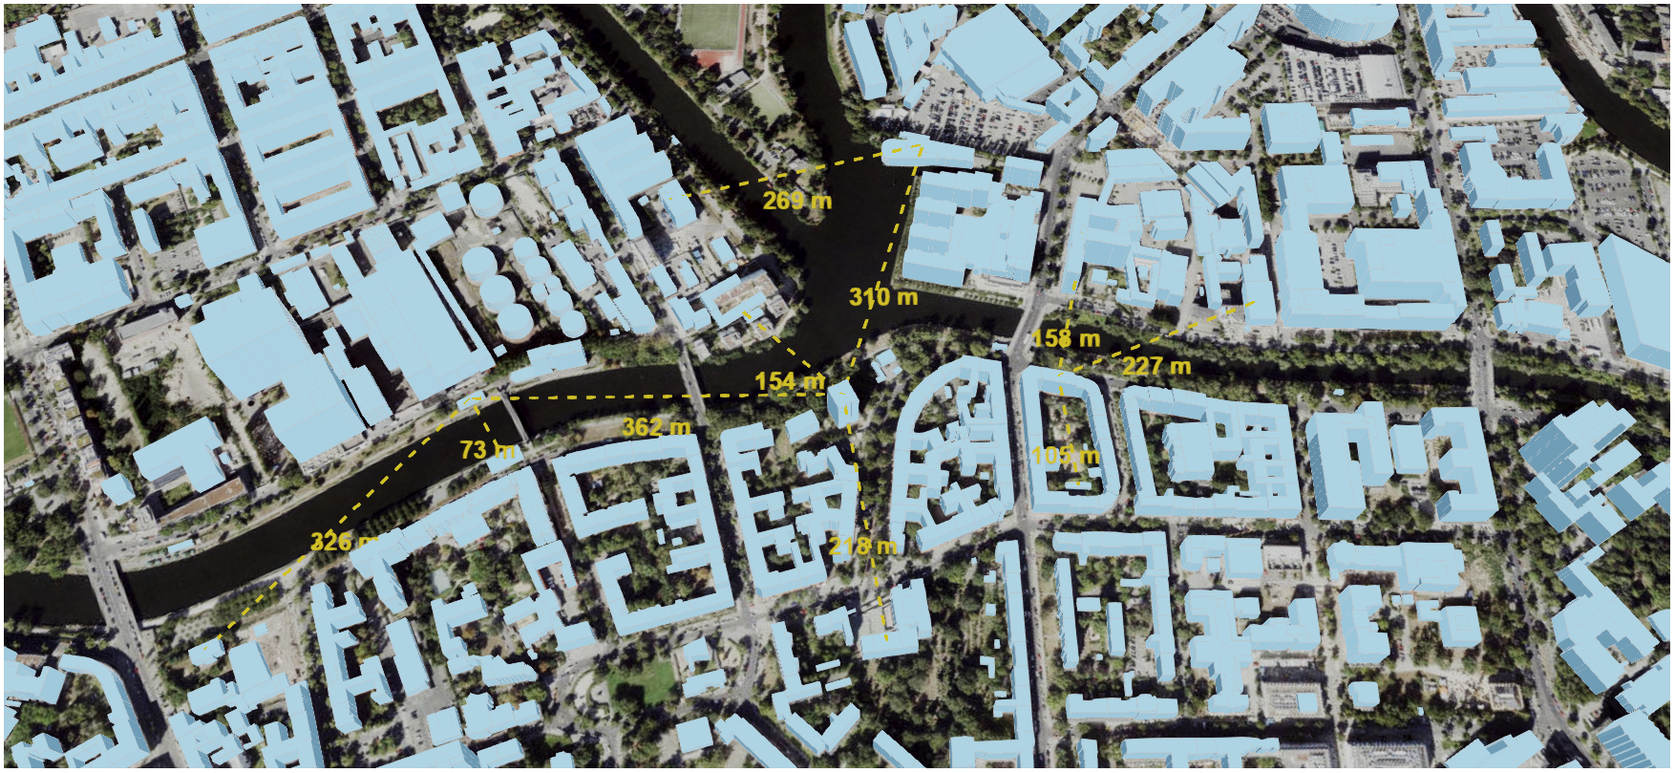
To calculate distances between objects of interest, the agent uses the OGM engine for object instantiation and data retrieval from the knowledge graph. The objects are retrieved using the technology-agnostic Access Agent and Store Router regardless of which data stores and namespaces their target IRIs resolve to. This allows the agent to operate on a highly distributed system without the need to know specific data storage locations for the city objects. Before calculating the distance between particular objects of interest, the agent checks if an existing distance relation is already stored in the knowledge graph. If the query result is not empty, the distance is returned, and the agent gets back to the listening mode of operation. Otherwise, the agent computes centroids of the objects in the first step. To do that, it also makes sure that the object’s envelopes that specify their bounding boxes are encoded within the same CRS. The agent also performs the CRSs’ conversions in case of finding any discrepancies. After computing centroids of envelopes described in the uniform CRS, the agent computes distance and adds appropriate new statements to the knowledge graph, describing distance in terms of Units of Measure Ontology (OM; Rijgersberg et al., Reference Rijgersberg, Van Assem and Top2013). As depicted in Figure 7, the distances are also returned in the agent’s HTTP response to the TWA web interface and displayed there immediately. A more detailed description of the implementation can be found in Chadzynski et al. (Reference Chadzynski, Li, Grisiute, Farazi, Lindberg, Mosbach, Herthogs and Kraft2022).
The Distance Agent automatically calculates distances between city object representations, which were interacted with on the web map client. It dynamically manifests the acquired knowledge by displaying the learned information about spatial relationships through connection lines and distance values whenever it is ready.
The agent operates autonomously and independently from all the other TWA agents. It is only dependent on the Access Agent that provides a technology-agnostic way of accessing the knowledge graph in TWA. However, it can be used for decision support use cases while working with them in tandem. The agent is capable of calculating distances between buildings, and in this way could be used for similar studies to those performed by Huang et al. (Reference Huang, Kazemzadeh, Mansourian and Harrie2020) for urban bicycling suitability but on a larger scale. This way, it would be possible to conduct multi-factor optimizations for less fossil fuel-intensive transportation systems on large city models. The agent could also work with models enhanced by TSDA and assess distances between roofs of buildings to minimize the waste of materials required for solar panels deployment as a potential use case; especially when they are interacted with by means of the CIA working in the context of the CEA, described in Section 3.1.2. When the CIA works in the context of regulations applying to plots, the agent could aid optimal site selection for usages that require distance from others (i.e., chemical processing plants and housing estates) and so on. Such cases show how intelligent autonomous agents of the TWA could lead to adding new knowledge as well as enhancing existing knowledge about cities concurrently with interactions on its web interfaces while performing intelligent operations and analyses by their human counterparts.
Average load time for two distances between two objects with DA deployed to the computational system environment described in Section 1 was 1.771 s. It was obtained by including retrieval of distances that were already in KG and newly calculated distances.
3.2. Ground truth maintenance on dynamic geospatial knowledge graphs
SWTs are generally regarded as an essential enabler for Web 3.0. This new web is envisioned around the ideas of decentralization, web stakeholder data ownership, privacy, and data security (Leppington, Reference Leppington2022). Blockchain technologies are seen as facilitators for the decentralization of the web as well as, because of their origins in cryptography, technologies enhancing security. TWA and the JPS Agent Framework are designed as decentralized systems at the core. In particular, the framework is built upon the idea of a minimal service model and microservices architecture (Chadzynski et al., Reference Chadzynski, Li, Grisiute, Farazi, Lindberg, Mosbach, Herthogs and Kraft2022). Moreover, the Agent Composition Framework of TWA (Zhou et al., Reference Zhou, Eibeck, Lim, Krdzavac and Kraft2019) is designed to work with a blockchain-based agent marketplace (Zhou and Kraft, Reference Zhou and Kraft2022). Both are accessible by interfaces integrated into the JPS Base Library that TWA agents extend and make use of. Compliance with W3C standards makes TWA storage layer a knowledge graph based on the SWTs. This gives TWA good foundations to evolve into the new era of web information systems in the future. TWA contains city modeling subsystem dedicated to representing the domain of cities in a similar form to other domain representations—by making use of SWTs. Because of using Blazegraph™ triple store and being configured for geospatial search, the TWA is a dynamic geospatial knowledge graph fully compliant with SWTs (Chadzynski et al., Reference Chadzynski, Krdzavac, Farazi, Lim, Li, Grisiute, Herthogs, von Richthofen, Cairns and Kraft2021).
The adopted system architecture strongly positions the TWA to be ready for the era of GeoWeb 3.0 systems at some point in the future too. However, as was elaborated more in Section 2, GWS systems have not yet fully evolved into GeoWeb 2.0 systems. Moreover, enabling Web 2.0 features on them carries high levels of risk for critical infrastructures to be exposed to malicious activities. Embracing graph structure in SWTs makes them naturally suitable for content mashups that are going to remain an essential part of the next generation of the web as well (Hendler, Reference Hendler2009). As such, the TWA is a GeoWeb 2.0 ready GWS that only requires slight extensions to its web interfaces to facilitate ordinary web stakeholder participation in geo-content creation, editing, and sharing.
OntoCityGML (Chadzynski et al., Reference Chadzynski, Krdzavac, Farazi, Lim, Li, Grisiute, Herthogs, von Richthofen, Cairns and Kraft2021) is a transformation of the CityGML 2.0 schema into an ontology serialized in the web ontology language (OWL) and provides a vocabulary and a set of relationships between vocabulary items for representations of city objects in the TWA. The ontology as a conceptual schema for city modeling serves as a Tbox (Baader et al., Reference Baader, Horrocks, Lutz and Sattler2017) for the Semantic 3D City Database. OWL is a language based on description logic (Horrocks, Reference Horrocks and van Beek2005) and could be used with automated reasoning technologies. The OntoCityGML ontology implements 344 classes, 272 object properties, and 78 data-type properties. It also contains 3,363 implemented axioms. The ontology has been evaluated according to the criteria found in the literature on the subject matter (Hlomani and Stacey, Reference Hlomani and Stacey2014). It passes consistency, coherence, accuracy, conciseness, and completeness tests using Protégé (Musen, Reference Musen2015) ontology editor and HermiT reasoner (Glimm et al., Reference Glimm, Horrocks, Motik, Stoilos and Wang2014).
Such strong foundations in logic already give the TWA models an advantage over other modeling techniques without schemas checked this way when considering potential GeoWeb 2.0 problems. A consistent, coherent, accurate, concise, and complete vocabulary and a set of rules already provide a language for geographical model descriptions that minimize risks of deliberate misinformation due to the obscurity of language used for such descriptions otherwise. All elements of city models are stored as subject-predicate-object statements in the knowledge graph. They form an Abox described in terms of the OntoCityGML Tbox. A particular city model can be regarded as a logical conjunction of all such statements and also assessed as true or false. The truth of such models can be maintained automatically. Apart from JPS Agent’s layer validation mechanisms enforcing the correctness of data, Blazegraph™ triple store can also be configured for the automated truth maintenance (Bebee, Reference Bebee2020) that checks the model whenever any new statements are added, deleted, or altered by performing inferencing on the Abox automatically. Whereas web interfaces of the TWA allow for information retrieval, analysis, and enhancement by blending artificial and human intelligence, the underlying knowledge graph backend can take care of the truth of the model resulting from such actions. Those architectural properties of the TWA provide certainty of the model assessments. In contrast, existing machine learning techniques, such as spam filtering or sentiment analysis that are used in misinformation battles on Web 2.0 are based on probabilistic algorithms. Therefore, TWA can be regarded as a GeoWeb 2.5 GWS that is capable of avoiding commonly recognized pitfalls of Web 2.0 by maintaining the truth of geographical models automatically and with certainty.
4. Research Summary and Future Work
Virtual city models can be regarded as narratives useful to communicate policies as well as to persuade residents to accept changes at the regional and national levels. As cities are one of the biggest contributors to global $ {\mathrm{CO}}_2 $
emissions, such models could aid in solving the most pressing problems of the present time. Recent research shows that to address those issues, interfaces to the models should be enabled for public participation and content creation, apart from offering view-only access. This shift is similar to the one that occurred while moving to Web 2.0 in the past. However, the dawn of the new era of GWS, sometimes also referred to as WikiGIS, is not without concerns of opening those systems to already well-known risks. At the same time, geospatial content is critical to the national and regional governing bodies. The majority of existing techniques offer only probabilistic algorithms to protect the content from misinformation, falsehoods and, in turn, policy misinfluencing. This article presented one of the ways to avoid GWS designs opening geographical content to such malicious activities and making them capable of offering interactive interfaces to the city models.
$ {\mathrm{CO}}_2 $
emissions, such models could aid in solving the most pressing problems of the present time. Recent research shows that to address those issues, interfaces to the models should be enabled for public participation and content creation, apart from offering view-only access. This shift is similar to the one that occurred while moving to Web 2.0 in the past. However, the dawn of the new era of GWS, sometimes also referred to as WikiGIS, is not without concerns of opening those systems to already well-known risks. At the same time, geospatial content is critical to the national and regional governing bodies. The majority of existing techniques offer only probabilistic algorithms to protect the content from misinformation, falsehoods and, in turn, policy misinfluencing. This article presented one of the ways to avoid GWS designs opening geographical content to such malicious activities and making them capable of offering interactive interfaces to the city models.
4.1. Summary of the article
A high-level overview of the TWA architecture, capable of solving the five-V problems in smart city data management, was presented in Section 2. At first, subsection 2.1 demonstrated how interactive web interfaces to large city models are created by the CEA from the raw triples stored within the Semantic 3D City Database. The dynamism of the augmented 3D web client was achieved by implementing a geospatially ordered tiling strategy that allows KML replacement on demand and also reflects any changes to the underlying model. The risks of opening the system to interactive public participation and geospatial content creation without additional safeguards have been highlighted as well. The way of avoiding such risks within dynamic geospatial knowledge graphs architecture that makes them GeoWeb 2.5 systems has been presented in the Section 3. Section 3.1 presents three agents built using the JPS Agent Framework based on a cognitive architecture and shows their role in knowledge enhancement that occurs as a result of blending human and artificial intelligence with TWA web interfaces. TSDA, presented in Section 3.1.1, is capable of autonomously upgrading levels of detail in city models by analyzing the spatial orientation of surface geometries that belong to their elements. Such changes allow for interactions with individual parts of the buildings on the web and more fine-grained analyses. The CIA, elaborated in Section 3.1.2, can retrieve contextual information that relates to the city objects and view it using web interface elements and controls. It can act with the whole objects or their parts after the models are upgraded by the TSDA. The DA, presented in Section 3.1.3, tracks interactions with the city objects on the web. This includes objects that are interacted with while the information is provided by the CIA. The agent calculates the distances between those objects and adds new knowledge to the TWA. The last subsection (Section 3.1) elaborates on how the dynamic geospatial knowledge graph architecture based on semantic web standards and recommendations by the W3C, as well as the web ontology equivalent of the CityGML 2.0 encoding standard, can protect from deliberate misinformation related to the geospatial content in GWS.
4.2. The future of city modeling
CityGML as a modeling language also evolves on its own. At the moment of writing the article version 3.0 has been approved as an official and revised standard by OGC. Although it introduces refined set of concepts and geometry representation for better expressivity, its concept of model versioning still relies on storing models in static XML files that does not allow for concurrent editing and collaboration. Materialization of the Semantic 3D City Database that addresses this particular problem by storing equivalent OntoCityGML in dynamic data source relies on implementation of generic CityGML 3.0 transformation capabilities in third party tools. TWA agents that automate data processing supported by those tools would be upgraded after new features are available in them to stay in accordance with best practices of code reuse and sustainable digitization. Within TWA, city model versioning is handled by the Parallel World Framework that allows to store such models combined with knowledge about other domains related and linked to city objects at the same time. The framework may be altered in the future to make use of CIM versioning capabilities of CityGML 3.0.
Although typical WikiGIS user interfaces are not yet implemented in the TWA, it is worth mentioning that the system would be capable of supporting participatory GIS applications that are the subject of the most recent research in the domain of urban planning (Batty and Yang, Reference Batty and Yang2022). The idea of collaborative GWS has got many advantages in terms of cost and time savings required for data acquisition and preparation of it to be ready for web interactions. However, the development of such systems involves certain risks that are also elaborated in the present subsection. Knowledge graph specific solutions to those problems, absent in other systems, are presented in Section 3.2.
Ideas of WikiGis, GeoWeb 2.0, neogeography and participatory urban design are closely intertwined. Neogeography—a geography without geographers—is only possible with web, mobile, and virtual reality-based interfaces enabling community engagement and participation in urban planning. This is also one of the reasons for referring to it as wikification of GIS that comes from recognition of the importance of narratives in this domain (Foth et al., Reference Foth, Bajracharya, Brown and Hearn2009). Urban simulation models can be used as policy narratives that have the power to persuade and congeal public opinion. Narratives do not have to be factual but can be regarded as “what if” scenarios that show interconnections between various parts of the model as well as associated processes that occur between them. “The purpose of the narrative is therefore to make the connections to ordinary experience through ordinary language and peel away the presuppositions so as to engage as well as to persuade” (Guhathakurta, Reference Guhathakurta2002). Within TWA, the Parallel World Framework has been already used in the past to create similar simulations altering electrical grid of Jurong Island in Singapore by adding renewable energy sources and optimizing the infrastructure for carbon tax (Eibeck et al., Reference Eibeck, Chadzynski, Lim, Aditya, Ong, Devanand, Karmakar, Mosbach, Lau, Karimi, Foo and Kraft2020). Therefore, narratives could also be regarded as alternative worlds or versions of reality that communicate a story.
4.3. Wikification of knowledge and participatory urban design
The idea of wikification of knowledge also entails a shift from a “top-down to bottom-up” approach in terms of knowledge acquisition and generation. Enabling neogeographers’ participation in those processes significantly shortens times and reduces costs required for content preparation in non-participatory GIS. In the GeoWeb 2.0 systems knowledge is produced voluntarily and not as requested to be produced by field experts. This way ordinary citizens and their communities become the knowledge stakeholders instead of large institutional or private producers (Roche et al., Reference Roche, Mericskay, Batita, Bach and Rondeau2012). This shift requires an appropriate set of interfaces in GWS allowing for such content production by individuals. A wireframe that extends the current TWA web interface to allow for such participation is presented in Figure 8. Apart from existing elements and controls for viewing time versioned city models and their various aspects as either actual stages of a particular city or as a narratives illustrating some changes, the system would need to include elements and controls allowing new web stakeholders to create their own geo-narratives and mash them up with custom types of content.
A wireframe for a WikiGIS user interface. It allows the creation of custom maps with multiple participants able to collaborate. It is possible to enrich geographical information by mashing it up with other multimedia content.
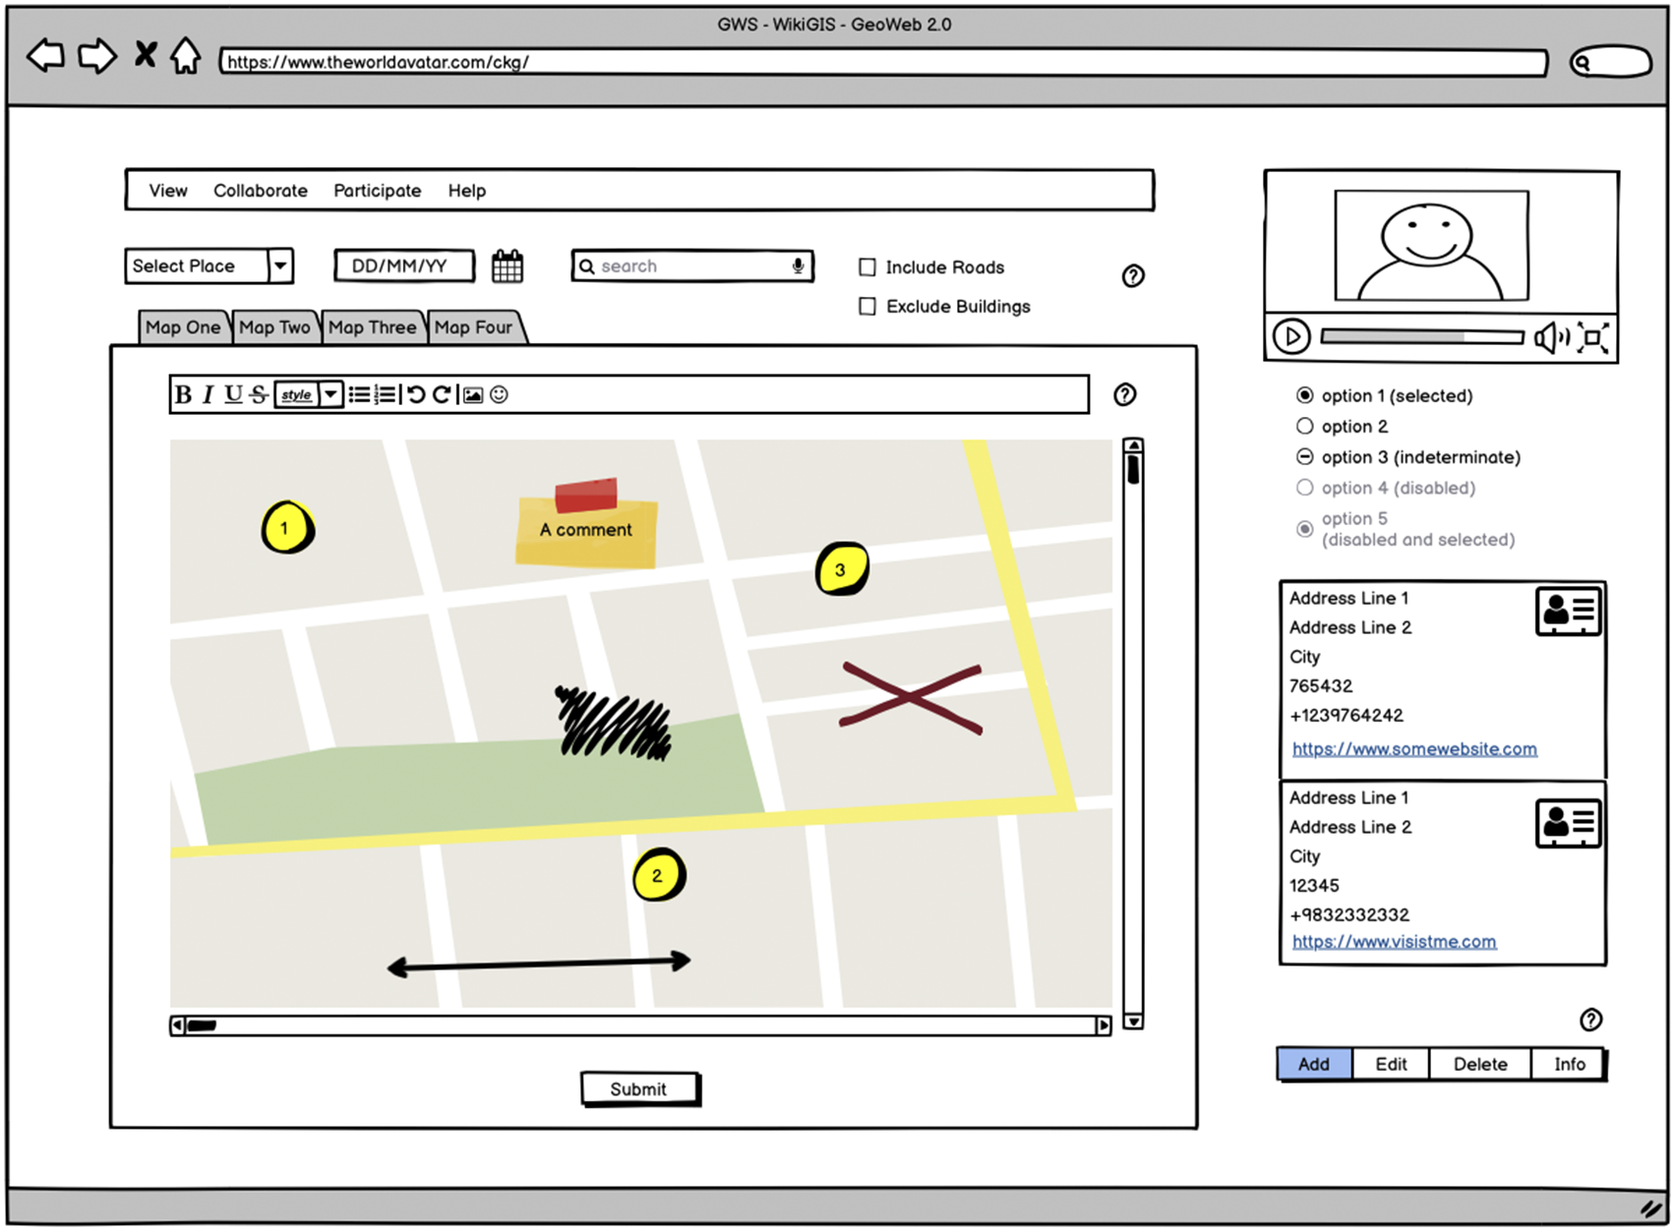
To implement the collaborative elements presented in the wireframe, the system would need map editor capabilities that could be either added to the current web-map client or replaced by some other library. Present user interfaces would also need appropriate multimedia viewing extensions in a form of dedicated libraries or HTML5 widgets. Apart from additional agents responsible for handling such type of content, the system would need authentication, authorization, and accounting layer to be capable of securely serving multiple users with various degrees of resource access permissions and ability to track any actions performed via such interface. Additionally, to store user created content, new ontologies that contain vocabularies needed to describe related metadata would have to be integrated to the system. This metadata would have to be stored in the knowledge graph together with and linked to the other geolocated data. Such data store layout would allow for the data to be compared by an agent dedicated to perform logical inferences and checking for the knowledge-base consistency. This, in turn, would provide truth maintenance capabilities for such collaborative WebGIS system.
Some researchers, like Foth et al. (Reference Foth, Odendaal and Hearn2007), even argue that only enabling such interfaces would allow the current most pressing problems that involve cities to be addressed. That includes climate change as well as social inequality problems that would help get closer to achieving sustainable development goals (UN – Sustainable Development Goals, 2022) while planning cities in a modern way, by producing a comprehensive “view from everywhere” and giving a voice even to previously marginalized groups of stakeholders. According to Hudson-Smith et al. (Reference Hudson-Smith, Crooks, Gibin, Milton and Batty2009), the ability of many to engage and interact is the key feature that defines Web 2.0. Controls and interface elements from it should be added to the GWS’ in order to make them capable of supporting this functionality as well. This type of web of ordinary web stakeholder empowerment is also seen as a critical success factor of the GeoWeb 2.0 systems (Pak and Verbeke, Reference Pak and Verbeke2014).
4.4. WikiGIS—Risks and mitigation
Despite technology obstacles that generally require a higher level of programming knowledge to get started with web-mapping in contrast to “mash ups” that are built around the more accessible programming interfaces of Web 2.0 tools, neogeographers still show a strong preference for using such toolset over more traditional ones. As noticed by Hall et al. (Reference Hall, Chipeniuk, Feick, Leahy and Deparday2010) during field experiments, while the participants had the option of recording their assets on supplied article maps, most opted to use the web tools to select existing features, create new features, make associated comments, and use the software to chat with other participants about features of mutual interest. However, this shortening of “time to market” of geospatial content on the Web 2.0 comes with its own costs. Credibility assessment of crowd-sourced information could be very complex and not always conclusive (Flanagin and Metzger, Reference Flanagin and Metzger2008). Such systems, similarly to the other Web 2.0 systems, are also open to deliberate misinformation. Although the geo-web stakeholders already provide informal community-based data quality control, the robust mechanisms needed to detect and remove errors, and to build the same level of trust and assurance that national mapping agencies have traditionally enjoyed are absent in such systems so far (Goodchild, Reference Goodchild2007). At the same time, geographic information is critical as far as local- and country-level governance processes are concerned. Opening it to deliberate misinfluencing in systems not offering the mentioned mechanisms poses high levels of misgoverning risks.
The presented system architecture and interfaces already allow the TWA to avoid typical Web 2.0 risks. However, to get closer to the GeoWeb 3.0, the current system foundations need to be strengthened even further. Apart from logically evaluated Tboxes that provide languages describing cities and related information, there is a necessity to add components and processes that are capable of similar Abox evaluations performed at scale. The JPS Agent Framework, together with the Agent Composition Framework, provide means for the development of agents responsible for ground truth maintenance by automating existing inferencing engines and autonomously working with the knowledge graph in the background. Making those agents work on a blockchain-based agent marketplace within TWA would also allow for agent-based knowledge provenance tracking, independently of the model related knowledge persistence layer. This future work, moving dynamic geospatial knowledge graphs even beyond GeoWeb 2.5, could be regarded as the next brick in paving the road toward self-sustainable knowledge graphs.
Abbreviations
- CARES
-
Cambridge Centre for Advanced Research and Education in Singapore
- CEA
-
City Energy Analyst
- CExA
-
City Export Agent
- CIA
-
City Information Agent
- CIM
-
city information model
- CWA
-
closed world assumption
- DA
-
Distance Agent
- DL
-
description logic
- DT
-
digital twin
- EIP
-
eco-industrial park
- ETH
-
Eidgenössische Technische Hochschule Zürich
- GML
-
geography markup language
- HTTP
-
hypertext transfer protocol
- IRI
-
internationalized resource identifier
- JDBC
-
Java database connectivity
- JPS
-
J-Park simulator
- JSON
-
JavaScript object notation
- LODx
-
level of detail x
- OWL
-
web ontology language
- OBDA
-
ontology-based data access
- OGC
-
Open Geospatial Consortium
- OWA
-
open-world assumption
- RDF
-
resource description framework
- RDBMS
-
relational database management system
- SEC
-
Singapore-ETH Centre
- SQL
-
structured query language
- SPARQL
-
SPARQL protocol and RDF query language
- TSDA
-
Thematic Surface Discovery Agent
- TUM
-
Technische Universität München
- TWA
-
The World Avatar
- URL
-
uniform resource locator
- URI
-
uniform resource identifier
- W3C
-
World Wide Web Consortium
- WKT
-
well-known text
- XML
-
extensible markup language
Acknowledgments
The authors would like to thank Andrew Breeson for help with proofreading and language correction of the article.
Author contribution
Conceptualization: A.C., S.L., A.G., J.A., M.H., J.Y., H.Y.T., E.L., P.H., M.K.; Data curation: A.C., S.L., A.G., J.C., J.A., M.H., Y.K.T., J.Y., H.Y.T., E.L., M.A.; Formal analysis: A.C., J.A., P.H., M.K.; Funding acquisition: J.A., P.H., M.K.; Investigation: A.C., S.L., A.G., H.Y.T., M.H., Y.K.T., E.L., J.A., P.H., M.K.; Methodology: A.C., J.A., P.H., M.K.; Project administration: A.C., J.A., P.H., M.K.; Resources: A.C., J.A., P.H., M.K.; Software: A.C., S.L., A.G., J.C., J.Y., H.Y.T., M.H., Y.K.T., E.L., M.A.; Supervision: A.C., J.A., P.H., M.K.; Validation: A.C., S.L., A.G., J.C., J.Y., H.Y.T., M.H., Y.K.T., E.L., M.A., J.A., P.H., M.K.; Visualization: A.C., S.L., A.G., J.C., J.Y., H.Y.T., E.L., M.A.; Writing—original draft: A.C., S.L., A.G., J.C., J.Y., H.Y.T., E.L., M.A.; Writing—review and editing: A.C., P.H., M.K. All authors approved the final submitted draft.
Competing interest
The authors declare no competing interests exist.
Data availability statement
Sample data used to demonstrate capabilities of the dynamic geospatial knowledge graph in The World Avatar can be found at https://www.businesslocationcenter.de/en/economic-atlas/download-portal/. Interactive demonstration of the user interfaces can be found at http://www.theworldavatar.com/.
Funding statement
This research is supported by the National Research Foundation, Prime Minister’s Office, Singapore under its Campus for Research Excellence and Technological Enterprise (CREATE) program. M.K. gratefully acknowledges the support of the Alexander von Humboldt Foundation. The research was conducted as part of an Intra-CREATE collaborative project involving CARES, which is University of Cambridge’s presence in Singapore, and Future Cities Laboratory at the Singapore-ETH Centre, which was established collaboratively between ETH Zurich and the National Research Foundation Singapore.
Supplementary material
The supplementary material for this article can be found at http://doi.org/10.1017/dce.2023.14.


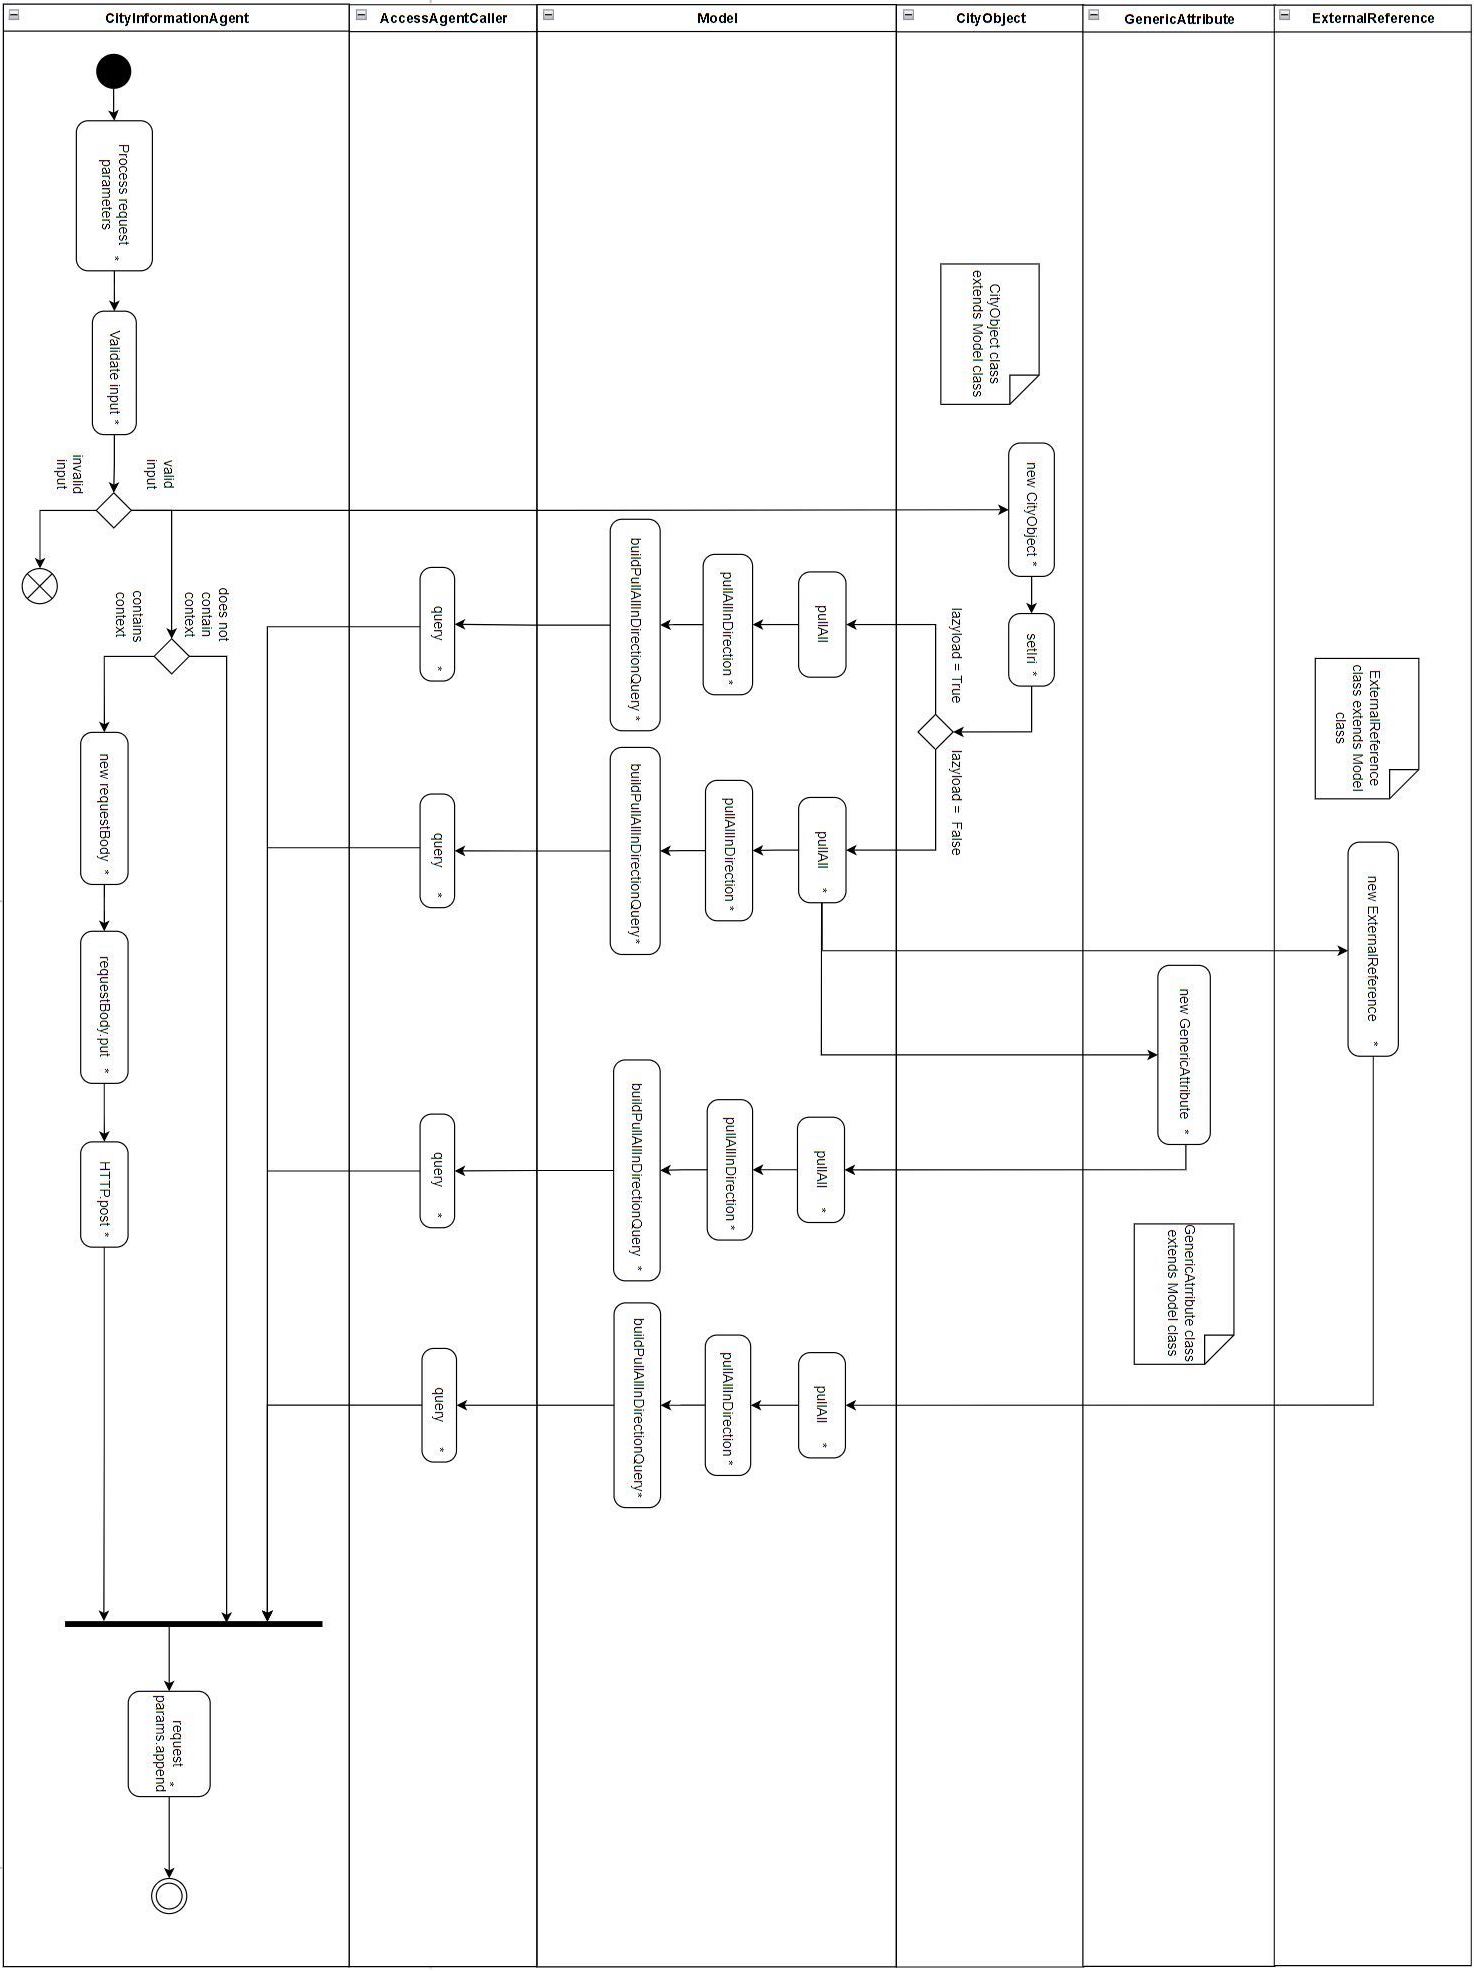
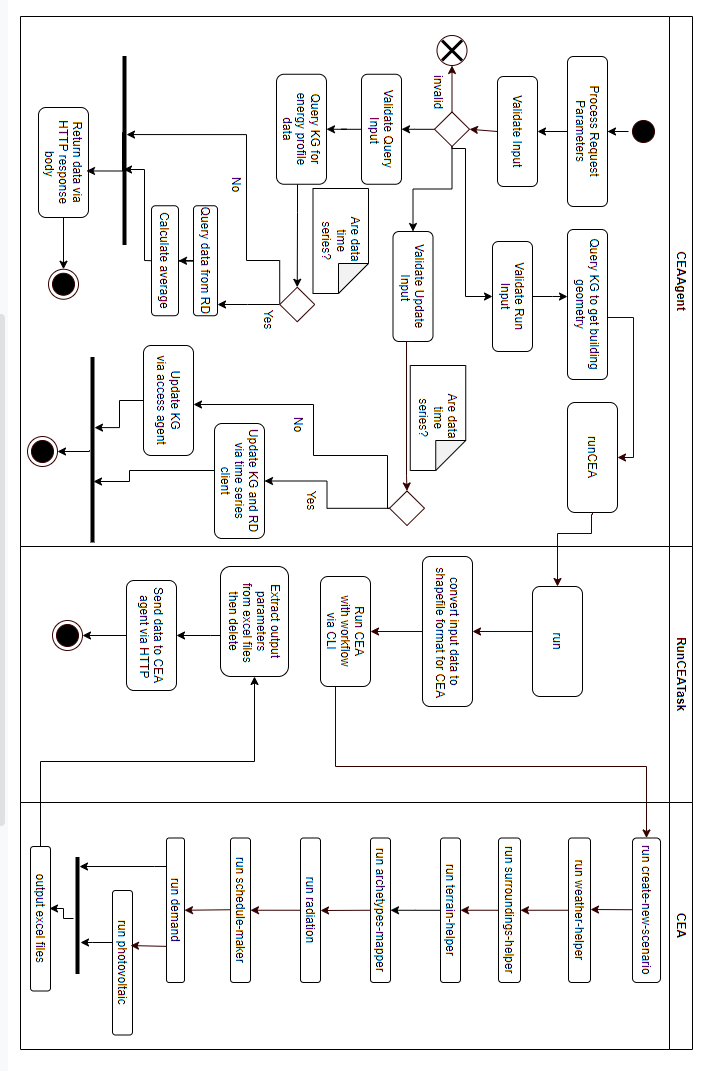

 Open access
Comments
No Comments have been published for this article.