

INTRODUCTION
Estimating the burden of malaria and evaluating the impact of control strategies, requires reliable estimates of transmission intensities [Reference Corran1]. Measures of malaria transmission intensity include the entomological inoculation rate (EIR), parasite prevalence and force of infection (FOI) [Reference Corran1–Reference Kamya6]. The EIR is defined as the number of infectious bites per person per unit time [Reference Onori and Grab2, Reference Onori and Grab7], whereas the FOI is defined as the number of infections per person per unit time [Reference Smith4] or the per capita rate at which a susceptible individual acquires infection [Reference Coutinho8, Reference Hens9]. The malaria FOI counts all incident (i.e., new) human malaria infections in a specified time interval regardless of clinical symptoms and recurrent infections [Reference Smith4]. The EIR and FOI are related but differ; the EIR considers the number of infective bites delivered by the mosquito vector, whereas the FOI focuses on the infections acquired by the human host. In theory, there should be close relationship between the EIR and the FOI, especially in children with less developed immunity. In practice, however, there is a discrepancy between the two because not every infectious bite results in an infection due to various factors [Reference Smith and McKenzie10]. The efficiency of transmission can be estimated by taking the ratio of the two measures, i.e., the ratio of the EIR to the FOI, the number of infectious bites required to cause an infection [Reference Smith and McKenzie10]. A smaller ratio of the EIR to the FOI implies higher transmission efficiency. Most studies have shown that malaria transmission is highly inefficient [Reference Smith4]; whereas more recently malaria FOI has been estimated from serological data [Reference Corran1, Reference Von Fricken11] by detecting past exposure to malaria infection, here we focus on estimating malaria FOI from parasitaemia data [Reference Bekessy, Molineaux and Storey12–Reference Singer and Cohen14].
Despite well-recognized heterogeneity in malaria transmission [Reference Smith15, Reference Smith16], the FOI is often estimated ignoring intrinsic variability in the individual risk of malaria infection. Heterogeneity in malaria infection arises due to variability in risk factors, including environmental, vector and host-related factors [Reference White17]. Taking these sources of heterogeneity into account [Reference Smith15, Reference White17] in population-based epidemiological studies has been shown to be important [Reference Coutinho8].
Ronald Ross first published a mathematical model for malaria transmission in 1908 [Reference Smith16, Reference Ross18]. This model was only firmly established in 1950 by the work of George Macdonald who used Ross's idea [Reference Smith16]. The ‘Ross–Macdonald’ model describes a simplified set of concepts that serves as a basis for studying mosquito-borne pathogen transmission [Reference Smith16]. Using this concept, mathematical methods to estimate the FOI in relation to the EIR have been proposed by, e.g., Smith et al. [Reference Smith3, Reference Smith4], Keeling and Rohani [Reference Keeling and Rohan19] and Aguas et al. [Reference Aguas20]. Some of the parameters involved in these models are often unknown and should be estimated from data [Reference Hens21]. A solution proposed by Ross in 1916 is to iterate between two modelling frameworks, that is, mathematical and statistical models [Reference Hens21, Reference Ross22]. The major difference in these two is that the mathematical models (priori) are based on differential equations describing the biological mechanism and causal pathway of transmission, whereas the statistical models (posteriori) start by the statistical analysis of observations and work backwards to the underlying cause [Reference Hens21]. These two frameworks complement each other and, here, we provide an explicit link between them.
In this paper, we use the well-known generalized linear mixed model (GLMM) framework (see, e.g., [Reference Keeling and Rohan19]) to estimate the point prevalence accounting for both observed and unobserved heterogeneity and show how the FOI can be obtained from the point prevalence based on a mathematical Susceptible–Infected–Susceptible (SIS) model. We derive an expression and easy-to-calculate bounds of the FOI for varying parasite clearance distributions. Our results can be used to refine mathematical malaria transmission models.
METHODS
Source of data
The results in this paper are based on cohort data from children aged 0·5–10 years in three regions in Uganda: Nagongera sub-county, Tororo district; Kihihi sub-county, Kanungu district; and Walukuba sub-county, Jinja district. The data were collected as part of the Program for Resistance, Immunology, Surveillance and Modelling of malaria (PRISM) study. The study regions are characterized by distinct transmission intensities. The EIR was previously estimated to be 310, 32 and 2·8 infectious bites per unit year, respectively, for Nagongera, Kihihi and Walukuba [Reference Kamya6]. The study participants were recruited from 300 randomly selected households (100 per region) located within the catchment areas. Data were routinely collected every 3 months (routine visits) and for non-routine clinical (symptomatic) visits. Individuals were tested for the presence of Plasmodium parasites using microscopy from August 2011 to August 2014 (3 years). All symptomatic malaria infections were treated with artemether–lumefantrine (AL) anti-malarial medications. More detailed information regarding the study design can be found in Kamya et al. [Reference Kamya6]. Given that for clinical visits the sampling process is outcome dependent (see the ‘Discussion’ section), the analysis here is restricted to the planned routine visits yielding unbiased estimates (simulation study, not shown).
The SIS model, point prevalence and FOI
A simplified version of malaria transmission can be described using the so-called SIS compartmental transmission model. This mathematical model classifies the population into two compartments, i.e., the susceptible (S) and the infected (I) class, which can be graphically depicted as shown in Figure 1.
A schematic diagram of the SIS compartmental model illustrating the simplified dynamics for malaria transmission.

Here, the rate λ(t) at which individuals leave the susceptible state S at time t and flow to the infected state I, as they are infected with malaria parasites, is referred to as the FOI. Furthermore, γ represents the time-invariant clearance rate at which individuals regain susceptibility after clearing malaria parasites from their blood. Let s(t) denote the proportion of susceptible individuals in the population and i(t) the proportion of infected individuals at calendar time t, i.e., the (point) prevalence, then the following set of ODEs (ordinary differential equations) describes transitions in the compartmental SIS model:
 $$\left\{ {\matrix{ {{s}^{\prime}(t)\; = \; - \lambda (t)s(t)\; + \; \gamma i(t),{\rm \; \;}} \cr {{i}^{\prime}(t)\; = \; \lambda (t)s(t)\; - \; \gamma i(t).\; \; {\rm \;}} \cr}} \right.$$
As individuals are either susceptible to infection or malaria infected (at least in the aforementioned simplified SIS model), we have s(t) = 1 − i(t). Substituting this expression for s(t) into (1) yields:
 $${\rm \lambda} ({\rm t}) = \displaystyle{{i(t)\gamma \; + \; {i}^{\prime}(t)} \over {1{\rm \;} - {\rm \;} i(t)}},$$
where i′(t) is the derivative of the point prevalence with respect to t. The FOI λ(t) can thus be estimated using an estimate for the prevalence i(t) and the clearance rate γ.
Relaxing the assumption of an exponentially distributed parasite clearance distribution in the SIS model can be done by dividing the I compartment into J sub-compartments, such that infected individuals move from the first sub-compartment I 1 to the second I 2, and later to the J th sub-compartment I J during the different phases of clearing malaria parasites. Using identical rates γ for the transitions between these sub-compartments and for moving from I J back to the S compartment results in an Erlang distribution with shape parameter J and rate γ for the time spent in all of the sub-compartments [Reference de Smith23]. It is easily shown that equation (2) yields an upper bound for the FOI when compared with the aforementioned Erlang clearance distribution (see the Appendix). A lower bound is readily obtained by taking γ = 0 in equation (2) (SI model – see the Appendix). The FOI is thus bounded by [λ L (t), λ U (t)] = [i′(t)/(1 − i(t)), ((i′t) + γi(t))/(1 − i(t)))].
Estimates for both the exponential assumption (upper bound) as well as the lower bound are presented in this paper. In order to estimate the prevalence π(t) ≡ i(t), we use a GLMM to account for individual- and household-specific clustering. This will enable us to explicitly model the observed and unobserved heterogeneity in the acquisition of malaria infection.
Generalized linear mixed model
GLMMs extend the well-known generalized linear models by explicitly taking into account (multiple levels of) clustering of observations [Reference Molenberghs and Verbeke24].
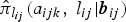
Let Y ijk denote the binary response variable indicating parasitaemia in the blood (1 if parasites are present – malaria infected; and 0 if not – malaria uninfected) for the i th individual nested in the J th household at the k th visit. Similarly, let X ijk be a (p + 1) × 1 vector containing covariate information on p independent variables, and Z ijk be a q × 1 vector of information associated with q random effects. Given the subject-specific random effects b ij and the covariate information X ijk , the random variables Y ijk |X ijk are assumed to be conditionally independent with conditional mean π(X ijk | b ij ) = E(Y ijk |X ijk , b ij ) = P(Y ijk = 1|X ijk , b ij ). The GLMM relates the conditional mean to the covariates X ijk and Z ijk as follows:
 $$\eqalign{g\left[ {\pi (X_{ijk}{\rm \vert} {\bi b}_{ij})} \right] & = g\left[ {P(Y_{ijk} = 1{\rm \vert} X_{ijk},\; \;{\bi b}_{ij})} \right] \cr & = \; X_{ijk}^T {\bi \beta} + Z_{ijk}^T {\bi b}_{ij}.}$$
Here, g is a monotonic link function (e.g., logit, cloglog and log);
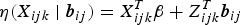 $\eta (X_{ijk}\; \vert\; {\bi b}_{ij})=X_{ijk}^T {\bi \beta} + Z_{ijk}^T {\bi b}_{ij}$
is the linear predictor with
β
a vector of unknown regression parameters for the fixed effects;
$\eta (X_{ijk}\; \vert\; {\bi b}_{ij})=X_{ijk}^T {\bi \beta} + Z_{ijk}^T {\bi b}_{ij}$
is the linear predictor with
β
a vector of unknown regression parameters for the fixed effects;
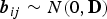 ${\bi b}_{ij} \sim N(0,{\bf D})$
a vector of subject-specific random effects for subject i in household j for which elements are assumed to be mutually independent; and
${\bi b}_{ij} \sim N(0,{\bf D})$
a vector of subject-specific random effects for subject i in household j for which elements are assumed to be mutually independent; and
 ${\bf D}$
a q × q variance–covariance matrix [Reference Zhang and Lin25].
${\bf D}$
a q × q variance–covariance matrix [Reference Zhang and Lin25].
Using equations (2) and (3), the FOI can be obtained using different link functions. Table 1 presents the prevalence and FOI when selecting either the logit, cloglog or log-link function in the GLMM.
General structures for the FOI according to different link functions in a GLMM framework

η refers to the linear predictor η(X ijk | b ij ) and η′ represents the derivative of the linear predictor with respect to the predictor of interest.
Flexible parametric modelling
In a parametric framework such as the GLMM, fractional polynomials provide a very flexible modelling tool for the linear predictor η(X ijk | b ij ) [Reference Hens21, Reference Faes26, Reference Shkedy27]. In this paper, a GLMM using a fractional polynomial of degree one with regard to age, with power p selected from a grid (−3, −2, −1, −0·5, 0, 0·5, 1, 2, 3) using Akaike's information criterion (AIC), is used [Reference Akaike28]. More precisely, we use
 $$\eqalign{\eta (X_{ijk}\; \vert \; {\bi b}_{ij}) & = \eta (a_{ijk}\;, {\rm \;} l_{ij} \vert {\bi b}_{ij}) \cr & = \beta _0 + \beta _1\; {\rm age}_{ijk}^p + \beta _2l_{ij} + b_{0i\left( j \right)} \cr & \quad + b_{1i(\,j)}{\rm age}_{ijk}^p,}$$
where b 0i(j) is the nested random intercept and b 1i(j) is the nested random slope for age. Nesting is done to explicitly acknowledge that individuals make up households. Furthermore, shifted year of birth: l ij , defined as the child's birth year minus the birth year of the oldest child in the cohort (i.e., baseline year 2001), is used in the model to account for the (calendar) time effect since [calendar time] = [birth year] + [age]. The linear predictor (4) can be further extended to include additional covariates.
Age-time-dependent FOI
In equation (3), the conditional mean π(X ijk | b ij ) is the point prevalence conditional on the random and fixed effects. In this paper, we use the logit-link function, which enables easy calculation of the ICC (intra-cluster correlation coefficient) through an approximation indicating how much the elements within a cluster are correlated [Reference Molenberghs and Verbeke24, Reference Musca29, Reference Wu, Crespi and Wong30].
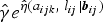
The age-time-dependent FOI, conditional on random effects, is estimated by plugging in the parameter estimates obtained from the final fit in equation (2). More specifically, using a logit-link, the conditional age-time-dependent FOI is estimated as follows:
 $$\eqalign{{\hat \lambda}_{l_{ij}}(a_{ijk} \vert {\bi b}_{ij}) & = \hat \gamma e^{\hat \eta (a_{ijk},\;l_{ij} \vert {\bi b}_{ij})} \cr & \quad + \hat \eta ^{\prime}(a_{ijk},\;l_{ij} \vert {\bi b}_{ij})\hat \pi _{l_{ij}}(a_{ijk},\;l_{ij} \vert {\bi b}_{ij})}$$
where
 $\hat \gamma $
is an estimate for the clearance rate and
$\hat \gamma $
is an estimate for the clearance rate and
 $\hat \pi _{l_{ij}}(a_{ijk},\;l_{ij}\vert{\bi b}_{ij})$
is the estimated age- and time-dependent conditional prevalence. For the lower boundary of FOI,
$\hat \pi _{l_{ij}}(a_{ijk},\;l_{ij}\vert{\bi b}_{ij})$
is the estimated age- and time-dependent conditional prevalence. For the lower boundary of FOI,
 $\hat \gamma e^{\hat \eta (a_{ijk},\;l_{ij}\vert{\bi b}_{ij})}$
is omitted in equation (5). In the above expression, an estimate for the clearance rate γ is required. Previously, Bekessy et al. [Reference Bekessy, Molineaux and Storey12] estimated annual clearance rates of 1·643, 0·584 and 0·986 years−1 for children aged <1, 1–4 and 5–8 years, respectively. Later, Singer et al. [Reference Singer and Cohen14] estimated these rates as 1·917, 1·425 and 2·364 years−1 for ages <1, 1–4 and 5–8 years, respectively. Sama et al. [Reference Sama, Dietz and Smith13] estimated a constant annual clearance rate of 1·825 years−1 by assuming an exponential distribution for infection duration or parasite clearance. Most recently, Bretscher et al. [Reference Bretscher31] studied the parametric distributions of the infection durations using Ghanaian data, and concluded based on AIC that a Weibull distribution gave a better fit to the data followed by a gamma distribution, while an exponential one was performing worst. In this paper, we use both exponential and Erlang clearance distributions to derive estimates for the malaria FOI obtained based on the aforementioned clearance rates as distributional parameters.
$\hat \gamma e^{\hat \eta (a_{ijk},\;l_{ij}\vert{\bi b}_{ij})}$
is omitted in equation (5). In the above expression, an estimate for the clearance rate γ is required. Previously, Bekessy et al. [Reference Bekessy, Molineaux and Storey12] estimated annual clearance rates of 1·643, 0·584 and 0·986 years−1 for children aged <1, 1–4 and 5–8 years, respectively. Later, Singer et al. [Reference Singer and Cohen14] estimated these rates as 1·917, 1·425 and 2·364 years−1 for ages <1, 1–4 and 5–8 years, respectively. Sama et al. [Reference Sama, Dietz and Smith13] estimated a constant annual clearance rate of 1·825 years−1 by assuming an exponential distribution for infection duration or parasite clearance. Most recently, Bretscher et al. [Reference Bretscher31] studied the parametric distributions of the infection durations using Ghanaian data, and concluded based on AIC that a Weibull distribution gave a better fit to the data followed by a gamma distribution, while an exponential one was performing worst. In this paper, we use both exponential and Erlang clearance distributions to derive estimates for the malaria FOI obtained based on the aforementioned clearance rates as distributional parameters.
Often, an investigator may wish to observe population averaged estimates. Under the random effects framework, this can be achieved by taking the expectation of the conditional estimates (e.g., the FOI in (5)) resulting into unconditional or marginal estimates. Using the logit-link function, the unconditional (population) FOI is given by
 $$\eqalign{\lambda _{l_{ij}}(a_{ijk}) & = E(\lambda _{l_{ij}}(a_{ijk} \vert {\bi b}_{ij})) \cr & = E(\gamma e^{\eta (a_{ijk} , l_{ij}\vert {\bi b}_{ij})} \cr & \quad + {\eta} ^{\prime}(a_{ijk},l_{ij} \vert {\bi b}_{ij}){^\ast}\pi _{l_{ij}}(a_{ijk},l_{ij} \vert {\bi b}_{ij})).}$$
Calculation of the marginalized FOI in (6), requires integrating out the random effects, b ij , over their fitted distribution. This can be done using numerical integration techniques or based on numerical averaging [Reference Molenberghs and Verbeke24].
Model selection
Model building was done using both AIC [Reference Schwarz32] and a likelihood ratio test for the random effects based on the appropriate mixture of chi-square distributions [Reference Verbeke and Molenberghs33]. Backward model building was performed starting with the random effects and then the fixed effects. The covariates considered in the model-building process included study site, age, time since enrolment, shifted birth year (i.e., shifted birth year = birth year–birth year of the oldest child), previous use of AL treatment and the infectious status at the previous visit. The covariates, ‘time since enrolment’ and ‘shifted birth year’ were generated to represent the calendar time, albeit we preferred the latter one since participants were not enrolled at the same time point.
RESULTS
Of 989 children, recruited between August 2011 and August 2014, 334 (33·8%), 355 (35·9%) and 300 (30·3%) were from Nagongera, Kihihi and Walukuba, respectively. The baseline parasite prevalence among children aged below 5 years was 38·2%, 12·8% and 9·5% for Nagongera, Kihihi and Walukuba, respectively. The monthly parasite prevalence was higher in Nagongera (range: 26·7–68·4%) followed by Kihihi (range: 7·0–68·0%) and lastly by Walukuba (range: 0–42·9%). Other summary statistics are presented in Table 2. In general, the prevalence was higher among older children (5–10 years).
Recruited number of children, baseline and monthly parasite prevalence, by study site and age group

a Parasite prevalence.
The parasite prevalence increases with age particularly for children <3 years of age and after 7 years of age a decrease is observed (Fig. 2, panel A). The prevalence increases with calendar time in Kihihi with increasing variability, while it decreases in Walukuba, and slightly increases in Nagongera (Fig. 2, panel B). These observations suggest a difference in malaria infection risk between the three study sites. Also, the infection risk seems to vary with age and calendar time and it tends to take different trends between sites indicating a possibility for a site-time interaction effect. The relationship with age seems to be non-linear. These observed effects were taken into consideration when building the GLMM.
Proportion of children infected with malaria parasites (parasitaemia) in a cohort followed for 3 years, by study site (Nagongera, Kihihi and Walukuba) in Uganda based on data from August 2011 to August 2014 with the size of the dots proportional to the number of observations. (A) Observed parasitaemia varying with age; (B) observed parasitaemia varying with calendar time.

The mean structure in our model consists of a fractional polynomial of age with power −1 (selected based on AIC) and the following covariates (based on significance testing at 5% significance level): shifted year of birth; infection status at previous visit and AL use; and study site. Goodness-of-fit of the final model was assessed using the ratio of the generalized Chi-square statistic to its degrees of freedom. A value of 0·74 was obtained, which is fairly close to 1, indicating that the variability in these data seems to be adequately modelled and little residual overdispersion remains present [Reference Wang, Xie and Fisher34].
The parameter estimates, standard errors, and corresponding test results of the final GLMM fit are shown in Table 3. More details about the candidate models can be found in the Appendix (Tables A1 and A2) together with the fitted conditional and marginal prevalences for the different AL use categories (Fig. A2). The results in Table 3 show an overall significant effect of age and shifted year of birth; the effect of age and shifted year of birth is non-significant and borderline significant, respectively, for Walukuba, whereas the effect of age is significant for Kihihi and Nagongera. Shifted year of birth is significant for Kihihi and non-significant for Nangongera. There is significant heterogeneity in the rate of acquiring malaria infection between households (Walukuba: variance = 2·80; Kihihi: variance = 1·16; Nagongera: variance = 0·21) and between household members (variance = 0·24). The intra-household correlation coefficients are 0·44, 0·25 and 0·06 for Walukuba, Kihihi and Nagongera, indicating moderate, low and very low correlation within households, respectively. The intra-individual correlation coefficients are 0·04, 0·05 and 0·06 for Walukuba, Kihihi and Nagongera, respectively, indicating very low correlation in all sites.
Estimates of the fitted GLMM using a fractional polynomial of degree 1 for age and a logit-link function

a Birth year – min (birth year).
b Note that the OR here should be interpreted at the Age−1 level.
Based on the final model fit and using equations (5) and (6) both the conditional (given the random effects) and marginal (population averaged) FOIs can be calculated provided that γ can be estimated. However, estimating γ from the same data is not possible due to an identifiability problem: two or more distinct values of γ give rise to the same (log)likelihood (see Fig. A1 in the Appendix). Therefore, we use γ equal to the annual clearance rates given by Bekessy et al. [Reference Bekessy, Molineaux and Storey12] as 1·643, 0·584 and 0·986 years−1 for children aged <1, 1–4 and 5–10 years, respectively, to calculate the conditional and marginal FOIs. We further conduct a sensitivity analysis by considering different clearance rates ranging from 0 to 3 motivated by the ranges estimated by Bekessy et al. [Reference Bekessy, Molineaux and Storey12], Singer et al. [Reference Singer and Cohen14], Sama et al. [Reference Sama, Dietz and Smith13] and Bretscher et al. [Reference Bretscher31] (see Fig. 5, top row). As discussed before, we also provide lower bounds for the FOI.
Figure 3 shows estimates for the marginal FOI together with the corresponding lower bound estimates. We focused on children who were born in the baseline year for graphical reasons. Similar plots were obtained (not shown) for other birth years. Estimates for the lower boundary of the FOI were higher in Nagongera followed by Kihihi and Walukuba. For Nagongera and Walukuba, the lower bound for the FOI was highest for children aged below 1 year and least in those aged 5–10 years, yet. In Kihihi, it is highest among those aged 1–4 years.
The lower bound (green) for the marginal annual FOI and the difference between upper and lower bound (yellow) with full bar showing the upper bound for the FOI, by study site, age group (A, <1 year; B, 1–4 years; and C, 5–10 years) and the infection status at the previous visit and past use of AL (negative and no AL in the past (left column), negative and AL in the past (second left column), symptomatic (second right column) and asymptomatic (right column)) for children assumed to be born in the baseline year (2001). Top row, Nagongera; middle row, Kihihi; bottom row, Walukuba.

Figure 3 further shows that in Nagongera and Kihihi, the estimates for the marginal FOI were highest among children aged 5–10 years; yet in Walukuba it was highest among those aged below 1 year. The values for the marginal FOI obtained using the upper boundary estimator, stratified by site, age group and the previous infection status and use of AL are given in Table A3 in the Appendix. At the extreme, the previously symptomatic children acquire up to four infections per year in Nagongera, and eight infections per year both in Kihihi and Walukuba. Overall, the FOI is highest among the asymptomatic children and smallest among previously symptomatic children across all age groups and sites (Fig. 3 and Table 3A). Although Figure 3 clearly shows the impact of different distributional assumptions with regard to the clearance time, the lower and upper bound estimates do not fully capture uncertainty around the point estimates. In Table A4 of the Appendix, we show the 95% confidence bounds for the age- and time-dependent FOI.
Figure 4 (top row) shows the predicted conditional FOIs for 50 randomly selected individual profiles at each of the three sites based on the lower boundary estimator for the FOI. For graphical purposes, we focused on subjects who were symptomatic at the previous visit and who were born in the baseline year. However, similar plots are obtained for other levels of the infection status at the previous visit and for different birth years. Figure 4 (bottom row) shows the predicted marginal FOIs again based on the lower boundary estimator, by age (continuous scale) and infection status at the previous visit and past AL use. In general, the lower boundary estimator indicates that younger children have the greatest FOI. In all sites, individuals that were asymptomatic at the previous visit have the highest FOI, regardless of age. The depicted conditional FOI curves show that individuals have different profiles, indicating substantial unobserved heterogeneity. The increasing trend in the FOI from 6 months of age is likely attributed to loss of maternal immunity in infants [Reference Riley35].
Top row: Individual-specific evolutions for the conditional annual FOI obtained using the lower boundary estimator, by study site for children assumed to be symptomatic at the previous visit and who were born in the baseline year (2001). Bottom row: The marginal annual FOI, obtained using the lower boundary estimator, by study site and the infection status at the previous visit and past use of AL (negative and no AL in the past (solid lines), negative and AL in the past (dotted lines), symptomatic (dash-dotted lines) and asymptomatic (long-dashed lines)). Left column, Nagongera; middle column, Kihihi; right column, Walukuba.

Figure 5 (top row) shows the marginal FOIs for different clearance rates ranging from 0 up to 3 years−1 (y-axis). For graphical purposes, and without loss of generality, we again focused on subjects who were symptomatic at the previous visit and who were born in the baseline year. The colour gradient from green (dark) to brown (light) in Figure 5 (top row) corresponds to an increasing FOI. The figure indicates that in Nagongera and Kihihi, children who are below 1 year of age have a lower FOI (green colour) regardless of the presumed clearance rate. Also, in Nagongera and Kihihi, the risk for malaria infection increases with increasing clearance rate, except for the younger children <1–2 years. In Walukuba, the FOI increases with increasing clearance rate regardless of age.
Top row: The marginal annual FOI (contour lines) considering different values for the clearance rate ranging from 0 to 3 years−1 by study site for individuals assumed to be symptomatic at the previous visit and were born in the baseline year. Bottom row: The marginal annual FOI, obtained using the upper boundary estimator, for individuals assumed to be symptomatic at the previous visit, by study site, birth year (2001, 2004, 2007 and 2010) and by age group (A: <1 year, B: 1–4 years, and C: 5–10 years). Left panel, Nagongera; middle panel, Kihihi; right panel, Walukuba.

Figure 5 (bottom row) shows how the FOI varied with age groups (A ⩽ 1 year, B = 1–4 years, C = 5–10 years) and calendar time among subjects assumed to be symptomatic at the previous visit. In Kihihi, the risk of acquiring a new malaria infection is slightly higher for children born in 2010 compared with those born in earlier years across age groups but not for Nagongera and Walukuba. This would be expected since children born at a later year are younger than those born at an earlier year, and hence are at a higher risk of infection.
DISCUSSION
In this paper, we use data from a cohort study to estimate the malaria FOI among Ugandan children while accounting for observed and unobserved heterogeneities. The results clearly demonstrate the existence of heterogeneity in the acquisition of malaria infections, which is greater between households than between household members. These observations emphasize the claim by White et al. [Reference White17] that heterogeneity in malaria infection can arise due to several unobserved factors, including environmental, vector and host-related factors. This implies that estimating the malaria transmission parameters assuming homogeneity in the acquisition of infection may yield misleading results.
The findings were based on the use of a readily available statistical method, the GLMM, which takes into account heterogeneity between individuals and households in the acquisition of malaria infection. In particular, a fractional polynomial of age of degree 1 and power −1, adjusted for the calendar time, by means of the so-called ‘shifted birth year’ (i.e., shifted birth year = birth year–birth year of the oldest child), and other covariates, was considered. The fractional polynomial was chosen because it provides a very flexible modelling tool while retaining the strength of a parametric function. The random slope effects for the fractional polynomial function of age resulted in negative estimates for the FOI, which are biologically implausible and therefore the random slopes were dropped. This could be perceived as a drawback of using the GLMM in combination with fractional polynomials and a more mechanistic approach in which heterogeneity is taken into account at different levels could prove valuable here (further research). When allowing for serial correlation in the model through the specification of an AR(1) correlation structure, the model failed to converge, indicating that too little information was available in the PRISM data to accommodate serial correlation, at least when assuming that the AR(1) assumption is appropriate. An in-depth investigation thereof is an interesting topic for further research.
Based on the SIS model, we derived an expression relating the FOI to the prevalence for infectious diseases such as malaria where we cannot assume lifelong immunity. This expression is an extension of the one proposed by Hens et al. [Reference Hens21] for a so-called SIR model assuming lifelong immunity after recovery, an assumption, which is untenable for malaria. A compartmental model, which can account for temporally recovery due to prior use of treatment (induced immunity) or due to previous exposure to infection (acquired immunity), that is, Susceptible–Infected–Recovered(Treatment)–Susceptible (SIR(T)S), would potentially offer a better alternative compared with the more restrictive SIS model. However, an SIR(T)S model does not yield a closed-form expression for the point prevalence, and hence, for the FOI. Nevertheless, the derivations are approximately valid for an SIR(T)S model with short recovery duration (derivations not included here). Consequently, we focused on the SIS model, albeit that we adjusted for the previous infection status and treatment in our model. The standard SIS compartmental model assumes that the clearance rate is exponentially distributed. We derived two estimators for the FOI, which provide a lower and upper boundary for the FOI based on different Erlang distributions for the clearance rate. The lower boundary approximately holds for a scenario in which the clearance rate is small compared with the FOI. Although mathematical models encompassing more complicated and more realistic transmission dynamics for malaria could be considered, we defer their treatment to future research in which we will combine Nonlinear Mixed Model (NLMM) methodology and numerical approaches for the estimation of the model parameters in the presence of unobserved heterogeneity.
The temporal inhomogeneity observed in the data is not in contradiction with the SIS model we used. Heterogeneity, age and temporal aspects are addressed in the GLMM, through the specification of random effects as well as age- and calendar time variables; whereas derivations from the SIS model under endemic equilibrium enable the estimation of the age- and time-dependent FOI from the estimated age- and time-dependent parasite prevalence. Furthermore, estimation of the reproduction number can be done when focusing on the underlying mechanistic modelling of the FOI. However, we deem this to be beyond the scope of this specific manuscript. Seasonality is not explicitly modelled here; however, inclusion of a covariate describing the amount of rainfall, due to the absence of a clear distinction between the different seasons, and based on additional information (not part of the PRISM data) would be an interesting topic for further research.
When the clearance rate is considered negligible, the rate at which children get infected is highest among those between 1 and 2 years. When the clearance rate is non-negligible, the infection rate is higher among children older than 5 years in areas with high and medium transmission (e.g., Nagongera and Kihihi) and higher in children below 1 year in areas with low transmission (e.g., Walukuba). In Kihihi, the FOI was least for children aged <1 year and it is observed to increase as children grow up from 6 months to 1 year. This could be explained by the fact that children lose maternal immunity in their first year of life [Reference Riley35], which puts them at an increased risk of malaria infection. The higher FOI among children aged 5 years and older could be explained by the fact that these children are often asymptomatic malaria cases and are rarely treated, which makes them reservoirs for infections. This finding conquers with the work by Walldorf et al. [Reference Walldorf36] who reported that children aged 6–15 years were at higher risk of (asymptomatic) infection compared with the younger ones. They concluded that older children represent an underappreciated reservoir of malaria infection and have less exposure to antimalarial interventions.
A higher risk was seen among children in Nagongera compared with those in Kihihi and Walukuba with no significant difference between the latter two sites. This could be explained by the fact that Nagongera is a predominantly rural area with many semi-structured houses and many mosquitoes compared with Walukuba or Kihihi as was noted by Kilama et al. [Reference Kilama5]. Our results also demonstrated the importance of prior treatment in lowering infection risk due to the post-treatment prophylactic effect of longer acting anti-malarials, such as AL. For example, children who were previously treated with AL (the symptomatic malaria cases) had a lower risk of getting re-infected compared with those who were asymptomatic or negative at the previous visit.
This study has two major limitations. First, the analysis was based on results of parasite prevalence determined by microscopy, which is less sensitive than molecular methods such as PCR (polymerase chain reaction) or LAMP (loop-mediated isothermal amplification method) [Reference Poschl37, Reference Coleman38]. Thus, sub-microscopic infections would not have been detected. This could have resulted into lower estimates of the FOI. In addition, genotyping was not performed to distinguish new and recurrent infections. As a result, the FOI among individuals who were asymptomatic at the previous visit could have been overestimated. Secondly, the unscheduled clinical visits by the symptomatic individuals were triggered by the study outcome (i.e., parasitaemia). This creates a dependency between the observation-time and outcome processes. This dependence, if not accounted for, has a potential to introduce bias in the model estimates and hence in the estimation of the FOI. This bias was avoided by dropping clinical visits and by using only routine data, although the infection status and use of treatment during clinical visits was accounted for in the model. This implies that the analysis used less data than was actually available. The latter limitation will be dealt with in future research by modelling both the outcome and the observation-time processes concurrently using a joint model [Reference Tan, French and Troxel39, Reference Rizopoulos, Verbeke and Molenberghs40].
To conclude, we have used longitudinal data from a cohort of Ugandan children to estimate the malaria FOI accounting for both observed and unobserved heterogeneity. First, we show how the FOI relates to parasite prevalence assuming an SIS compartmental model and giving both lower and upper boundaries thereof by relaxing the exponential assumption with regard to the parasite clearance distribution. We estimated the parasite prevalence using a GLMM, whose estimates were used to obtain an estimate for the FOI. The malaria FOI was highest among children aged 1–2 years based on the lower boundary estimator, and it was higher among children older than 5 years in areas of high and medium transmission based on the upper boundary estimator. In a low transmission setting, the FOI was highest in children aged below 1 year regardless of the boundary estimator for the FOI. The FOI varied between study sites highest in Nagongera and least in Walukuba. Heterogeneity increases with decreasing FOI and is greater between households than household members. We recommend that estimating the malaria FOI should be done accounting for both observed and unobserved heterogeneity to enable refining existing mathematical models in which the FOI may be unknown.
ACKNOWLEDGEMENTS
Research reported in this publication was supported by the National Institute of Allergy and Infectious Diseases of the National Institutes of Health under Award Number U19AI089674. The content is solely the responsibility of the authors and does not necessarily represent the official views of the National Institutes of Health. The PRISM project gratefully acknowledges the Uganda Ministry of Health, our research team, collaborators and advisory boards, and especially all participants involved. The support from the PRISM team including Moses Kamya, Grant Dorsey, Sarah Staedke and Dave Smith is highly appreciated. Support from the IAP Research Network P7/06 of the Belgian State (Belgian Science Policy) is gratefully acknowledged. This research was supported by the Antwerp Study Centre for Infectious Diseases. LM is supported by a grant of the Vlaamse Interuniversitaire Raad (VLIR). NH gratefully acknowledges support from the University of Antwerp scientific chair in Evidence-based Vaccinology, financed in 2009–2016 by a gift from Pfizer and in 2016 by GSK.
DECLARATION OF INTEREST
None.
ETHICAL STANDARDS
The authors assert that all procedures contributing to this work comply with the ethical standards of the relevant national and institutional committees on human experimentation and with the Helsinki Declaration of 1975, as revised in 2008. The authors assert that all procedures contributing to this work comply with the ethical standards of the relevant national and institutional guides on the care and use of laboratory animals.
APPENDIX
Though, fractional polynomials are very flexible, they can result into negative estimates for the FOI whenever the estimated probability to be infected before age a is a non-monotone function [Reference Hens21, Reference Shkedy27]. A solution to this is to define a non-negative FOI, λ
l
(a
ijk
|b
i
) ⩾ 0 for all a and to estimate π
l
(a
ijk
|b
i
) under these constraints [Reference Shkedy27]. From Table 1, for a logit link function, the condition η′(a
ijk
|b
i
) ⩾ −γ/(1 − π
l
(a
ijk
|b
i
)) should be satisfied as to estimate a positive FOI. One option is to fit a constrained FP to ensure the above condition holds by applying a constraint on parameter estimates depending on the functional relationship with age. However, this approach becomes challenging especially if it involves constraining random effects. An alternative option is to find a probability of estimating a negative FOI using the model results. If this probability is considerably small, say less than 0·01, then one can consider the first option unnecessary. In this paper, the second option was applied. Indeed, all site-specific coefficients for age effect were negative (see Table 3), meaning that the site-specific derivatives for the linear predictors,
 ${\eta}^{\prime}(a_{ijk} \vert b_i) = ( - (\hat \beta _6)a_{ijk}^{ - 2}- (\hat \beta _7)a_{ijk}^{ - 2}, \; - (\hat \beta _8)a_{ijk}^{ - 2} ) \gt 0$
. This implies that the above condition always holds in our case since
${\eta}^{\prime}(a_{ijk} \vert b_i) = ( - (\hat \beta _6)a_{ijk}^{ - 2}- (\hat \beta _7)a_{ijk}^{ - 2}, \; - (\hat \beta _8)a_{ijk}^{ - 2} ) \gt 0$
. This implies that the above condition always holds in our case since
 $a_{ijk}^{ - 2} $
, γ and (1 − π
l
(a
ijk
|b
i
)) are always positive. Therefore, the probability to estimate a negative FOI was zero.
$a_{ijk}^{ - 2} $
, γ and (1 − π
l
(a
ijk
|b
i
)) are always positive. Therefore, the probability to estimate a negative FOI was zero.
For example, based on model results in Table 3, the conditional age-time dependent FOI for a subject from Walukuba, born in the baseline year (2001, that is, shifted year of birth = 0) and was symptomatic at the previous visit can be estimated as follows,
 $$\eqalign{{\hat \lambda}_0(a_{ijk} \vert b_i) & = \hat \gamma \;{\rm Exp}(\hat \beta _0 + \hat \beta _6a_{ijk}^{ - 1} + \hat \beta _4 + {\rm b}_{1ij} + {\rm b}_{21j}) \cr & - (\hat \beta _6)a_{ijk}^{ - 2} {^\ast}\hat \pi _0({\rm a}_{ijk} \vert b_i)}$$
where
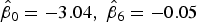 $\hat \beta _0 = - 3.04,\;\hat \beta _6 = - 0.05$
,
$\hat \beta _0 = - 3.04,\;\hat \beta _6 = - 0.05$
,
 $\hat \beta _4 = - 0.24$
, and
$\hat \beta _4 = - 0.24$
, and
 $\hat \pi _0(a_{ijk}\vert b_i)$
is the corresponding age-time conditional prevalence given as,
$\hat \pi _0(a_{ijk}\vert b_i)$
is the corresponding age-time conditional prevalence given as,
 $$\hat \pi _0(a_{ijk} \vert b_i) = \displaystyle{{{\rm Exp}({\hat \beta} _0 + {\hat \beta} _6a_{ijk}^{ - 1} + {\hat \beta} _4 + b_{1ij} + b_{21j})} \over {1 + {\rm Exp}({\hat \beta} _0 + {\hat \beta} _6a_{ijk}^{ - 1} + {\hat \beta} _4 + b_{1ij} + b_{21j})}}$$
and
 $\hat \gamma $
is an estimate for the clearance rate. The conditional FOI for other sites given the infection status at the previous visit and past use of AL can be estimated in a similar way.
$\hat \gamma $
is an estimate for the clearance rate. The conditional FOI for other sites given the infection status at the previous visit and past use of AL can be estimated in a similar way.
MARGINALISATION
A sample of M = 1000 of the random affects vector b
i
= (b
1i
, b
2sj
)
T
, s = 1, 2, 3 (sites), was generated from a multi-variate normal distribution,
 ${\rm N}(0,\; \hat {\rm L\;} \hat {\rm L}^T)$
, where for example, for Walukuba,
${\rm N}(0,\; \hat {\rm L\;} \hat {\rm L}^T)$
, where for example, for Walukuba,
 $\hat{\rm L} = (0.49,\;1.67)^{\bi T}$
whose elements are the square roots of
$\hat{\rm L} = (0.49,\;1.67)^{\bi T}$
whose elements are the square roots of
 $\hat d_{11}$
and
$\hat d_{11}$
and
 $\hat d_{22}$
, respectively as given in Table 3. A fine grid of age, a = 0.5 to 11 with interval 0·1 years (the age range in the data, though extrapolation is possible) was considered. For example, the marginalized FOI at each age value in the grid, again considering a subject from Walukuba, born in the baseline year and was symptomatic at the previous visit is calculated as in (9).
$\hat d_{22}$
, respectively as given in Table 3. A fine grid of age, a = 0.5 to 11 with interval 0·1 years (the age range in the data, though extrapolation is possible) was considered. For example, the marginalized FOI at each age value in the grid, again considering a subject from Walukuba, born in the baseline year and was symptomatic at the previous visit is calculated as in (9).
 $$\eqalign{{\hat \lambda} _0(a) & = \displaystyle{1 \over {1000}}\mathop \sum \limits_{i = 1}^{1000} (\hat \gamma \; \;{\rm Exp}(\hat \beta _0 + \hat \beta _6a^{ - 1} + \hat \beta _4 + b_{1i} \cr & + b_{21i})) - (\hat \beta _6)a^{ - 2}{^\ast}\hat \pi _0(a)}$$
where
 $\hat \pi _0(a)$
is the corresponding marginalized prevalence given by
$\hat \pi _0(a)$
is the corresponding marginalized prevalence given by
 $$\eqalign{& {\hat \pi}_0(a) = \displaystyle{1 \over {1000}} \cr & \quad \mathop \sum \limits_{i = 1}^{1000} \left( {\displaystyle{{{\rm Exp}({\hat \beta} _0 + {\hat \beta} _6a^{ - 1} + {\hat \beta} _4 + b_{1i} + b_{21i})} \over {1 + {\rm Exp}({\hat \beta} _0 + {\hat \beta} _6a^{ - 1} + {\hat \beta} _4 + b_{1i} + b_{21i})}}} \right)}$$
Extensions to estimate the marginal averages at different birth years, for different study sites and for different infection statuses at the previous visit, are straightforward. The SAS macro performing the numerical averaging for a case of
 $\hat \gamma = 1 \cdot 643{\rm \;} $
is attached in the Appendix.
$\hat \gamma = 1 \cdot 643{\rm \;} $
is attached in the Appendix.
A GENERAL S(I)J(R)S SYSTEM
Let s, i and r represent the proportion susceptible, infected and recovered, respectively. Also, let μ represent the natural birth rate assumed to be equal to the natural death rate, β the transmission rate, γ the clearance rate and σ the recovery rate.
System:
 $$\matrix{ {\displaystyle{{{\rm d}s} \over {{\rm d}t}} = \mu - \beta si + \sigma r - \mu s} \cr {\displaystyle{{{\rm d}i_1} \over {{\rm d}t}} = \beta si - \gamma i_1 - \mu i_{1,}\; \; \; \;} \cr {\displaystyle{{{\rm d}i_2} \over {{\rm d}t}} = \gamma i_1 - \gamma i_2 - \mu i_2,\; \; \; \; \;} \cr. \cr. \cr. \cr {\displaystyle{{{\rm d}i_J} \over {{\rm d}t}} = \gamma i_{J - 1} - \gamma i_J - \mu i_J,\; \; \;} \cr {\displaystyle{{{\rm d}r} \over {{\rm d}t}} = \gamma i_J - \sigma r - \mu r\; \; \; \; \; \; \; \; \; \;} \cr} $$
where
 $i = \sum\nolimits_{j = 1}^J {i_j} $
Rewriting the system collapsing the infectious classes into i:
 $$\matrix{ {\displaystyle{{{\rm d}s} \over {{\rm d}t}} = \mu - \beta si + \sigma r - \mu s,} \cr {\matrix{ {\displaystyle{{{\rm d}i} \over {{\rm d}t}} = \beta si - \gamma i_J - \mu i,\; \; \; \; \; \; \; \;} \cr {\displaystyle{{{\rm d}r} \over {{\rm d}t}} = \gamma i_J - \sigma r - \mu r,\; \; \; \; \; \; \; \; \;} \cr}} \cr} $$
Simplifying the model to an S(I) J S system:
 $$\matrix{ {\displaystyle{{{\rm d}s} \over {{\rm d}t}} = \mu - \beta si + \gamma i_J - \mu s,} \cr {\matrix{ {\displaystyle{{{\rm d}i} \over {{\rm d}t}} = \beta si - \gamma i_J - \mu i,\; \; \; \; \; \; \; \;} \cr {\; \; \; \; \;} \cr}} \cr} $$
yields (replacing di/dt by i′, λ = βi and s = 1 − i)
 $${i}^{\prime} = \lambda (1 - i) - \gamma i_J - \mu i$$
and thus
 $$\lambda = \displaystyle{{{i}^{\prime} + \gamma i_J + \mu i} \over {1 - i}} \approx \displaystyle{{{i}^{\prime} + \gamma i_J} \over {1 - i}},$$
expressing time dependency,
 $$\lambda (t) = \displaystyle{{{i}^{\prime}(t) + \gamma i_J(t) + \mu i(t)} \over {1 - i(t)}} \approx \displaystyle{{{i}^{\prime}(t) + \gamma i_J(t)} \over {1 - i(t)}},$$
since μi(t) ≪ γi J (t). Let's look at the factor γi J (t). In case J = 1, γi J (t) = γi(t). In case J >1, γi J (t) <γi(t). This gives us a lower and upper boundary for our FOI.
 $$\left[ {\lambda _L(t),\; \lambda _U(t)} \right] = \left[ {\displaystyle{{{i}^{\prime}(t)} \over {1 - i(t)}},\; \displaystyle{{{i}^{\prime}(t) + \gamma i(t)} \over {1 - i(t)}}} \right]$$
These formulas readily extend to the age-heterogeneous case since we do not explicitly model the underlying transmission mechanism.
Plots for log-likelihood versus the clearance rate (left panel) and FOI versus the clearance rate (right panel) obtained after fitting 1000 models to the data according to π = λ/(λ + γ)(1 − e −(λ+γ)a ) as given by Pull and Grab (1974) by choosing values for the annual clearance rate on a grid of 0·1 to 2·0 with a step size of 0·0019.

Top row: Individual-specific evolutions for the conditional prevalence, by study site for children assumed to be symptomatic at the previous visit and were born in the baseline year (2001). Bottom row: Average evolutions for marginalized prevalence, by study site and the infection status at the previous visit and past use of AL (negative and no AL in the past (solid lines), negative and AL in the past (dotted lines), symptomatic (dash-dotted lines) and asymptomatic (long-dashed lines)). Left panel: Nagongera, middle panel: Kihihi, right panel: Walukuba.

Overview of the fractional polynomial model selection

Overview of model building (number of observations in each case equal to 8645)

Maximum values for the marginal annual FOI by study site, previous infection status and use of AL, and by age group

Marginal FOI and the 95% confidence bounds for the age- and time-dependent marginal annual FOI by study site, previous infection status and use of AL, and by age group for children born in the baseline year (2001)

***** SAS MACRO *****
*GLIMMIX code
proc glimmix data=Cohortfulldata2 method=laplace NOCLPRINT;
class hhid id siteid(ref=“1”) pinfectstatusandAL(ref=“0”);
model parasitemia = fpcohortage*siteid yearshift*siteid siteid pinfectstatusandAL/ dist=bin oddsratio link=logit solution;
random intercept/ subject = hhid group=siteid solution;
random intercept / subject = id(hhid) solution;
COVTEST/ WALD;
run;
**Numerical averaging
**Considering children born between 2001 to 2014 as they appear in the data;
al. (1976) are
data numaveragingprevfoinc;
do site =1 to 3 by 1; *study sites 1(walukuba),2(kihihi),3(nagongera);
do pinfect =1 to 4 by 1; *infection status 1(negative+no AL), 2(negative+AL), 3(symptomatic), 4(asymptomatic);
do subject=1 to 1000 by 1; *generate 1000 samples;
bi1=rannor(123); bi2=rannor(123); bi3=rannor(123); bi4=rannor(123); *used seed=123 to generate from standard normal;
d11=0.24;d22=2.80;d33=1.16;d44=0.21;*variances from the final fit, elements in D;
rd11=d11**0.5;rd22=d22**0.5;rd33=d33**0.5;rd44=d44**0.5; *sqrt(S2) to be used in Cholesky decomposition;
r1=rd11*bi1; r2=rd22*bi2; r3=rd33*bi3; r4=rd44*bi4; *using U+sqrt(S2)*rannor(seed): Note elements in here are sqrt of elements in D;
do a=0.5 to 11 by 0.1; *generate 1000 samples at each age point in the grid;
do L=0 to 13 by 1; *Repeat the above process for each value of birth year shift (L=year of birth - 2001);
*Parameter estimates;
B0=-3.04;B1=0.86;B2=2.19;B3=−0.01;B4=−0.24;B5=1.23;B6=−0.05;B7=−4.01;B8=−1.75;B9=−0.13;B10=0.11;B11=0.04; ap=1/a; *Power of age, age-1;
*Linear Predictors;
lp11=B0+B6*ap+B9*L+r1+r2; lp12=B0+B6*ap+B9*L+B3+r1+r2;
lp13=B0+B6*ap+B9*L+B4+r1+r2;lp14=B0+B6*ap+B9*L+B5+r1+r2;
lp21=B0+B7*ap+B10*L+B1+r1+r3; lp22=B0+B7*ap+B10*L+B1+B3+r1+r3;
lp23=B0+B7*ap+B10*L+B1+B4+r1+r3;lp24=B0+B7*ap+B10*L+B1+B5+r1+r3;
lp31=B0+B8*ap+B11*L+B2+r1+r4; lp32=B0+B8*ap+B11*L+B2+B3+r1+r4;
lp33=B0+B8*ap+B11*L+B2+B4+r1+r4;lp34=B0+B8*ap+B11*L+B2+B5+r1+r4;
*Derivative of linear predictor;
lpder1=-(B6)*(ap*ap); lpder2=-(B7)*(ap*ap); lpder3=-(B8)*(ap*ap);
*Prevalence;
if site=1 and pinfect=1 then pi=exp(lp11)/(1+exp(lp11));
if site=1 and pinfect=2 then pi=exp(lp12)/(1+exp(lp12));
if site=1 and pinfect=3 then pi=exp(lp13)/(1+exp(lp13));
if site=1 and pinfect=4 then pi=exp(lp14)/(1+exp(lp14));
if site=2 and pinfect=1 then pi=exp(lp21)/(1+exp(lp21));
if site=2 and pinfect=2 then pi=exp(lp22)/(1+exp(lp22));
if site=2 and pinfect=3 then pi=exp(lp23)/(1+exp(lp23));
if site=2 and pinfect=4 then pi=exp(lp24)/(1+exp(lp24));
if site=3 and pinfect=1 then pi=exp(lp31)/(1+exp(lp31));
if site=3 and pinfect=2 then pi=exp(lp32)/(1+exp(lp32));
if site=3 and pinfect=3 then pi=exp(lp33)/(1+exp(lp33));
if site=3 and pinfect=4 then pi=exp(lp34)/(1+exp(lp34));
**FOI;
*Clearance rate of 1.643 for children <1 year as given by Bekessy et al. (1976) is demonstrated, a similar code can easily be adopted for ages 1–4 years and 5–10 years.;
if site=1 and pinfect=1 and a<1 then foi=1.643*exp(lp11)+ lpder1*exp(lp11)/(1+exp(lp11));
if site=1 and pinfect=2 and a<1 then foi=1.643*exp(lp12)+ lpder1*exp(lp12)/(1+exp(lp12));
if site=1 and pinfect=3 and a<1 then foi=1.643*exp(lp13)+ lpder1*exp(lp13)/(1+exp(lp13));
if site=1 and pinfect=4 and a<1 then foi=1.643*exp(lp14)+ lpder1*exp(lp14)/(1+exp(lp14));
if site=2 and pinfect=1 and a<1 then foi=1.643*exp(lp21)+ lpder2*exp(lp21)/(1+exp(lp21));
if site=2 and pinfect=2 and a<1 then foi=1.643*exp(lp22)+ lpder2*exp(lp22)/(1+exp(lp22));
if site=2 and pinfect=3 and a<1 then foi=1.643*exp(lp23)+ lpder2*exp(lp23)/(1+exp(lp23));
if site=2 and pinfect=4 and a<1 then foi=1.643*exp(lp24)+ lpder2*exp(lp24)/(1+exp(lp24));
if site=3 and pinfect=1 and a<1 then foi=1.643*exp(lp31)+ lpder3*exp(lp31)/(1+exp(lp31));
if site=3 and pinfect=2 and a<1 then foi=1.643*exp(lp32)+ lpder3*exp(lp32)/(1+exp(lp32));
if site=3 and pinfect=3 and a<1 then foi=1.643*exp(lp33)+ lpder3*exp(lp33)/(1+exp(lp33));
if site=3 and pinfect=4 and a<1 then foi=1.643*exp(lp34)+ lpder3*exp(lp34)/(1+exp(lp34));
output;
end;
end;
end;
end;
end;
run;
*sort data;
proc sort data= numaveragingprevfoinc; by a site pinfect L;run;
*Get means;
proc means data= numaveragingprevfoinc; var pi foi; by a site pinfect L; output out=outpifoinc; run;
*Keep data for marginalized means;
data marginalizedprevandfoinc; set outpifoinc; where _stat_=‘MEAN’; run;


