

Sir,
Small, stagnant ice caps without appreciable ice flow are said to be particularly sensitive to climatic fluctuations, especially with regard to variations in ablation-season temperature (Reference Hattersley-Smith and SersonHattersley-Smith and Serson, 1973). In a general sense, the areal extent of a stagnant ice cap is strongly related to its annual mass balance. Here we report the results of a recent global positioning system (GPS) survey of Murray Ice Cap (Fig. 1), a small, thin plateau ice cap located on the Hazen Plateau of Ellesmere Island, Canada. Most of the plateau is currently unglacierized, except for several small ice caps similar to the Murray (cf. Reference Bradley and SerrezeBradley and Serreze, 1987). These Hazen Plateau ice caps persist today at approximately the same elevation as adjacent ice-free areas, indicating that the plateau surface is close to the local equilibrium-line altitude (ELA) (Reference Miller, Bradley and AndrewsMiller and others, 1975). Small changes in climate may therefore lead to profound changes in the extent of snow and ice cover on the Hazen Plateau.
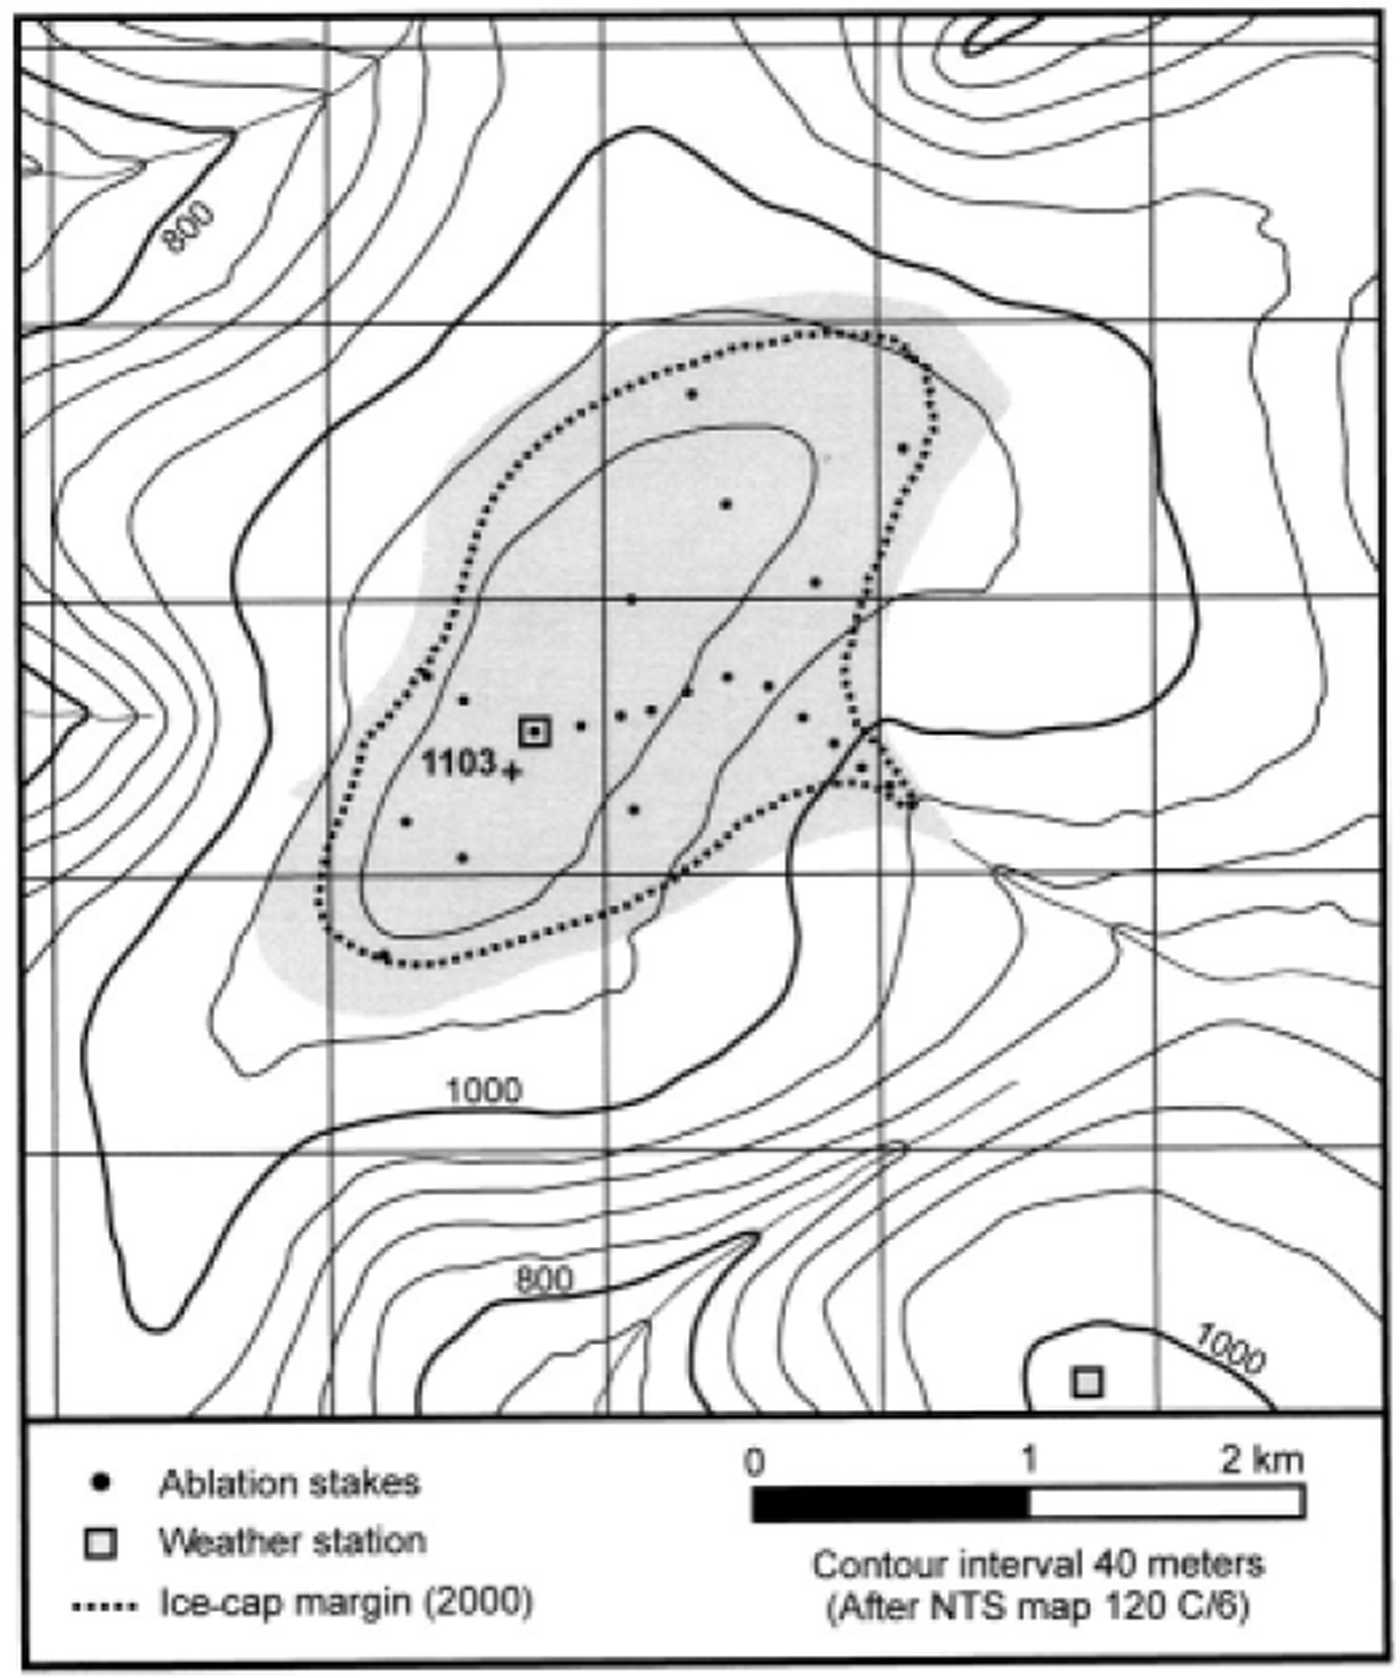
Fig. 1. Murray Ice Cap. The summit of the ice cap is at 81°21′ N, 69°15′ W. Ice extent on map sheet 120C/6 is based on aerial photographs from 9 July 1959.
We conducted a detailed GPS survey of the Murray Ice Cap margin on 6 August 2000. The collected GPS positions (n = 618) were differentially corrected using data from the nearest available GPS base station (Thule air force base, Greenland). We digitized the 1959 ice-cap margin from a 1:50 000 topographic map (Canada National Topographic System map 120 C/6) and calculated ice-cap area using conventional Geographic Information System (GIS) software. Comparison of the 1959 and 2000 ice margins (Fig. 1) shows a retreat of 50–300 m horizontally, 5–20 m vertically and a resulting area reduction of ∼28% (from ∼4.3 km2 to ∼3.1 km2). We estimate recession and shrinkage of similar magnitude for nearby Simmons Ice Cap based on several differentially corrected GPS point locations and observations of the current ice-margin position. Murray Ice Cap has experienced a negative mass balance for at least the past 2 years (1999 and 2000), with net balance (b n) ranging from −0.19 to −0.7 m (1999) and −0.12 to −0.87 m w.e. (2000). The Simmons Ice Cap mass balance was also negative in 2000 (b n = −0.21 to −0.77 m w.e.).
The Hazen Plateau ice caps experienced considerable mass loss between 1959 and 1983 (Reference Bradley and SerrezeBradley and Serreze, 1987). Our new data indicate a continuation of this trend for Murray and Simmons Ice Caps. The available long-term records show that glaciers in the Canadian Arctic have experienced an overall negative mass balance over the last ∼30 years (Reference Koerner and LundgaardKoerner and Lundgaard, 1995; Reference Cogley, Adams, Ecclestone, Jung-Rothenhäusler and OmmanneyCogley and others, 1996; Reference Adams, Cogley, Ecclestone and DemuthAdams and others, 1998), with a turn towards more negative values during the 1990s (see updated mass-balance records at www.magic-sclimate.org). We hypothesize that the sensitivity of the Hazen Plateau ice caps to changes in climate is enhanced by (1) the low amounts of winter snow accumulation, (2) the absence of ice flow and (3) the small vertical relief. The regional ELA appears to have risen, on average, above the summits of the ice caps, supporting the conclusion by Reference Bradley and SerrezeBradley and Serreze (1987) that the Hazen Plateau ice caps are out of equilibrium with modern climate. Further investigations into the relationship between snow and ice extent on the Hazen Plateau and climatic variability are currently underway.
Acknowledgements
Research was supported by a U.S. National Science Foundation grant OPP-9819362 to the University of Massachusetts. The Polar Continental Shelf Project, Natural Resources Canada, provided superb logistical and generous equipment support. We also thank R. M. Koerner for his comments.
15 March 2001

