Introduction
Forty years ago François Matthes set forth his ideas concerning formation of suncups and sun pits and the attendant lack of discernible melt water in snowfields of the high Sierra Nevada California He wrote (Reference MatthesMatthes, 1934, p. 384): ". . . the strongly sunpitted snow-fields above 12000 feet waste away during the summer without contributing a drop of water [my emphasis] to the streams in the valleys below," clearly implying that sublimation/evaporation must, in his judgement, consume the lion's share of high-altitude snow. Comparable observations were subsequently recorded from, among other places, the high European Alps (Reference SeligmanSeligman, 1936), Hawaii (Reference WentworthWentworth, 1940, the Himalayas (Reference OdellOdell, 1941), the Chilean Andes (Reference LliboutryLliboutry, 1954), and the north Pamir Mountains (Reference SekyraSekyra, 1964).
On the other hand, in 1951 Robert Sharp described briefly the results of an investigation into the matter carried out at an elevation of 3718 m (12200 ft) in the Sierra Nevada west of Bishop, California (Fig. 1). Sharp noted that more than 90% of the wastage of a selected snow bank apparently was in the form of melting and stated (Reference SharpSharp, 1951, p. 583.): "These results strongly suggest that evaporation occupies a relatively minor part in the ablation of snow in areas above 12000 feet in the Sierra Nevada." Essentially the same opinion was expressed almost a decade later (Reference SharpSharp, 1960, p. 22-23).
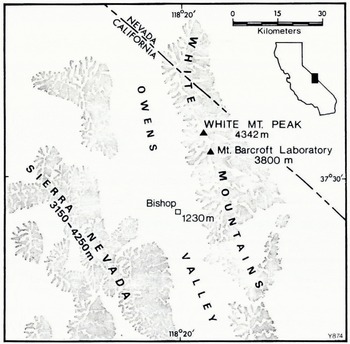
Index map showing location of the study area and places mentioned in the text.

It would be difficult to conceive of a more classic example of diametrically opposed points of view in the Earth sciences. I cite it not for purposes of invidious comparison but simply to illustrate the fact that perceptive observers of landscape can, and often do, differ spectacularly over what would on the face of it seem to be reasonably unambiguous observational evidence.
The present paper represents a modest contribution to resolution of the issue and is based on examination of the problem in the White Mountains of California and Nevada, located immediately east and in the rain shadow of the southern Sierra Nevada (Fig. 1). Observations were made along the crest in the vicinity and north of the Mt Barcroft Laboratory of the White Mountain Research Station (Reference Kellogg, Kellogg, Smith and TimirasKellogg and others, 1973) during May and June 1970 and May 1974.
General Characteristics of the Study Area
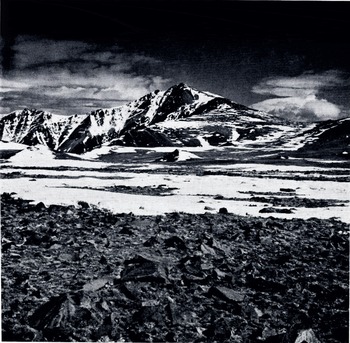
The White Mountains are structurally a large, tilted fault block with a comparatively gentle eastern flank and a much more precipitous western slope (Reference Pakiser, Pakiser, Kane and JacksonPakiser and others, 1964; Bateman, 1965). Their crest reaches 3650-4342 m, and all of the observations reported here were made at elevations of 3600 m and higher. Much of the summit of the range is characterized by a rolling, subdued topography and is mantled with debris subjected to gelifluction and other periglacial processes but unaffected by direct glacial action (Fig. 2). Bedrock in the area of study is the Mt Barcroft granodiorite (Reference KrauskopfKrauskopf, 1971).
View toward the north along the crest of the White Mountains from near the Mt Barcroft Laboratory. White Mountain Peak (elevation 4342 m) is the prominent summit in the center. Photograph taken on 3 May 1974 at an elevation of 3920 m.

Daily weather observations have been made since 1953 at the Mt Barcroft Laboratory (elevation 3800 m) and have been summarized in a series of publications by the White Mountain Research Station, the most recent of which appeared in 1971 (Reference Pace, Pace, Kiepert and Nissen.Pace and others 1971 . Mean monthly and annual values of significant meteorological parameters for the station are given in Table I. The climate along the crest of the White Mountains can realistically be described as high, dry, and cold!
Observations on Sublimation/Evaporation Versus Melting
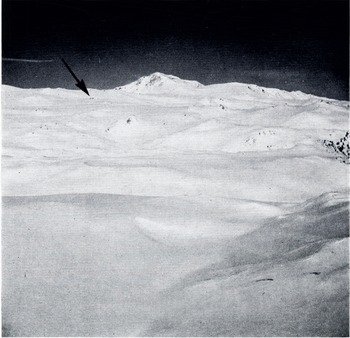
During the period December 1968 to March 1969, the weather station at Mt Barcroft recorded a cumulative snowfall of 424 cm (compared with an 18 year mean of 194 cm for the same four months), with an average depth during March 1969 of 282 cm; an all-time maxi-mum depth of 312 cm was measured on 22 March 1969 (Reference Pace, Pace, Kiepert and Nissen.Pace and others, 1971). As seen from a helicopter on the morning of that day, the top of the White Mountains somewhat resembled a piece of interior Antarctica (Fig. 3), and the snow cover was in all probability the greatest observed during the more than 130 years of regional historical record. Mean snow depths at Mt Barcroft decreased steadily in the following months (April: 231 cm; May: 96 cm; June: 8 cm), and by July, most of the impressive cover had disappeared.
Mean monthly and annual values of selected climatological parameters, mt barcroft laboratory, white mountains, california, elevation 3 800 m*

I was at the Mt Barcroft Laboratory in May and June 1970, primarily to study patterned ground along the crest of the range. However, mindful of the great amount of snow of the preceding year, I confidently anticipated finding widespread surface erosion generated by run-off from the pack of 1969. To my very considerable surprise, visible evidence of such expected erosion on natural slopes above 3500 m was almost unbelievably scarce. Most undisturbed slopes appeared to have experienced no recent surficial cutting, and the only recognizable channeling clearly attributable to melt water from the 1969 snow pack was restricted to roads and to areas around the buildings of the laboratory site. Discussions with laboratory personnel who had been present in March-June 1969 confirmed what the geo-morphologic evidence (more precisely, lack of evidence) suggested: melt-water streams, except along the roads and near the buildings, had been virtually non-existent at elevations of 3500 m and higher during the ablation period of 1969.
This totally unexpected state of affairs directed attention to the snow cover then present, and an attempt was made to discover, in a purely qualitative way, what was happening to the waning pack. Repeated examination of a number of drifts over a four-week period revealed a remarkably limited amount of surface run-off below patches of snow that were supposedly melting. Rather often the lower margins of such drifts consisted of an overhang of snow and ice, on the underside of which an occasional drop of water could be seen (but was rarely noted falling to the ground), with surface soil under the overhang comparatively dry right up to the edge of the drift. Frequent observation of this condition around drifts between the Barcroft laboratory and White Mountain peak seemed strongly to support Matthes' contention that most high-altitude snow sublimates or evaporates shortly after melting.
A more systematic investigation of the question of sublimation versus melting was made in May 1974, and the results of that effort again sustain Matthes' ideas on the matter. In addition to making qualitative observations, to be discussed below, I undertook a relatively simple experiment designed to produce limited quantitative data, the results of which may be of some interest and value. The experimental procedure was as follows:
Part of the crest of the White Mountains as seen on 22 March 1969. White Mountain Peak is the high point on the skyline; the mew is toward the north-west. Location of the Mt Barcroft Laboratory is indicated by the arrow.

-
1. On three occasions (6, 10 and 13 May) I cut three equal-sized blocks of snow (approximately 10 cm X 5 cm X 4 cm) from drifts near the Mt Barcroft Laboratory for testing purposes, selecting "fresh" snow (two days old) on 6 May, one-week snow on 10 May, and "older" snow from a persistent late-winter drift on 13 May.
-
2. On each date, one of the blocks was taken inside the laboratory, put next to a heater until it melted, and the contained water measured both volumetrically and by weight.
-
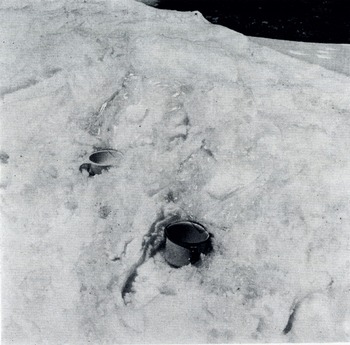
3. The other two blocks were placed in south-facing, plastic-lined depressions hollowed out by hand in a nearby drift and so arranged that whatever melt water may have been produced would drain into containers below the depressions (Fig. 4).
Test blocks of snow in plastic-lined depressions in a drift near the Mt Barcroft Laboratory. Picture taken at 15.00 h Pacific Standard Time on 7 May 1974.

-
4. The blocks in the snowdrift depressions were allowed to waste away completely, all of the melt water presumably collecting in the containers; total wastage required from 46 to 75 h. There was no precipitation during any of the periods of wasting.
-
5. A comparison was then made of the weights and volumes of water accumulated in each case and percentages calculated accordingly; the results are indicated in Table II.
Disposition of Water In Test Blocks of Snow*
A couple of parenthetical footnotes should be added. First, I did not weigh the blocks of snow to assure absolutely that an equal quantity of water was initially present in each. However, they were cut early in the morning on the day of each experiment when air temperature was below freezing, and a conscientious effort was made to achieve equality of dimensions. Density differences in the blocks selected for the experiments seemed to be inconsequential. Thus, although differences in initial water content undoubtedly existed, I cannot believe they were of major proportions.
Secondly, on the second day of the experiment begun on 13 May, a gust of wind disturbed the plastic lining of one of the snowdrift depressions, and the partially wasted block of snow slid into the container below; additionally, an indeterminable volume of snow from the drift itself was deflected into the container. The block was replaced in the depression and thereafter continued to waste away, but the total amount of liquid water later measured must have been greater than would otherwise have been the case, thus inflating by an unknown percentage the amount of "melting" ofthat particular block.
What can be said about the results of these admittedly unsophisticated experiments? It is readily conceded that no claim to absolute accuracy can possibly be made on behalf of the percentages in Table II, and no such claim is here advanced. Quite apparently, chances for error or distortion were many. For example, it is highly probable that some of the water produced by melting of the blocks taken into the laboratory was evaporated before measurements of weight and volume were made, although such losses are not believed to have been great. Similarly, there must have been a certain amount of evaporation from the accumulating water in the outside containers before complete wastage of the test blocks of snow occurred. Thus, unequivocal validity can hardly be attached to the numbers presented here.
Nevertheless, I am of the firm belief that the figures are not completely without meaning, that they are at least of the correct order of magnitude. The meaning is apparent: a significant proportion of the snow subjected to experimentation sublimated and/or evaporated, and, considering the qualitative evidence of effective sublimation to be presented below, I think extrapolation to snowdrifts on natural slopes is warranted.
In this connection it is of interest to speculate briefly about the sources of soil water necessary for geliduction at higher elevations. Reference BenedictBenedict (1970), in an excellent discussion of down-slope soil movements in the Colorado Rockies, made the following observation (p. 220): "Saturation during the spring thaw is not, in the Front Range, sufficient to cause solifluction. In order for solifluction to occur, the soil must have previously been 'conditioned' by ice-lens formation, which requires saturation at the beginning of freeze." It would at least seem possible that part of the reason why moistening of the soil during the "spring thaw" is not sufficient to cause gelifluction in the Colorado Front Range is simply that much of the high-altitude snow sublimates and/or evaporates rapidly after melting; the major source of moisture may well be summertime precipitation in the form of rain. I am aware that this suggestion is at odds with results of previously reported studies in the Front Range (Reference MartinelliMartinelli, 1960; 1965), but I offer it all the same.
Non-quantitative, observational evidence of effective sublimation along the White Mountain crest in May 1974 was impressive. As was the case in 1970, surface soil around the margins of many wasting drifts tended to be dry literally to the very edge of the snow. This situation was not ubiquitous, but it was observed so frequently as to constitute a valid generalization. Additionally, the retreating margins of many drifts displayed a number of other characteristics strongly suggestive of active sublimation/evaporation:
-
1 As was noted in 1970, many drift margins had an overhanging projection above dry surface soil. Overhanging masses of snow and ice were also observed around boulders uncovered as the snow receded, with rock surfaces beneath the overhangs usually dry.
-
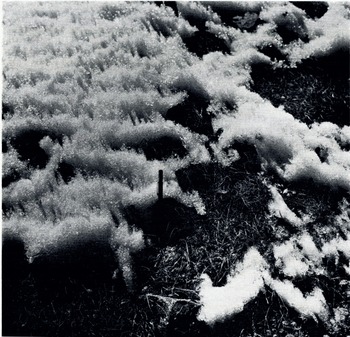
2 Miniature snow penitentes along drift margins (Fig. 5) ultimately became separated by linear depressions reaching to the surface, and that surface, whether soil or rock, was dry in most cases. This situation duplicates that described by Matthes in the Sierra Nevada (Reference MatthesMatthes, 1934, p. 384).
-
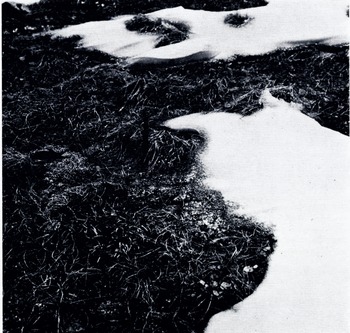
3 A particularly striking feature along many drift margins was the presence of thin, almost transparent sheets of ice, either attached to the edge of the drift or separated from the snow and resting in isolated positions on tufts of grass (Fig. 6). In virtually all cases, the surface soil beneath such ice plates was dry, and only very rarely were drops of water seen on the undersides of the layers. Prolonged observation of one such sheet of ice on the afternoon of 12 May 1974 showed it to disappear without a single drop of water having been seen falling to the surface below.
-
4 In the few instances in which more than trifling amounts of melt water were present along lower margins of wasting drifts, saturation of the surface soil extended little more than two or three meters beyond the edge of the drift, and in no case was an extensive, integrated melt-water stream system seen. The implication here is that either
Miniature snow penitentes along the margin of a waning drift near the Mt Barcroft Laboratory photographed at local noon on 13 May 1974. Pencil gives scale.

Edge of wasting snow drift near the Mt Barcroft Laboratory at 13.00 h Pacific Standard Time, 20 May 1974. Note the thin sheet of ice near the pencil; the surface soil under the ice was dry. An overhang of snow and ice is visible above (behind) the pencil.

(1) much of the surface melt water was evaporating within a few decimeters of the parent drift, or (2) most of it was moving downward through the upper regolith to join the ground-water supply. Certainly some of the melt water must have percolated downward, but how much this may have been is unknown. In any event, not enough run-off was produced during the period of observation to sustain surface flow capable of effective erosion.
The qualitative evidence thus supports the conclusion drawn from results of the experiment described above: at elevations greater than about 3500 m in the While Mountains, a large proportion of the springtime snow-pack (50-80% ±) either sublimates directly or evaporates shortly after melting has occurred. Whatever the absolute numerical relationship between sublimation/evaporation losses and melting may be, geomorphic processes along the crest have to make do with a minimal amount of surface water under contemporary climatic conditions. It seems probable that only during and immediately after really heavy summertime thunderstorms (precipitation intensities exceeding 6 cm/h) are sizeable areas of the summit thoroughly saturated. Since such rains are infrequent in any given segment of the crest, it follows that overall gradational alteration of the high White Mountains must be proceeding at a comparatively slow rate.
Discussion
Considering the observational evidence of effective sublimation described above, including the general absence of significant volumes of melt water and a concomitant lack of widespread surface erosion on most high-altitude slopes, a reasonable and necessary question must be: Is it meteorologically feasible for such postulated sublimation to take place? In other words, is the observational evidence reliable, or has a gross misreading of the situation taken place?
Weather factors affecting possible rates of sublimation include air temperature, wind velocity, atmospheric moisture content, and intensity of solar radiation as a measure of available energy. Studies of snow and ice ablation in all parts of the Earth have shown that of the atmospheric variables most readily and frequently measured, wind velocity, relative humidity, and air temperature tend to show the most direct correlation with rates of melting/ evaporation/sublimation (Reference SeligmanSeligman, 1936; Reference DorseyDorsey, 1940; Reference Quervain deQuervain, 1951; Reference LliboutryLliboutry, 1954; Reference KeelerKeeler, 1964; Reference GeigerGeiger, 1965; Reference NybergNyberg, 1965; Reference Doty and JohnstonDoty and Johnston, 1969; Reference PeakPeak, 1969; Reference Bull and CarneinBull and Carnein, 1970; Reference TablerTabler, 1973; Reference La Casinière deLa Gasinière, 1974). Ideally, maximum sublimation/ evaporation at high elevations should occur under cold, dry, windy conditions characterized by intense direct and indirect solar radiation.
How do weather conditions in the high White Mountains during the ablation period (here taken to be mainly the months of May and June) compare with optimal conditions for effective sublimation? The general climatic characteristics of the Mt Barcroft site (and presumably much of the crest at comparable elevations) are adequately portrayed by the figures of Table I. Numerous empirical formulae have been developed for computation of evaporation/sublimation, most of which call for values of meteorological parameters not measured directly at the Mt Barcroft Laboratory (for a good general discussion sec Reference GeigerGeiger, 1965, p. 249-57). However, in the present context it is sufficient to note that the primary requirements for sublimation from a snow or ice surface are that (1) the air temperature be less than 0° C, and (2) the vapor pressure of the air above the surface be less than the saturation vapor pressure over ice (i.e. the relative humidity must be less than 100%). Given these circumstances, sublimation must and will occur (Reference GeigerGeiger, 1965, p. 219), its rate being deter-mined by a number of factors, of which wind velocity is probably the most important (Reference SharpSeligman, 1936, p. 105; Reference NybergNyberg, 1965, p. 586; Reference PeakPeak, 1969; Reference Bull and CarneinBull and Carnein, 1970, p. 436).
Unfortunately, the only measurement of atmospheric moisture content taken regularly at the Barcroft weather station is relative humidity at 08.00 h Pacific Standard Time. However, personal observations in 1970 and 1974 (including spot checks of relative humidity and free-air temperature) and perusal of the available records, indicate clearly that the necessary theoretical atmospheric conditions for sublimation are present for perhaps 50-60% of the lime during the ablation period, with conditions favorable for effective evaporation prevailing during much of the remainder. Air temperatures are below freezing in May and June for 8-14 hours each "average" day, westerly winds peaking at more than 30 knots (55 km h−) are frequent, and saturation of the atmosphere along the crest rarely occurs. As daily maximum temperatures approach and exceed 0° C, some melting undoubtedly takes place, especially along roads and around the buildings of the Barcroft laboratory, but much of the liquid water thus produced appears rapidly to disappear by evaporation.
Recent studies of atmospheric water vapor over the White Mountains, made by the University of California's Radio Astronomy Laboratory in connection with the possible siting of an infrared telescope on the crest, have confirmed the existence of an extremely low moisture content in all months of the year. Precipitable water vapor (PWV) values of less than 1 mm were measured for 50% of all clear nights, and values of less than 0.5 mm were recorded for 10% of the time (Reference Cudaback, Kellogg, Kellogg, Smith and TimirasCudabaek, 1973, p. 45). PWV is an indirect measure of the water vapor actually present, derived by determining the spectral line absorption of sunlight by ambient atmospheric H2O. PWV values of 0.5-1.0 mm indicate that if all available water vapor were condensed and precipitated, the total depth would be approximately 0.5-1.0 mm. The data thus suggest that average atmospheric water-vapor content above the White Mountains is lower than that at any other site in the world yet surveyed.
So far as potential energy for sublimation/evaporation is concerned, the well-known effect of increased elevation on intensity of solar radiation (Reference GeigerGeiger, 1965, p. 443-48) is dramatically exhibited in the White Mountains. Because of the low water-vapor content and remarkable transparency of the air above the crest, the amount of direct radiation reaching the surface is as great as, if not greater than, any other amounts recorded in the world, reaching a value in mid-July of about 970-980 cal/cm2 d (Reference Terjung, Terjung, Kickert, Potter and Swarts Terjung and others, 1969[a], [b]). Other things being equal, values in June, centering on the summer solstice, should be even higher.
Calculations by Reference Terjung, Terjung, Kickert, Potter and SwartsTerjung and others (1969[a]), based upon measurements made on only a single day (17 July 1968) in an alpine tundra site at an elevation of 3580 m, indicated that the proportion of solar energy used for evaporation was sufficient to dispose of 5 mm of water per day, or about 15 cm/month. Assuming that a roughly comparable rate prevails throughout May and June, it is readily apparent that sublimation/evaporation could easily consume all of the precipitation for those months (mean May and June total at Mt Barcroft = 7.5 cm) plus an additional amount of water substance in the form of a substantial part of the springtime snow cover. In the absence of additional data the assumption is obviously speculative, but in the presence of widespread observational evidence of effective sublimation it may well be reasonable and is here so regarded.
There would thus seem to be little doubt that atmospheric conditions along the crest of the White Mountains are unusually-perhaps uniquely-favorable for the occurrence of sublimation/evaporation during a large part of the ablation period. Sub-freezing temperatures are frequently experienced, the air is exceptionally dry, solar radiation is very great, and strong westerly winds blow much of the time. The result appears to be just what the observational data suggest: much of the high-altitude snow-pack sublimates or evaporates, leaving only limited amounts of surficial melt water to participate in equally limited gradational activity.
Summary
Qualitative and quantitative evidence from the White Mountains strongly imply that a significant portion of the snow along the crest either sublimates directly or evaporates shortly after melting. Theoretical considerations, personal observations, and examination of available meteorological data lead to the conclusion that atmospheric conditions over the range during May and June-the main ablation period-are especially favorable for disposal of a sizeable proportion of the snow-pack by sublimation/evaporation. Lack of widespread evidence of surficial erosion by "snow-melt" run-off on higher slopes is thus satisfactorily accounted for- there is so little effective "snow-melt" erosion because little melting of snow occurs.
Acknowledgements
Discussions at the University of Lethbridge with R. J. Fletcher (Geography), L. G. Hepler (Chemistry), and J. L. Rood (Physics) clarified considerably the author's thinking about sublimation at higher elevations. The research here discussed was supported by grants from the University of Lethbridge Research Committee. Helicopter service in the White Mountains was provided by the White Mountain Research Station, University of California, Bishop, California, and gratitude is expressed to members of the Mt Barcroft Laboratory staff for logistical and other assistance.