
A Question from the White House
A few miles north of the Woods Hole Oceanographic Institute on Cape Cod, Massachusetts, perched on a bluff of land overlooking Quissett Harbour, the Jonsson Center is an imposing Victorian house, with a wrap-around verandah, where guests can eat their meals looking out over the harbour. The centre serves as the summer retreat for the US National Academy of Sciences,1 hosting weekly workshops on many different areas of science (see Figure 1.1). It was here, for one brief week in the summer of 1979, that a small group of scientists gathered to answer an urgent question from the White House, and in doing so, changed the way we understand and evaluate computer models of climate change.
The entrance to the Jonsson Center at Woods Hole.

The question they were called upon to answer wasn’t whether the planet would warm in response to rising carbon dioxide emissions – by the late 1970s, that was no longer in dispute in the scientific community. The question was: how certain can we be about the numbers? President Jimmy Carter wanted to understand the policy implications, and for that he needed to know how confident the scientists were that the computer models were correct.
The question was posed to the National Academies by Frank Press, science advisor to the president. He was reacting to a report that landed on President Carter’s desk from an elite group of physicists, known as the JASONs,2 who regularly advised the president on matters of national defence, particularly concerning the risks from nuclear weapons. To explore the implications of rising levels of carbon dioxide, the JASON group had developed their own computer model of the Earth’s climate. Their model showed that by the second half of the twenty-first century, the planet would warm by several degrees. The implications were stark: this would reduce the world’s food supply, cause the oceans to rise, and lead to new “dust bowl” conditions across large parts of America, Asia, and Africa, with serious political consequences as people migrate away from affected regions. The JASON report concluded, with dramatic understatement, “the impact of the projected changes on man is unknown, but unlikely to be wholly favourable.”3
Very little about the JASON report was new – throughout the 1960s and 1970s a steady stream of papers from climate research labs had reported similar results.4 Many scientists used computer models to study weather and climate, ever since 1948, when John von Neumann, widely regarded as the father of the modern computer, hired a promising young meteorologist named Jule Charney to develop a weather forecasting program to show off the capabilities of the first programmable electronic computer. Their work laid the foundations of computational weather forecasting and climate modelling – we’ll explore their story in detail in Chapter 3.
So the JASON computer model wasn’t particularly innovative. In fact, it was fairly simple compared to other models around at the time. But the JASON group was highly regarded in government circles, and their report caught the attention of the president. It prompted deep concern at the White House, and hence a serious question about scientific confidence in the results.
That summer, the National Academy convened a small working group of experts,5 under the leadership of Jule Charney, by now widely considered to be the father of computational weather forecasting (see Figure 1.2). So it was here, in this quiet corner of Cape Cod, where the seeds of a new way of thinking about computer models were sown, one that would weave together the ad hoc efforts of individual research groups into a new, systematic scientific enterprise.
Jule Gregory Charney.

How Sure Are We?
When politicians ask big questions that matter to society, there is usually a gap between what the politician is asking and what science can answer. For climate change, politicians want answers about the future, while scientists are more comfortable analyzing data from the past and present. Climate models represent the bridge between the two: they are developed to simulate behaviours of the climate system that have been observed in the past, but can also be run forward in time, to explore future scenarios.
Can we be sure the computer models are any good? It’s a common question, especially when confronted with descriptions of how difficult life might become on a hotter planet. And anyway, why would we trust a computer? After all, our everyday experience of computers can be very frustrating. Computer software often crashes, or corrupts our data. Some days we can’t even get the machine to work in the first place.
It’s also a vitally important question because our responses are likely to lead us down very different paths. If we cannot be confident about what the models say, we’re likely to support a wait-and-see attitude.6 Cheap fossil fuels have delivered many of the comforts of modern life, and replacing them with alternatives may be expensive. Perhaps the most natural reaction is to avoid thinking about it at all, and hope that the scientists are wrong. We now know that lobbyists for the fossil fuel industry have been exploiting this doubt for years, paying people to exaggerate the uncertainty, to undermine efforts to phase out fossil fuels.7
But if the models are accurate, we have to accept their forecasts. And that means acknowledging climate change is a very serious and urgent problem, and will require us to re-think almost every aspect of how we live.
Stories about science in the media rarely answer this question. New discoveries and new results are usually presented as disconnected facts, with very little insight into where the results come from and how they were generated. If it sounds like good news (“new treatments for cancer!”), or if they don’t seem to affect us directly (“new advances in quantum theory!”), we tend to accept them as true. Conversely, if the results sound like bad news (“sugar is really bad for you”! “glaciers are melting much faster than we thought”!), we’re more likely to filter out parts that challenge our view of the world.8
Could the Models Be Wrong?
My own work in climate research was motivated by a similar question. For most of my career, I had been vaguely aware of the issue of climate change, but, like many people, I pushed it to the back of my mind, and got on with life. But in 2006, while reading yet another newspaper article about alarming projections from the computer models, I started to realize how important this question was. How would I know if the models are any good?
As a computer science professor, I felt I might have some relevant expertise. I’d been teaching software engineering all my career, and I had plenty of practical experience of how difficult it is to get software correct. In the 1990s, I was lead scientist at NASA’s software verification research lab, where we investigated how NASA and its contractors develop flight software used on the Space Shuttle and the International Space Station. While I was at NASA, several robotic missions to Mars had failed because of software bugs. At conferences, I had given talks on the reasons for these failures. It was clear to me that no matter how clever our technology, human mistakes always occur. Success does not depend on eliminating mistakes – with complex systems that’s all but impossible. Success depends on putting in place a whole series of engineering practices that ensure we can find and correct such mistakes before they lead to catastrophic failure.
Some organizations have become exceptionally good at this, especially in places where human lives are at stake. The Space Shuttle, for example, never had a serious software failure9 in 30 years of operation. Software errors are extremely rare in flight control software for aircraft and for the tracking systems in flight control towers. They’re also extremely rare in cars, despite the fact the software in today’s cars is far more complex than the shuttle flight software. But even in these systems, nobody has found a way to eliminate mistakes completely, and the cost of the engineering processes that catches and corrects these mistakes is phenomenal. The aircraft manufacturer Boeing estimates that more than half the cost of developing a new aircraft is spent on developing the software, and half of that is just the cost of testing it.
Outside of these safety critical software systems, software errors are far more common. The newspapers are full of reports of software errors bringing down stock markets, airline booking systems, government services, power grids, online games, the core arithmetic of Intel’s processor chips, and, occasionally, NASA’s unmanned space missions. The more we rely on software, the more it seems that the software lets us down. So it seemed natural to me to ask whether the scientific models used by climate scientists suffer from the same kinds of problem.
Getting the Big Picture
One of the great things about being a university professor is that cutting-edge research is a part of our job description. We’re expected to come up with new research questions, and to conduct studies to answer them. But coming up with good research questions turns out to be much harder than most people realize. Too often, what appears to be an interesting question has already been answered by other researchers, and if it hasn’t, it’s usually because there is no obvious way to answer it (yet). Good research questions lie in that narrow gap between already known and impossible to answer. I needed to find out whether I was asking a good research question.
Luckily, another pleasure of life at a big research university is that it’s not hard to find experts on almost anything. I contacted Prof Dick Peltier, perhaps the most renowned atmospheric physicist in Canada, who happens to work in the next building to mine. Dick is famous for his work on the advance and retreat of glaciers since the ice ages, and in particular, our ability to measure the rates that they are currently melting and contributing to sea level rise. Although his team doesn’t develop their own global climate models, they regularly use the outputs of climate models in their work, and sometimes run their own experiments on the models.
We met for beer in the faculty pub, and Dick was eager for me to get involved. He told me that global climate models are usually developed in large government research labs, rather than universities, because most universities don’t have the resources: you need a big team of scientists and technicians, and, preferably, your own supercomputer. Most developed countries have at least one major climate research lab, and each has developed its own computer model. The Canadian team, at the Canadian Centre for Climate Modelling and Analysis (CCCma), is based at a federal government research lab in Victoria, out on the west coast. Dick told me that the Canadian team is much smaller than those in other countries, but their model is often regarded as one of the better models, scientifically speaking. But from an engineering point of view, there is plenty of room for improvement. The team do the best they can, but they don’t have the resources for a careful engineering process. So the program code is messy, and people outside of CCCma have a hard time working with it. Dick gave me one of his infectious smiles: they could use my help – I could help them re-engineer the Canadian model!
That sounded like a worthwhile challenge. But to do that, I’d need to understand more about what it takes to engineer a good climate model. I needed to know whether anyone was getting it right, and if so, what they were doing? I needed to start at the top. Which team, I asked, were doing this the best? Dick suggested I should start with the UK Meteorological Office (or, as those who work there call it, the Met Office). If anyone was getting it right, they were. The Met Office provides some of the most accurate weather forecasts in the world, although you might not think so, given the criticism they get in the British tabloid newspapers on the very few occasions they get it wrong. Interestingly, their climate simulation models are built from the same program code as their weather forecast models. As this code runs every day to compute the weather forecasts, this seemed like an excellent place to look for good engineering practices.
I contacted Tim Johns, who was then the manager for the UK Met Office coupled climate model, and asked if I could come and visit. After I explained what I wanted to do, he readily agreed to host me for a visit. I ended up spending the entire summer at the Met Office, and Tim I and wrote a paper10 together about how climate models are developed there. And then, when scientists at other labs heard about the work, I started getting invitations to visit more labs. My journey into the heart of climate modelling had begun.
When I started out, I thought it would be easy for me to suggest improvements to the software engineering practices for these models. But I was in for a surprise – many surprises, in fact. The first surprise was how eager climate modellers were for me to get involved. In lab after lab, I was welcomed with open arms, with scientists eager to find out how to improve their software. When I presented the results of my initial study of the UK Met Office at the European Geophysical Union conference in Vienna, I had a line of scientists from other labs imploring me to visit them next. But the deeper I got into the field, the more I realized there was very little I could teach them, and I gained a new appreciation of the breadth and depth of expertise needed to build a simulation of the Earth’s climate. What I discovered was humbling and awe-inspiring.
Perhaps the biggest surprise of all was that the labs I visited had already developed the engineering processes they needed to prevent errors in the software from affecting their science. Without realizing it, they had built an impressive engineering enterprise that easily rivals the ones I had seen at NASA. Their achievement is largely invisible – it exists in the program code inside their supercomputers. But over the course of half a century, these scientists have figured out how to build and test some of the most ambitious scientific simulations ever attempted. Starting from a set of mathematical equations that express the physical properties of planet Earth – its gravity, rotation, how it is heated by the sun, and how air and water flow when subjected to heat and pressure – they were able to build simulations to capture how the atmosphere and oceans and ice sheets and vegetation and weather systems interact, with all the right patterns of the daily and seasonal cycles of winds and ocean currents.
The visualizations of these simulated climates are stunningly beautiful. At the National Center for Atmospheric Research (NCAR) in Boulder, Colorado, the software team showed me the output from one of their models (see Figure 1.3). As I watched the simulation, summer cyclones formed in the North-West Pacific and pounded the coast of Japan. Dust blown by the winds from the Sahara desert blew across the Atlantic to the Amazon, where it helps seed the daily cycle of rainfall over the rainforests, which, with the simulation speeded up, make the Amazon jungle appear to pulse with cloudbursts. Rainclouds formed in the Mid-Atlantic and flowed steadily North-East, bringing warmth and rain to the British Isles. But none of these patterns are programmed into the models. They emerge when you get the basic physics right, and when you succeed in coupling of the different parts of the physical climate system to mimic how energy and mass move around the planet.
A screenshot from NCAR’s visualization of the CCM3 model output for precipitation.11 The white areas represent rain, with very heavy rain shown in orange. The full visualization spans a whole year, but does not represent any specific year; rather it shows what’s typical over the course of a year.

These scientists always work at the leading edge of their field, worrying about the parts of the model they haven’t yet got right. They’re continually pushing the boundaries of what’s possible – scaling the simulations to run on parallel supercomputers with tens of thousands of processors, dealing with programs that generate terabytes of data per hour, and working new science into the models. Which means, at a technical level, continual frustration. Code rarely works first time when you’re trying to make it do something new, and as soon as one technical challenge is overcome, it’s on to the next. There isn’t much time to perfect the existing code, because the scientific questions always take priority. In such circumstances, it’s easy to be critical of design decisions buried in the code, because most of those decisions were taken before anyone even knew whether the model would work. So the modellers spend their time obsessing over the weaknesses in their code, looking for ways to improve it.
But a lot happens to the program code on the long journey from “I wonder if the model can do this …” to “Here are our latest scientific results.” It turns out climate modellers have built a remarkable set of design and testing practices that look quite unlike anything I’ve observed in commercial software companies. If you have a large enough community of experts who run the models over and over again, treating each run as though it were a scientific experiment, treating every quirk of the model with the utmost suspicion, it’s possible to produce remarkably high quality software.
My aim in writing this book is to explain what that process is, and why it works. Climate models are now so large and complex that no one person understands the entire model. Taken together, the thousands of scientists who help build and test these models produce something that’s much more than the sum of its parts.
The models enable a new approach to doing science, which threads together the contributions of experts around the world, from many different disciplines, and allows them to explore how their ideas interact, in a way that previously would have been impossible. Massive inter-disciplinary teams work together, sharing data, program code, and experimental results. Scientists from around the world regularly get together to design a large set of standardized experiments – I think of them as benchmarks, but the scientists call them model intercomparison projects – so that models can be directly compared with one another. And the results from these runs are made freely available on the Internet for anyone to explore. The result is a quality control process that I believe is unique in the world of computational modelling. We’ll explore it in more depth in Chapter 8.
Climate Modelling Grows Up
Climate modelling didn’t used to be like this. As we will see in Chapter 2, the first computational model of climate change was created in the 1890s, by a Swedish chemist, Svante Arrhenius, long before we had electronic computers. Arrhenius got many of aspects of the climate system right, and his predictions are remarkably similar to the best computer models today. Unfortunately, his work was largely ignored for 50 years, as few other scientists at the time really understood how the greenhouse effect works.
The advent of electronic computers revived interest in his work. In the 1960s and 1970s, several research groups built their own climate models, each running their own experiments and presenting their results in journals and conferences, in much the same way that most scientific fields operate. But there was no way to directly compare the different models, and no easy way for labs to share their expertise, other than through the occasional visiting scientist. Most importantly, there was no way to assess the reliability of their results, even when they appeared to agree with one another.
It was in this context that Charney’s group pondered the questions posed by the White House at their meeting at the Jonsson Center in the summer of 1979. Climate change was becoming an important policy issue, and the questions asked by politicians were changing rapidly. President Carter’s science advisor, Frank Press, asked Charney’s group to address three specific questions: “What is the basis for our scientific understanding of climate change; can the adequacy and uncertainty of this knowledge be quantified; and what are the key issues that policymakers need to be aware of?”12
In the decades since, scientists have collected a wide range of evidence that the climate is changing in ways that are unprecedented in human history. In 1979, observational data wasn’t clear enough to be certain whether such warming was occurring, but we did have many pieces of the puzzle. Experimental evidence dating all the way back to the mid-nineteenth century showed that carbon dioxide slows the rate at which heat can escape from the planet, creating what we now call the greenhouse effect. Scientists had begun precise, regular measurements of carbon dioxide in the atmosphere in 1958 (see Figure 1.4). By 1979, it was obvious that CO2 levels were steadily rising, and the rate was accelerating, as a result of emissions from our growing consumption of coal, oil, and natural gas, and the clearing of forests to create farmland. But to put all of this evidence together to quantify how quickly rising CO2 levels will alter global temperatures you have to build a model.
Continuous measurements at Mauna Loa in Hawaii since 1958 show the steady rise of carbon dioxide in the atmosphere. The dots show monthly averages. The saw-tooth shape of the graph is due to the annual cycle of plant growth in the extensive forests of the northern hemisphere, which absorb CO2 in the summer and release it in the winter.

Charney’s group began by clarifying precisely which questions computer models could answer. To quantify how the climate will change as a result of human activity, we can split the question into three parts (see Figure 1.5). The first part of the question is about greenhouse gas emissions – specifically, how will pollution from human activities alter the atmosphere over time? You could simply extend the trend shown in Figure 1.4 into the future. But that assumes society will continue to develop (and industrialize) in same way it has in the past. What if renewable energy becomes cheaper and replaces fossil fuels? Or we find ways to use less energy, or to limit the emissions of greenhouse gases? So to answer this question accurately, we would need to know how the global economy is likely to develop, how much energy we will use, and how we will generate that energy. This is not a question for climate science; it is a question for economists and technologists.13 Today’s climate scientists rely on such experts to generate plausible scenarios by which human society might develop in the future, and how much greenhouse gases we will produce in each scenario.
Three distinct research communities have sprung up around three parts to the question identified by Charney: how fast will emissions rise? (Integrated Assessment Models); how will the climate system respond? (Global Climate Models), and how will this affect us? (Impacts and Vulnerability). In this book, we’ll focus on the second of these.
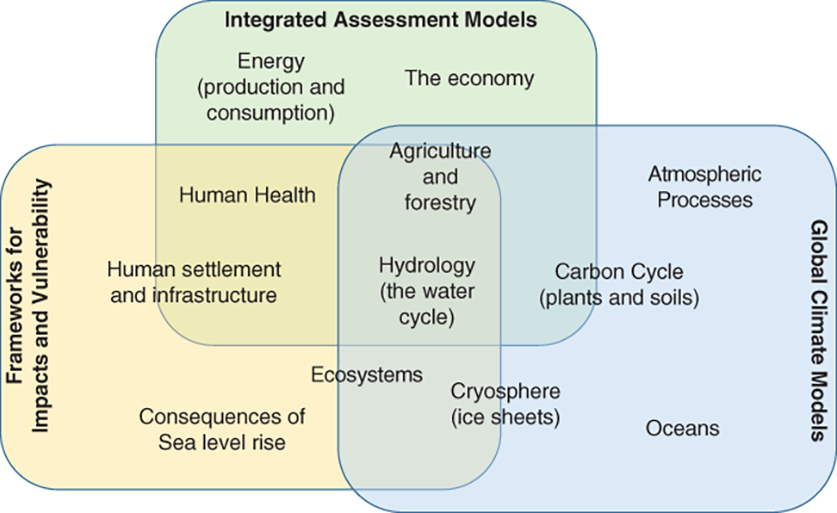
Another part of the question is about the impacts of climate change – how will the inhabitants of planet Earth (including humans) be affected by rising global temperatures? This is also hard to answer. The world’s climate is a complex system, and impacts may play out over many different timescales. Ecosystems may be damaged or destroyed, and the impact on human society might vary in different parts of the world, depending on how resilient they are to flooding, heat waves, wildfires, droughts, sea level rise, and so on. Climate models are unable to calculate these impacts directly. The best Charney’s group could do in 1979 was to point to summaries by experts in other fields, although research since then has filled in many gaps in our knowledge.
So a climate model cannot predict how much humans will pollute the atmosphere, nor can it quantify how much humans will suffer from the resulting climate change. But it can answer the question that connects them: what, precisely, is the relationship between rising greenhouse gases and rising temperatures? A rough estimate can be made using a few basic equations describing the balance between incoming energy from the sun, and the rate at which that heat is lost back into space. But many complicating factors can affect this answer. For example, warmer air holds more moisture, which can then trap more heat, and further increase the warming. Clouds play an important role, reflecting some of the sun’s rays back into space, so if warmer air produces more clouds, this could help reduce the warming at the surface. The oceans can absorb a lot of heat energy, and so will delay the rate at which the planet warms. Weather systems transport heat around the planet, so some regions may warm a lot more, and others may even cool slightly. The computer models are designed to help scientists understand how all these factors interact.
As is common in science, the scientists in each research lab choose different parts of this question to explore, putting into their models whichever factors they think are important. This diversity is a major strength of scientific research, but it makes it hard to compare results from different groups, and frequently confuses people outside the field. By investigating (or ignoring) different parts of the problem, scientists in different labs sometimes appear to offer conflicting results. This happens in many areas of science. Newspapers love to write stories about new research showing something that was previously thought to be good for our health is actually bad for it (or vice versa). The truth is rarely quite so simple. Cause-and-effect relationships are complex, and many factors affect how they will play out. Usually, when results don’t agree, it’s because the scientists are investigating subtly different versions of a research question – a treatment that’s good for arthritis might be bad for your heart.
Charney’s group could have picked whichever model they thought was the “best” – perhaps the most complete, or the most accurate – and summarized its results. But that wouldn’t have answered the president’s question of how sure we are about the results. Instead, they tried something new: a systematic comparison of several different models.14 They began by defining an idealized experiment, and compared what happens in each model during that experiment. By setting up the same experiment15 in each model, they could then explore how and why the results differed, and hence assess how well each model captured the underlying science.
It would have been tempting to conclude that where the models agreed, we could be sure of the answers, and where they disagreed, those were the unknowns. But that merely avoids the problem: what if all the models contain the same mistakes? What matters is that any similarities or differences in the model outputs can be explained in terms of how the models were constructed. We will return to this crucial point later in this book.
Charney Sensitivity
The Charney report created a framework that has been used to evaluate climate models ever since. The most immediate impact was a definition of the first benchmark test for climate models. That benchmark – to compute what is now known as Charney Sensitivity – is still used as one of a growing set of standard experiments for comparing climate models today. The experiment simulates what happens if you instantaneously double the amount of carbon dioxide in the atmosphere. Because temperatures tend to rise fairly slowly in response to increased CO2, the experiment keeps the model running, typically for a few decades of simulation time, until the climate simulated in the model stabilizes, and settles to a new equilibrium temperature. The test is entirely artificial – an instant doubling of carbon dioxide in the atmosphere is impossible in the real world. But the experiment tells us a lot about how different models simulate a changing climate, and how much they agree or disagree about the magnitude of climate change.
Actually, the idea of measuring how the model reacts to a doubling carbon dioxide wasn’t new – climate modellers in the 1970s often included the temperature response to a doubling of CO2 when presenting model results in published papers. Unfortunately, each group would set up the test differently, and then report just a single number – the size of the change in global temperature when they ran this scenario in their model – and the answer from each group was different.
When it comes to forecasting how the climate will change in the future, a single definitive answer isn’t plausible, because the climate is such a complex system. We need to know a full range of likely outcomes, taking into account what we know and what we don’t know. This was what the White House was really asking: how big is the margin of uncertainty?
Applying the same test to each computer model will give a range of different answers, which can then be analyzed based on what each model includes and what it leaves out. And if there is something all the models leave out, we need a way to estimate its effect. In the 1970s, the models included what climate scientists call “fast feedbacks” – changes in cloud cover, snow and ice cover, and heat exchange between layers of ocean, all of which affect the rate of warming. But they didn’t include slower feedbacks – geological processes that play out over thousands of years, and which can store or release vast amounts of carbon dioxide. So the model outputs need to be interpreted carefully, to estimate the size of the uncertainty range.
In doing this, Charney’s group concluded that doubling the concentration of carbon dioxide in the atmosphere would eventually result in a global average temperature increase between 1.5°C and 4.5°C, with a most likely value of 3°C. This answer has proved remarkably robust. In the four decades since the report was written, with huge advances in our understanding of Earth systems, the availability of data from modern satellites, and huge advances in computing power, this answer has barely changed at all.16 The most recent IPCC Assessment Report,17 published in August 2021, has narrowed the likely range to 2.5°C to 4.0°C, and still gives a “best estimate” of 3°C.
Charney’s report also provided new insights about when this warming would occur. If our use of fossil fuels keeps growing we’re on track to double the CO2 in the atmosphere sometime in the 2030s or 2040s. Much of the heat would initially be absorbed by the oceans, so the warming at the surface would be delayed by several decades: “We may not be given a warning until the CO2 loading is such that an appreciable climate change is inevitable.”18 This conclusion captures the biggest dilemma for climate policy. If we wait and see how bad climate change is before we decide what to do about it, we will have left it too late to act. If we are to make wise policy choices, we need a way to assess the likely impacts of those choices many decades into the future. We need accurate computer models.
Things Left Out
The range and sophistication of climate models have grown dramatically since the Charney report. The models Charney assessed focused on the physical climate system, particularly the global circulation patterns of winds and ocean currents that transport heat around the planet. Such models were originally known as General Circulation Models (GCMs). The acronym is also sometimes interpreted as Global Climate Model, which is equally apt. In the last decade or so, these models have evolved further to incorporate simulations of the formation, movement, and melting of ice sheets at the poles, the interaction of vegetation with the climate, and chemical reactions that take place in the atmosphere and oceans. Because they incorporate so much more than just the climate, this new generation of models are referred to as Earth System Models (ESMs).
In this book, I will tell the story of how these models of the physical climate system came to be, what scientists do with them, and how we know they can be trusted. There is much more to be told than I can fit into one book, so I will leave out many things. I will ignore another whole class of models used to understand the social and economic responses to climate change, known as Integrated Assessment Models (IAMs), which focus on questions such as how our demand for energy is likely to grow over the coming century, what this means for the economy, and how much of that demand might be met with clean energy technologies. These models form the basis for estimates of the likely costs of climate change versus the costs of taking action to avoid it.
The distinction between these two classes of models is important. In this book, I have chosen to focus on models that are grounded in the physical sciences, and for which the assessment practices developed by Charney’s group work well. Part of my aim in writing the book is to bring together in one place a detailed description of what these practices are and why they work. As we shall see, these practices draw heavily on the way scientists conduct controlled experiments and submit their work to peer review, as well as the use of hindcasting19 pioneered by the meteorologists to test their the weather forecasting models on data from the past, and a sophisticated benchmarking process that performs detailed model intercomparisons following the example set in the Charney Report.
It appears that none of these practices20 are used for the economics models. So while physics-based models provide an excellent basis for our understanding of the speed and magnitude of climate change in response to our use of fossil fuels, the same cannot be said for our understanding of the economic costs and consequences. Recent research suggests economics models have vastly underestimated the likely costs of rapid climate change.21 Unfortunately, valid criticism of the economic models is sometimes taken to mean that all climate models are useless, especially by those with a vested interest in blocking action on climate change.
The term climate model itself is sometimes used to describe any and all of these models, although it is more commonly used to describe just the physics models I cover in this book. To be clear then, when I use the term climate model in this book, I do not include models of social and economic factors related to climate change.
I will also leave out much of the story of how observational data about the climate is collected, and what climate scientists do with it. Paul Edwards’s book, A Vast Machine,22 covers this very well, from the hard-won efforts to standardize data collection methods in the nineteenth century, through to the huge volumes of data about the planet that are now collected from satellites and remote sensing instruments today. Most of our knowledge about climate change comes from this observational data. You don’t need a climate model to tell you that the first two decades of the twenty-first century were hotter than any time since records began. Nor that carbon dioxide levels in the atmosphere have risen steadily over the last 60 years. We know from experiments the role that carbon dioxide plays as a kind of heat-trapping blanket in the atmosphere. So climate models represent only one of many sources of knowledge about climate change. But they do help fill in many of the gaps in the data, and they provide a testbed for asking “what-if” questions about how the climate system works.
Finally, I will leave out the work of paleo-climatologists, who study evidence from the distant past that shows us how the climate changed before modern humans were around on planet Earth. Michael Bender’s book Paleoclimate23 gives an excellent introduction to their work. These scientists study fossil records, cores of ice extracted from deep in the ice sheets at the poles, and layers of sediment under the oceans, to reconstruct a very long-term record of climate change, particularly over the course of ice ages that mark the last million years. The amounts of different gases in the atmosphere can be measured directly from bubbles trapped in the ice when it was frozen many thousands of years ago.24 Temperatures can be reconstructed from analysis of the oxygen25 in the trapped bubbles as well as evidence about the growth rate of trees, plants, and corals that are known to be sensitive to temperature change. Paleo-climatologists frequently use climate models to test how well these ancient records agree with our current understanding of the climate system. Some of these models – referred to as Earth Models of Intermediate Complexity (EMICs) – tend to be simpler than the models used to study modern climate change, as it would take far too long to run a full GCM for a simulation spanning hundreds of thousands of years. However, EMICs are directly comparable with their more complex cousins, the GCMs, because both can be run over the same scenarios, at least for shorter periods, to assess their consistency with each other. We’ll explore this interplay between simple and complex models more in Chapter 6.
What This Book Is About
Today, the wealth of evidence from direct observation and from measurements of the distant past shows the climate is changing in the way climate scientists predicted, and we’ve already warmed the planet beyond anything previously experienced by modern humans. Computer models tie together the various strands of this evidence, and allow us to test our understanding of cause-and-effect relationships in the global climate system. My goal in this book is to explain how and why they are able to do this.
We will begin, in Chapter 2, with the work of the nineteenth-century scientists who discovered the greenhouse effect and first attempted to measure it. Central to this story is the work of Svante Arrhenius, who developed the first global climate model, before there were computers. We’ll explore how his model worked, and how well it compares to modern models.
Climate modelling didn’t get much further until the invention of the digital computer during the Second World War. Almost immediately, a number of people saw the potential for computers to predict (and perhaps modify) the weather. After the War, John von Neumann assembled a team of meteorologists, led by the young Jule Charney, to develop the first numerical weather prediction program. Chapter 3 tells the story of their model. Their success led, within a few years, to the establishment of operational weather forecasting by computer, and to the development of the first generation of global circulation models, which became a testbed for climate research.
The comparison of weather and climate models provides an apparent paradox: weather forecasts are only good for a few days into the future, while climate models simulate changes that occur over decades to centuries. In Chapter 4, we tackle this issue, focusing on the work of one of the early weather modellers, Ed Lorenz, who discovered that his model appeared to produce different results, even when started from the same conditions. Lorenz’s experiments turned out to be the first practical demonstration of chaos theory, which offers deep insights into the nature of complex systems, and helps us reason about why some things are predictable while others are not. As we’ll discover, chaos theory gives us an explanation for why we can be confident about our predictions of climate change over the coming century, but can’t really say for sure whether it will rain next Thursday.
In the next few chapters, we will visit some of the major climate modelling labs around the world and meet with the scientists who build and work with the models. In Chapter 5, we’ll visit the UK Met Office and get inside the models, to explore how they work, while in Chapter 6, we’ll visit NCAR in Colorado, to explore what experiments scientists run on them.
Perhaps the most remarkable aspect of climate modelling is the huge number of scientists from many different disciplines who participate. Over the years, the computational models have come to play a crucial role in facilitating this collaboration. I’ve often observed that cross-disciplinary collaboration in the sciences is hobbled by misunderstandings, due to a myriad of small differences in how key terminology is used, and the amount of tacit knowledge each scientist has about their own area of specialty. But computational models overcome these barriers, because they force scientists to be explicit about every little detail – after all, when you want a computer to do something, you have to be explicit about everything. Chapter 7 will explore how this massive collaboration works as an elegant demonstration of open science and we’ll visit IPSL in Paris, to see how this collaboration works.
In Chapter 8, we will visit the Max Planck Institute in Hamburg and return to the question of how scientists know they can trust their models, and the observations that lead me to describe climate modelling as a remarkably high-quality engineering process. We’ll explore how climate scientists connect their models with the wealth of observational data on the climate system, and we’ll explore why, surprisingly, when today’s models disagree with the data, it’s often the data that are wrong. The reasons are fascinating.
I close the book with a “so what?” chapter. A model is only ever a simplification of the real world. There are still things the models leave out, and they can’t do all they are asked. But in political arguments, criticism of the models is always wide of the mark; you don’t even need a computer model to establish many of the basic findings in climate science, but the models allow us to put those findings together and explore their consequences.
Remaining weaknesses in the models should not give us any comfort that climate change might not be as bad as projected. The problem isn’t that we don’t know whether the climate is changing: we do. Nor is it that we’re uncertain whether the changes are significant to human life and well-being: they are. The problem is that the further we shift the climate away from the stable patterns that have existed over the entire history of human civilization, the less certain we can be that the models will tell us what happens next. In other words, we know the initial trajectory of climate change, and we know that over the next century, carbon emissions from the industrialized world will take us to a climate unlike any experienced on Earth in the last million years.26 What we don’t know, and what models cannot tell us with any certainty, is what other unpleasant surprises lie in wait for us as the world warms. Such surprises are, in the words of the JASON team, “unlikely to be wholly favourable.”
As we will see, the models show us that because we’ve largely wasted more than four decades since the Charney report, we’ve missed the opportunity to stabilize the climate by cutting emissions. While the politicians argue, and the public worries, the industrial engine that drives our modern way of life grinds on. In the media, climate change is often portrayed as a debate between one group of experts who think it’s a crisis and another group of experts who think it’s nothing to worry about. But in the community of climate scientists, and especially, among those who build climate models, there is no longer any debate about the seriousness of the crisis. Where there is debate, it tends to be about how bad the worst-case scenarios are, and what kinds of pathway will allow us to avoid them. I end the book with an exploration of what the models tell us about these possible pathways into the future, and the urgent choices that face us.


