


Introduction
Our ability to protect species and their habitats is limited by the tremendous field effort needed to obtain key information to determine conservation status, including sufficient distribution and population size data (‘Endangered’ A2 and B1 and B2, IUCN 2012), in addition to financial constraints on the design of long-term species studies.
Worthen’s Sparrow Spizella wortheni is an example of a species lacking adequate data to enable verification of its status in the wild. This New World sparrow of the Central Mexican Plateau is an endemic non-migrant emberizid of desert shrubland (Wege et al. 1993, Behrstock et al. 1997). The drastic reduction in its distribution range (Sada Reference Sada1987, Wege et al. 1993) and reports of a small and ever decreasing population of only 100 individuals, validate its ‘Endangered’ status on the IUCN Red List (Birdlife International 2016).
In Mexico, Worthen’s Sparrow is classified as at risk of extinction (SEMARNAT 2010). Uncertainties regarding population size and the continuing transformation of natural vegetation into agricultural land has increased concern for this species, which for decades was thought to inhabit only a small region of the Mexican high plateau in the Chihuahuan Desert (Wege et al. 1993). However, in the last decade, the presence of Worthen’s sparrow has been confirmed in the southernmost part of its known range (Canales del Castillo Reference Canales del Castillo2010, Canales-Delgadillo et al. 2010). In addition, genetic and ecological studies suggest a population highly dispersed over a wide range, which may indicate a larger population size than previously supposed (Canales-Delgadillo et al. 2012).
Our objective was to outline the actual status of Worthen’s sparrow in the wild, through an intensive search for new localities, initially close to known occurrences, and subsequently across an expanded search zone. After construction of a basic model using historical records, we searched for additional populations. Using new information gathered in the summer of 2013, we constructed a breeding model to update the actual and potential distribution of the species. We also estimated population size.
Methods
Model building
Filtering of input data
Prior to modelling the geographic distribution of the species, all records were screened to remove duplicate data and reduce location error. Records were verified for geographical congruence (coordinates inside the known historical area of distribution) by overlying them with a digital layer map of Mexican states and counties (INEGI 2010a). We did not consider historical records from Chihuahua, Puebla, Veracruz and Tamaulipas in Mexico, because in previous visits to these sites we were unable to confirm the presence of Worthen’s Sparrow, as the landscapes had been cleared for agriculture. A single record from Silver City, USA, considered by the AOU (1998) to be accidental, was also excluded. We applied spatial filtering using ArcGis 9.3.1 (ESRI 2009) by selecting one record within each radius of 2 km, the minimum distance acceptable to improve Moran’s I index (until the spatial distribution of records was random). After data cleaning, 398 out of 446 and 296 out of 316 records remained and were used to run the basic and breeding models, respectively.
Species distribution model
We used the software Maxent (version 3.3.3e; Phillip et al. 2004, 2010) to build two models of the potential distribution of Worthen’s Sparrow, the basic and the breeding models. The former was constructed using the dataset (1980–2013) of Scott-Morales and Vela-Coiffier (2015) which includes records from all seasons of the year. For the breeding model, we searched in the summer of 2013 for new populations in all predicted suitable areas (including those with low and high probability) obtained from the output map generated by the basic model. With these new records, we updated the potential distribution of the species.
Construction of a biotic-abiotic mobility (BAM) scenario
We defined our study area in accordance with the concept of BAM (Soberón and Peterson Reference Soberón and Peterson2005; Soberón and Nakamura Reference Soberón and Nakamura2009). BAM represents the combination of the three main factors that define an area of distribution of a species: where A represents the region with abiotic conditions that are favourable to the species; B represents the region with biotic conditions that are favourable to the species; and M represents the area that has been accessible to the species over a long period of time (Brave et al. 2011). Since Worthen’s Sparrow has a restricted distribution that is confined to the Mexican Plateau, we limited the study area to the ‘Meseta Central Matorral’ (MCM) ecoregion (Figure 1; Williams et al. 2014). This ecoregion corresponds to region M (accessible area) for this species, and includes all vegetation types known to be suitable for Worthen’s Sparrow, based on observations over the last three decades.

Figure 1. Location of the modelled area. The black region corresponds to the ‘Meseta Central Matorral’ (MCM), delimited as ‘M’ according to Soberón and Nakamura (Reference Soberón and Nakamura2009).
Environmental predictors
Climatic variables were computed using the Digital Climate Atlas of Mexico dataset for 1902–2011 (Centro de Ciencias de la Atmósfera 2014). Altitude corresponded to the GTOPO30 Elevations Model, with a spatial resolution of 1 km2, and was used to derive slope and topographical ruggedness (EROS 2014). Vegetation types were obtained from the INEGI Series IV digital map of land use and vegetation, 2007–2010 (INEGI 2010b; spatial resolution, 1:250,000), while soil classification data were obtained from INEGI (2013; spatial resolution, 1 km2). Prior to compiling the environmental variables in Maxent, we converted all layers to the same geographic scale and cell size of 1 km2.
To reduce multicollinearity between climatic variables, we used Pearson’s correlation to select variables (r > 0.70); predictors with the highest correlations to others, were selected. Through this procedure, we reduced the set of environmental variables from 24 to 11 (Table 1).
Table 1. Predictors and their download sources. Codes for bioclimatic predictors were obtained from Bioclim (WorldClim-Project 2016).

Maxent inputs and validation of the model
Preliminary models were run to determine the optimal options for settings. For the final model, we used a random sampling of 25% for model evaluation and 75% for training data. We ran 5,000 maximum iterations and used the linear-quadratic-hinge feature for the basic model and the linear-quadratic feature for the breeding model. All other features remained at default settings. All models were run with 100 replicates. Given that the traditional Area Under the Curve (AUC) value of the Receiver Operating Characteristic (ROC) is not appropriate for evaluation of performance of models with no absences (Phillips et al. 2006), we used the partial ROC test (Nayarani Reference Nayarani2008) after Peterson et al. (2008). The values generated by traditional AUC calculations (probabilities from 0 to 1) were multiplied by 100 and rounded to the nearest integer. The resulting table of modified values fed the partial ROC analysis (CONABIO 2015). The results generated by the partial ROC analysis are expressed as the ratio of the modified AUC area to the area of null expectation, following Peterson et al. (2008). This procedure was applied to each model. We report both AUC and partial ROC values.
Field survey
From June to July 2013, we searched for the presence of Worthen’s Sparrow in the predicted new potential distribution areas, based on the output map of the basic model (including all areas from low to high probability; Figure 2a). The fieldwork was undertaken by three teams comprising four people each: one in the states of Nuevo León and Coahuila; another in San Luis Potosí; and the third in Aguascalientes, Jalisco and Guanajuato. All censuses were conducted on the same days and at the same times. Surveys began in the morning by driving along all tracks and roads that traversed patches of vegetation and publicly accessible communal lands (‘ejidos’), at a speed of 15 km/hr. When searching for and discovering new populations, we simultaneously counted individuals as follows. Once we saw the species or heard singing males, we stopped and got out of the vehicle. Each person in the team walked a line transect in different cardinal directions, counting singing males. The observers continued to walk in the same direction until no further individuals were seen or heard. When a male flew away (not included in the count), the observer waited until the bird perched again or was lost and then continued the count. If a male flew into the transect, it was ignored. The coordinates of singing males (no further than 50 m distant) were recorded. The discreet behaviour of the observers ensured that males usually remained perched, even when they had stopped calling. Because of the open nature of the landscape (low creosote or tarbush with scattered Yucca sp.), we were certain that no males were counted twice, because they were easy to follow. After each count of singing males was finished, we returned to the starting point, searching for females and nests on the way. We searched for males each morning between 07h00 and 13h00 and in the afternoon between 15h00 and 19h00. We undertook fieldwork in mid-summer across the species’ potential geographic range, in order to be certain of finding calling males and confirming that the habitat was suitable for reproduction.
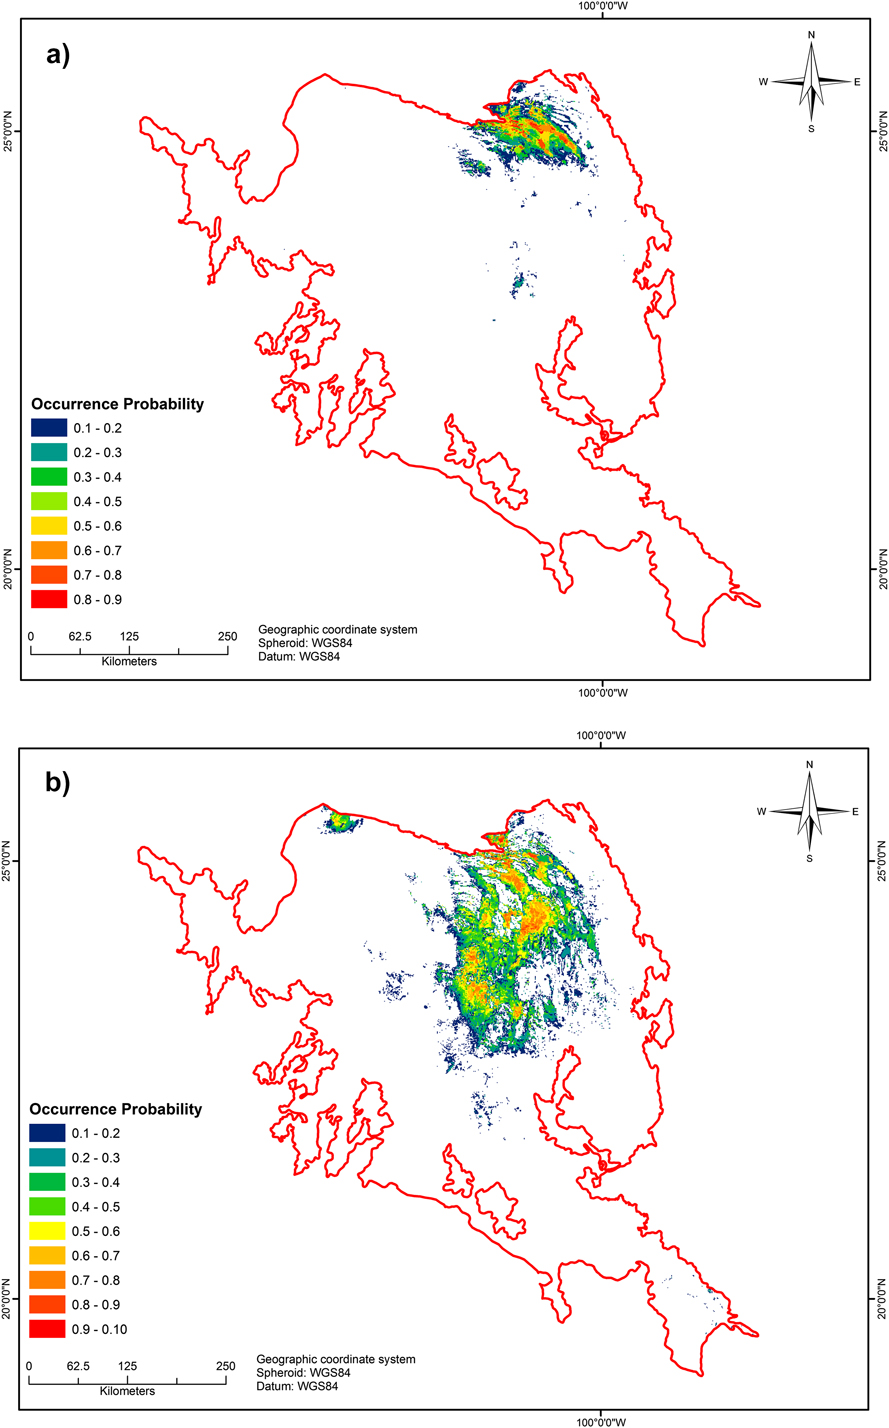
Figure 2. a) Potential range distribution of Worthen’s Sparrow (AUC = 0.966, SD = 0.012; partial ROC = 1.80, SD = 0.17) according to Scott-Morales and Vela Coiffier (2015). b) Potential breeding range (AUC = 0.951, SD = 0.016; partial ROC = 1.57, SD = 0.37) according to our breeding model. Colours represent the probability of bird presence.
Population estimation
To estimate bird density we used the same line transects described above. The transects were of variable length and a total width of 100 m. The areas of transects were calculated in hectares. Area of search density was calculated as the number of birds/10 ha. The obtained value was rounded to the nearest unit. A definitive number of individuals was not registered in our census, as we were unable to access some areas.
Extent of occurrence
To estimate and update the extent of occurrence (EOO) of the species (IUCN 2012), we also determined geographical distributions using both historic (1980–2013) and updated (breeding season 2013) distribution data of the species, using the minimum convex polygon (MCP) method.
Results
The final potential geographic distributions of both the basic and breeding models (Figures 2a and b) generated high AUC and partial ROC test values, with AUCs of 0.966 (SD 0.012) and 0.951 (SD 0.016) and partial ROCs of 1.80 (SD 0.17) and 1.57 (SD 0.37), respectively, indicating that the performance of the models was adequate. The data collected in 2013 improved the potential breeding distribution of the species across the MCM, and confirmed that the current breeding habitat included vegetation other than tarbush-creosote bush. Other vegetative associations included in the breeding habitat of the species were halophytic grassland with scattered juniper Juniperus sp. and xeric scrubland, consisting of tarbush Flourensia cernua and creosote bush Larrea tridentata, along with scattered yucca Yucca filifera or mesquite Prosopis glandulosa; the highest densities occurred in the tarbush–creosote bush communities. In an altitudinal zone between 1,700 and 2,200 m asl, rainfall seasonality underpinned both models, indicating that the occurrence of species during the breeding season likely depends primarily on climatic conditions (Table 2).
Table 2. Contribution of the predictors used for the basic and breeding models: predictors highlighted in bold provided the greatest contribution.

The improvement in data quality and quantity of the breeding model resulted in a better projection of the species potential distribution model, and more reliable prediction of habitat availability relative to the basic model (probabilities of occurrence ≥ 0.6, 1,725 km2 and 3,521 km2, respectively). We found 10 new small breeding populations further south of the historical geographic distribution, primarily in San Luis Potosí. Some locations in the west (Zacatecas state) also appear to be suitable for Worthen’s Sparrow; however, although the species has recently been confirmed as present in that area (J. Cruzado pers. comm. 2015), we were prevented from undertaking fieldwork there because of security concerns. Similarly, we heard singing males in additional locations on private ranches during the fieldwork, but entrance to the proprieties was denied.
Extent of occurrence
The EOO estimates from historical records were 87,800 km2 and 16,994 km2 for the breeding season in 2013 (Figure 3). The lack of records in the breeding season from the west and the south-central portions of the study area (in the state of Zacatecas), where the species has been observed in the breeding season but not confirmed in this study (see above), led to an incomplete estimation of the breeding range, but did provide a current breeding range in the MCM for the first time. We did not find singing males in the states of Aguascalientes, Guanajuato, or Jalisco, as reported elsewhere in winter (aVerAves 2014).

Figure 3. Estimated EOO of Worthen’s Sparrow determined using data from 1980 to 2013 (historical records throughout the year; grey area), and generated using breeding data (summer 2013, hatched area).
Population estimation
We counted a total of 316 males, dispersed in small populations across the central part of the study area. The total distance travelled was 3,910 km. We walked 76 transects with a total length of 64 km; 11, 14 and 39 km in Coahuila, Nuevo León and San Luis Potosí, respectively. The mean density of individuals for all states combined was 4/10 ha (SD 2.05). In the separate states, estimated densities were 4/10 ha (SD 2.26), 3/10 ha (SD 1.51) and 4/10 ha (SD 1.92) for Coahuila, Nuevo León and San Luis Potosí, respectively. We found birds breeding in small (2–20 males) and larger (> 80 males) groups; however, no solitary males were detected in our surveys. Although we cannot guarantee that all singing males located were breeding successfully and accompanied by females, we believe that the majority were, because we found nests and incubating females at all sites. If we assume a 1:1 sex ratio, our search area population estimate is 632 individuals. However, although only the northern area of the distribution range has previously been considered to contain the majority of the Worthen’s Sparrow population, our results suggest otherwise; specifically, San Luis Potosí and potentially Zacatecas may contain almost 65% of the population (217 of the 316 records).
Discussion
Modelling of the data generated in 2013 confirm an expanded distribution and larger population of Worthen’s Sparrow than previously proposed (Canales-Delgadillo et al. 2012; BirdLife International 2016). Our estimation of the EOO (almost 17,000 km2) and AOO (3,521 km2), which constitute important criteria to determine conservation status (Endangered B1 and B2, IUCN 2012), considerably exceeded the Red List criteria specified by the IUCN of ≤ 5,000 km2 (EOO) and 500 km2 (AOO), and also exceed the previously reported EOO of 25 km2 for this species (BirdLife International 2016). Based on our re-evaluation of the status of Worthen’s Sparrow using new data, we suggest a revision of the Red List status of the species from ‘Endangered’ to ‘Vulnerable’.
Significant uncertainties exist about the actual historical range of Worthen’s Sparrow, since historical records from Chihuahua and New Mexico have not been recently ratified. However, as the historical range of the species was considered to be 50,000 km2 (Wege et al. 1993), our estimation does reveal a reduction in range, relative to historical reports. While we were unable to assess the entire male population of Worthen’s Sparrow, our revised data indicate a search area population of 632 individuals, which is substantially above the earlier estimate of 100 (BirdLife International 2016). Data on population size are not well documented, and some imprecise data were reported by Wege et al. (1993). These authors mentioned flocks from the states of Coahuila, Nuevo León, San Luis Potosí, Tamaulipas and Zacatecas with fluctuations in size from 20 to 120. Only through long-term monitoring can we confirm whether the species is increasing in numbers in suitable habitats across the Mexican Plateau, or whether limited records and lack of observations have caused its geographic range and population size to be underestimated.
We were able to confirm that Worthen’s Sparrow is an errant species, congregating in small groups in the breeding season and with other species in the non-breeding season, with a fragmented distribution. It changes breeding location in accordance with recent rainfall, mainly tending to avoid dry sites. Similar behaviour has been reported in other species, which display opportunistic breeding, usually in association with nomadism (Zann et al. 1995, Morton et al. 2011). Although the lack of significance of land cover in explaining the presence of Worthen’s Sparrow is perhaps surprising (Table 2), the flexibility of the species makes it possible for individuals to breed in different types of vegetation (as noted in this study), while their high mobility facilitates their dispersal to sites that have received adequate rainfall to breed. Our observations in 2012 confirmed the absence of the majority of the population from the northern part of the study area, from where most known historical breeding records are derived (despite land cover). Larger breeding populations were found in San Luis Potosí, where rainfall had been higher. Rainfall is well known to stimulate reproduction in a range of passerines in arid regions (Leitner et al. 2003, Hau et al. 2004, Illera and Diaz 2006), and Worthen’s Sparrow appears to follow a similar pattern, since seasonal precipitation was the most important predictor in our modelling. In an era of climate change, it will be important to determine whether frequent rainfall can modify the habitat of Worthen’s Sparrow and improve breeding areas and food availability, contrary to published statements (BirdLife International 2004).
In recognition of the conservation status of Worthen’s Sparrow and the need to develop appropriate conservation strategies, a long-term monitoring strategy is necessary to confirm the population size of the species and temporal-spatial fluctuations in population numbers and distribution from year to year. The priority for conservation should be to maintain the natural vegetation of the Meseta Central Matorral as a mosaic of ecosystems and as a critical habitat, not only for Worthen’s Sparrow, but also for other vulnerable species such as the Mexican prairie dog Cynomys mexicanus, kit fox Vulpes macrotis and badger Taxidea taxus.
The improvement of the EOO and AOO through the implementation of field research and use of a species distribution model (SDM) demonstrates the effectiveness of combining these factors for conservation purposes. It is possible to overcome the shortfall in information, with minor time investment and efficient research in relevant areas. Using the limited information available as a baseline (basic model), we were able to focus our search in potentially fruitful areas to improve data quantity and quality. However, it is necessary to have relevant knowledge of the ecology of the species and general features of the habitat, to make effective use of the information generated by the SDM. Our study is not novel in its support for the efficacy of SDMs for improvement of species conservation (Thorn et al. 2009, Torres and Jayat Reference Torres and Jayat2010, Sousa-Silva et al. 2014; Syfert et al. 2014); however our findings highlight the contribution of SDMs to fieldwork and monitoring, as we have gathered crucial data relevant to conservation assessment of a threatened species.
Acknowledgements
The research was funded by CONACyT (157677), CONABIO (JM004) and PAICyT (CN974-10). We particularly thank A. G. Luna, A. Sanchez, J. J. Briones, L. Martinez, F. García, A. Guerrero, A. Martínez and M. Reyes for field assistance. C. Garza, A. Rowell and N. Reid made valuable comments on an early draft. We thank our anonymous referees for incisive feedback on a previous version of the manuscript.


