


1. Introduction
Lengthening work lives for those able to work longer is an important part of the policy response to population aging. Reducing age discrimination in hiring is critical to achieving this goal, because many seniors transition to part-time or shorter-term ‘partial retirement’ or ‘bridge jobs’ at the end of their careers (Cahill et al., Reference Cahill, Giandrea and Quinn2006; Johnson et al., Reference Johnson, Kawachi and Lewis2009), or return to work after a period of retirement (Maestas, Reference Maestas2010). There is an extensive body of research testing for employer discrimination against older workers in labor markets, using correspondence studies to test for discrimination in hiring (e.g., Bendick et al., Reference Bendick, Jackson and Romero1997, Reference Bendick, Brown and Wall1999; Lahey, Reference Lahey2008; Farber et al., Reference Farber, Herbst, Silverman and von Wachter2019; Neumark et al., Reference Neumark, Burn and Button2019a, Reference Neumark, Burn, Button and Chehras2019b). This research focuses on measuring employer behavior – specifically, whether there is less hiring of qualified older workers – and generally finds evidence consistent with hiring discrimination against older workers.Footnote 1 There is little work, however, that studies how workers respond to age discrimination in the labor market.
In this paper, we explore potential worker responses to one possible manifestation of age discrimination in the labor market – in particular, whether workers perceive job requirements using language related to ageist stereotypes as biased against older workers searching for jobs. If ageist stereotypes in job ads discourage older workers from applying for jobs, such language can have the same adverse outcome on the hiring of older workers as employers discriminating against older job applicants. Viewed in the context of labor market search, direct discrimination by employers reduces the likelihood that employers make an offer to an older worker, whereas discouraging them from applying reduces the likelihood that older workers find a match. Both thus reduce the arrival rate of job offers, lengthening unemployment durations – which are generally longer for older workers (Neumark and Button, Reference Neumark and Button2014), a problem that has been long noted in policy debate regarding age discrimination (U.S. Department of Labor, 1965).
We study how job-ad language using age-related stereotypes, or more blatantly ageist language, is interpreted by potential older job applicants, in two steps. First, we use machine-learning methods (partly developed in Burn et al., Reference Burn, Button, Munguia Corella and Neumark2022a) to identify phrases in job ads that are linguistically related to ageist stereotypes drawn from the industrial psychology literature.Footnote 2 We use these phrases to construct typical job-ad language that reflects specific age stereotypes. Second, we conduct an experiment using an online panel (Amazon's MTURK), in which we ask whether respondents perceive this job-ad language, which the machine-learning algorithm classified as related to ageist stereotypes, as ageist – based on questions about whether stated job requirements are ‘biased against workers over the age of 50’. Our experimental evidence shows that job-ad sentences that are classified as closely related to ageist stereotypes by the machine-learning algorithm are also rated by experimental subjects as biased against older job seekers. Because we couch the language in the MTURK experiment in the context of job search, we believe our evidence speaks directly to the question of whether ageist language in job ads may discourage older workers from applying for jobs.
Utilizing ageist language in job ads to shape the applicant pool by discouraging older applicants has a potential benefit for discriminatory employers, because of the incentives created by age discrimination laws. A lower representation of older workers in their applicant pool can justify a lower representation of older workers among employees, making it easier to rebut an allegation of age discrimination in hiring. More generally, employers who do not want to hire older workers might, in order to avoid unnecessary search costs, discourage older workers from applying by signaling their ageism.
Our evidence does not directly address the actual behavior or intent of employers that might underlie the use of ageist stereotypes in job ads. Using such language to deter older job applicants could reflect taste discrimination or statistical discrimination. That is, employers may intentionally use this language to deter older workers from applying, either because of taste discrimination (a simple aversion to hiring older workers) or statistical discrimination (an assumption that older workers are not as productive), and this may ‘work’ because respondents perceive age stereotypes in job ads as directly reflecting age bias. Alternatively, employers could be stating actual job requirements; they may have no discriminatory intent in doing this, but may engage in statistical discrimination by assuming that older workers who apply for jobs with these requirements are less likely to meet the requirements. Older job searchers, knowing this, might perceive the job-ad language as ageist because job ads with this language are less likely to result in job offers when older workers apply.Footnote 3
However, we believe that this more subtle story of no discriminatory intent is not the operative one, and instead that employer behavior and respondent perceptions pertain to a desire to avoid hiring older workers. First, in the original correspondence study from which the job ads are drawn (Neumark et al., Reference Neumark, Burn and Button2019a), evidence of statistical discrimination based on age-related worker skills and characteristics was largely ruled out. Second, the treatment phrases we use based on the machine learning (described in more detail below) do not seem to describe skills that are notably different between workers over and under 50 (the dividing line for ‘older’ in our experiment). As examples, the phrases are things like ‘good communication and teamwork’, ‘accounting software systems like Netsuite…’ (software that is over 20 years old, and other software we mention is also older), and ‘lift 40 pounds’. Thus, our sense is that the job-ad language is perceived more as a signal of ageism than as a signal of job requirements that are strongly related to age. Third, our MTURK experiment specifically asks about perceptions of age bias.
Regardless, in each of these scenarios, our evidence has the potential to identify job-ad language that can deter job applications from older workers. As discussed in the next section, any of these scenarios could reflect age discrimination as either social scientists or the law define it.
Our paper demonstrates the promise of machine-learning methods to help reduce age discrimination in the labor market. We present two types of evidence as ‘proof of concept’. First, we verify that our machine-learning methods detect the presence of stereotyped language in our constructed job ads, even when only one sentence in the job ad is highly related to the ageist stereotype. Second, our main evidence, from our experiment, indicates that this age-stereotyped language is viewed as biased against older workers, which we believe indicates that older job seekers would be less likely to apply to job ads using such language.
Two recent papers have focused on how ageist stereotypes impact the job prospects of older workers. Burn et al. (Reference Burn, Button, Munguia Corella and Neumark2022a) show that ageist language in job ads helps predict age discrimination by employers, and van Borm et al. (Reference van Borm, Burn and Baert2021) show that employers use ageist stereotypes to help them evaluate resumes. In contrast, we focus on the potential responses of workers to job-ad language that reflects ageist stereotypes. By examining the behavior of workers rather than employers, we are the first in this literature to show that language reflecting age-related stereotypes is viewed as ageist by employees, and that machine-learning methods developed to identify age-related stereotypes have potential applications for enforcing non-discrimination protections for older workers.
It might seem unsurprising that job ads using ageist or age-stereotyped language are perceived as ageist by respondents. Indeed, one of our treatments uses language suggested by AARP that is sufficiently blatant (e.g., ‘energetic person’) that the results might not appear surprising at all. A real-world example that is similarly blatant is stating maximum experience levels in job ads. This occurred recently in Kleber v. Carefusion Corp., where the job ad requested ‘3 to 7 years (no more than 7 years) of relevant legal experience’, language that will clearly act to exclude many older applicants.Footnote 4
However, we emphasize two points that make the evidence much more interesting and applicable to real-world job ads that do not use this kind of blatant – and exceptional – language. First, we use phrases from actual job ads (approximately 14,000 job ads collected in the age discrimination correspondence study by Neumark et al., Reference Neumark, Burn and Button2019a), selecting phrases that appear in these ads and are semantically related to age stereotypes. As shown later in the paper, these phrases are far more subtle.Footnote 5 Second, the kinds of age-stereotyped phrases from the job ads that we use help predict age discrimination by employers, as measured in the correspondence study (Neumark et al., Reference Neumark, Burn and Button2019a; Burn et al., Reference Burn, Button, Munguia Corella and Neumark2022a). In other words, our methods can be used to identify actual age-stereotyped language, and the same methods we use in this paper to study perceptions of potential job applicants also classify job-ad language in a manner that helps predict employer discrimination. Thus, we can garner evidence on whether the same kind of job-ad language that is associated with discriminatory employers also might be likely to discourage older workers from applying for jobs by signaling age discrimination. This kind of discouragement could lead to age patterns in application and hiring data that understate age discrimination, including in correspondence studies of age discrimination if discriminatory employers do not discriminate as much against older applicants because ageist language has already reduced the number of older applicants.
2. Conceptual framework and implications of the evidence
Why might employers use stereotyped language in job ads? One hypothesis is that employers who discriminate based on age use stereotyped language to try to shape the applicant pool, to reduce the likelihood that age discrimination is detected. Using language that conveys positive stereotypes related to young workers might discourage older workers from applying (as might language conveying negative stereotypes related to older workers – although that seems less likely and is, in fact, less common in our data). This discouragement from applying would lead to the underrepresentation of older applicants in the applicant pool, and is potentially valuable to a discriminating employer because the probability of a hiring age discrimination claim and of an adverse outcome for the employer is smaller when the ratio of older applicants to younger applicants is lower.Footnote 6 Employers could use job-ad language this way regardless of the nature of age discrimination, and, in the case of statistical discrimination, whether or not the language is related to the assumptions they make about older workers (e.g., they might assume older workers will leave the firm sooner). In either case, employers might use ageist language in job ads to deter older workers from applying, but introduce this language via job requirements that are correlated with age, natural to use in job ads, and not so blatant as to make the age discrimination clear.
A second hypothesis, which is more complex, is also related to statistical discrimination. Different jobs may have different requirements, which could be stated in job ads. But employers may hold stereotypes about older job applicants' abilities to meet these job requirements – for example, assuming that older workers are less likely to be able to do the heavy lifting that a job requires, which may well be true on average but of course not of each applicant.
Both statistical and taste discrimination are illegal under US law. Not surprisingly, language in job ads that refers to age either explicitly or ‘mechanically’ is illegal in the United States. The US Code of Federal Regulations covering the ADEA currently states, ‘Help wanted notices or advertisements may not contain terms and phrases that limit or deter the employment of older individuals. Notices or advertisements that contain terms such as age 25 to 35, young, college student, recent college graduate, boy, girl, or others of a similar nature violate the Act unless one of the statutory exceptions applies’ (§1625.4).Footnote 7
The legality of less blatant job-ad language with job requirements that reflect age stereotypes and is associated with lower hiring of older workers is more complex. On the one hand, EEOC regulations state: ‘An employer may not base hiring decisions on stereotypes and assumptions about a person's race, color, religion, sex (including pregnancy), national origin, age (40 or older), disability or genetic information’ (see U.S. Equal Employment Opportunity Commission, n.d.a). On the other hand, job requirements that are based on factors related to age are not necessarily illegal. The legality of job requirements related to age generally requires an employer to show that the use of these requirements is based on a reasonable factor other than age (RFOA), even if that factor is correlated with age. An RFOA is defined as ‘a non-age factor that is objectively reasonable when viewed from the position of a prudent employer mindful of its responsibilities under the ADEA under like circumstances’ (see Federal Register, n.d.). In other words, the law recognizes that characteristics of workers that are related to age can sometimes be legitimate for employers to consider.
Indeed the law even goes further, as in some rare cases employers can use age as an explicit criterion if it is inherently related to a requirement for the job that is related to age but hard to assess independently. This requires that age can be shown to be a ‘bona fide occupational qualification’ (BFOQ) that is ‘reasonably necessary to the normal operation of the business’ (U.S. Equal Employment Opportunity Commission, n.d.b). A key example is Hodgson v. Greyhound Lines, Inc., where the company was sued for having a maximum hiring age. Greyhound prevailed by establishing that driving ability is essential to passenger safety, that older hires would be less safe drivers (because achieving maximum safety took 16–20 years of experience), that some abilities associated with safe driving deteriorate with age, and that these changes are not detectable by physical examination (which could otherwise be a substitute for an age criterion) (see U.S. Court of Appeals, 7th Circuit, 1974). The issue of the rights of older workers vs. public safety has figured prominently in court decisions regarding age as a BFOQ under the ADEA (Combs, Reference Combs1982).
Our evidence indicates that we can reliably detect age stereotyping in job ads, and that this job-ad language is interpreted as disadvantaging older applicants. This evidence can provide information and tools to parties that enforce age discrimination laws, by helping to identify job-ad language that may predict intent to discriminate on the basis of age in hiring and adverse impact on older job applicants. Secondarily, our paper makes a contribution regarding methods used in the literature in industrial psychology on employer and worker beliefs about stereotypes. Much of the previous literature in industrial psychology utilizes surveys to understand how employers view older workers or how workers view job ads. To incentivize the elicitation of respondents' true beliefs, we asked respondents to guess how the average respondent to our survey rated each statement, and respondents were paid based on how close to the true value their answers were. When asked to state their own beliefs, respondents in our survey were less likely to rate a statement as ageist. But when asked how they thought the average respondent would view the same statement, they rated statements as more ageist on average. These findings suggest that standard surveying methods that do not incentivize responses may lead to an underreporting of perceptions of ageism; one potential explanation is that it is not socially desirable to perceive the language we use as ageist (Cherry et al., Reference Cherry, Allen, Denver and Holland2015), since doing so indicates that one attributes the characteristics of people used in this language as applying more to older people.
Our evidence cannot speak directly to the question of taste vs. statistical discrimination or whether the job requirements would be viewed as legal. Indeed, we do not study employer behavior in our experiment, although we do use job-ad language from real employers. Instead, in our experiment we ask respondents if they perceive job-ad language pertaining to job requirements as ‘biased against workers over age 50’ (as explained in more detail below). A positive response could mean either that the language is perceived as directly reflecting age bias – aversion to hiring older workers – or that the language is perceived as ‘biased’ because it puts older workers at a disadvantage because they may be less likely to satisfy the stated job requirement. Similarly, our evidence does not speak to whether a stated job requirement would be legal. What our evidence does address is whether age stereotypes expressed in job ads likely signal to job applicants that older workers are less likely to be hired. Thus, our evidence can reveal the potential for employers to use job-ad language to discriminate against older workers in hiring, and the potential adverse impact on older job applicants. Challenges remain in fully understanding the behavior underlying the actual use of such language in real job ads, and the legality of doing so.
Nonetheless, evidence on age stereotypes in job language could help identify employers that may be discriminating based on age, providing an additional tool in identifying potential discriminators, above and beyond current enforcement mechanisms that rely on worker-initiated complaints focused on hiring outcomes.Footnote 8 This could be valuable for two reasons. First, the use of ageist stereotypes in job ads that discourage older applicants from applying for jobs could provide, to the EEOC, a potential indicator of age discrimination in hiring that could be investigated further. In addition, the EEOC might, in response to such evidence, issue guidance to employers to avoid language that might discourage older workers from applying.Footnote 9 Second, if employers use ageist stereotypes in job ads to discourage older workers from applying for a job, this can serve as a second source of age discrimination and hiring that has the same effect in lowering employment of older workers as direct hiring discrimination.
3. Studying job ads
Very few studies explore job ads, and fewer still focus on discrimination. Among studies of issues other than discrimination, Modestino et al. (Reference Modestino, Shoag and Balance2016) use text data from job ads to document that ‘downskilling’ occurred during the recovery from the Great Recession, with firms reducing skill requirements in their job ads. Deming and Kahn (Reference Deming and Kahn2018) use text data in job ads to measure how different skills relate to wages. Marinescu and Wolthoff (Reference Marinescu and Wolthoff2020) match text data from job ads to job application data to study the matching process between jobs and applicants. Focusing on discriminatory language, Kuhn and Shen (Reference Kuhn and Shen2013) and Kuhn et al. (Reference Kuhn, Shen and Zhang2018) explore how gender preferences feature explicitly or implicitly in job ads in China, Hellester et al. (Reference Hellester, Kuhn and Shen2020) explore age and gender preferences in job ads in China and Mexico, and Arceo-Gomez and Campos-Vazquez (Reference Arceo-Gomez and Campos-Vazquez2019) study gender and attractiveness preferences in job ads in Mexico. Kang et al. (Reference Kang, DeCelles, Tilcsik and Jun2016) study how potential job seekers respond (with minority job seekers ‘whitening’ their resumes) to job ads including text about valuing diversity.
Two studies, to date, connect the text of job ads to measured discriminatory behavior of employers.Footnote 10 Tilcsik (Reference Tilcsik2011) identifies words in job ads related to masculine stereotypes (decisive, aggressive, assertive, and ambitious) and links those to hiring outcomes in a correspondence study of discrimination against gay men. In the most systematic approach, Burn et al. (Reference Burn, Button, Munguia Corella and Neumark2022a) identify common age stereotypes from the research literature in industrial psychology, use machine learning to calculate the relationship between the text of the job ads and specific age stereotypes, and test whether job-ad language related to the stereotypes predicts hiring discrimination against older workers in a correspondence study. As already noted, the present paper builds on this prior work.Footnote 11
There has been no research on whether the ageist language in job ads is perceived as ageist by potential job applicants. Obviously, the use of such language in job ads is much more troublesome if it is perceived as ageist and thus discourages older workers from applying for jobs. If this happens, it should be viewed as another dimension of age discrimination in hiring – one that has not been studied or detected in the research literature that tests for hiring discrimination, mainly using correspondence studies.Footnote 12
What is known about how job applicants read job ads focuses exclusively on gender bias. Gaucher et al. (Reference Gaucher, Friesen and Kay2011) found that job ads for male-dominated occupations used words associated with male stereotypes (such as ‘leader’, ‘competitive’, or ‘dominant’) more frequently than advertisements for female-dominated occupations, and women found job advertisements less appealing when they contained more masculine than feminine wording (Bem and Bem, Reference Bem and Bem1973; Gaucher et al., Reference Gaucher, Friesen and Kay2011). Chaturvedi et al. (Reference Chaturvedi, Mahajan and Siddique2021) use machine learning to study job ads, identifying words that are predictive of a gender preference; they find that wage offers are lower in jobs with language expressing a preference for women, whether directly, or implicitly through gendered language related to skills, personality traits, and flexible work.
4. Methods
4.1 Selecting the stereotypes
To select the stereotypes we study, we start with a list of 17 ageist stereotypes from the industrial psychology literature, identified in earlier research (Burn et al., Reference Burn, Button, Munguia Corella and Neumark2022a). We conducted a detailed review of the industrial psychology, communications, and related literature to identify age stereotypes that this research identifies as applying to workers in their 50s and 60s. We relied on studies that were more likely to cover more recent older cohorts, since age stereotypes may change over time (Gordon and Arvey, Reference Gordon and Arvey2004); we avoided studies published before the 1980s and studies of non-Western countries. We reviewed an extensive set of literature reviews and meta-analyses to identify the relevant studies, but we draw our stereotypes from papers that tested for stereotypes rather than papers that simply reported or aggregated the evidence on stereotypes from other studies. We compiled lists of the stereotypes that these studies identified as applying to older workers. Since studies often have similar stereotypes but phrase them differently, we grouped very similar stereotypes into aggregate categories in a similar manner to the literature review and meta-analysis papers (e.g., Posthuma and Campion, Reference Posthuma and Campion2007). To focus the analysis on stereotypes on which research agrees, we included a stereotype in our analysis only if at least two studies confirmed the stereotype. This process led to 17 stereotypes of older workers, listed in Table 1.Footnote 13
Age stereotypes from industrial psychology literature

Note: See Burn et al. (Reference Burn, Button, Munguia Corella and Neumark2022a).
For our analysis of job ads, we selected a subset of these stereotypes that met the following criteria. First, the stereotype is commonly expressed in job-ad language about the ideal or preferred candidate's skills or attributes; we did not want to focus on stereotypes that are not often included in job ads (e.g., hearing and memory), even if, according to the industrial psychology literature, employers hold these stereotypes. Second, we focused on stereotypes for which we had evidence of a correlation between discrimination and the stereotype (from Burn et al., Reference Burn, Button, Munguia Corella and Neumark2022a).Footnote 14 Third, older workers should be aware that employers held the stereotype. As evidence, we drew on various reports put out by AARP; see Brenoff (Reference Brenoff2019) and Terrell (Reference Terrell2019). Our final list of stereotypes is three skills or abilities for which older workers are stereotyped as deficient: communication skills, physical ability, and technological skills.Footnote 15
Industrial psychology research focuses on the skills that employers desire in workers, but in which older workers are perceived deficient. In contrast, job ads rarely use negative formulations of a skill requirement, but instead turn the language to a positive formulation (e.g., ads will ask that a candidate be ‘adaptable’, rather than that they are ‘not stubborn’). When describing skills and requirements related to our stereotypes, employers use words like ‘outgoing’ (Stewart and Ryan, Reference Stewart and Ryan1982), ‘sociable’ (Kite et al., Reference Kite, Deaux and Miele1991), and ‘conversational skills’ (Schmidt and Boland, Reference Schmidt and Boland1986; Ryan et al., Reference Ryan, See, Meneer and Trovato1992) to describe communication skills. Physical ability is expressed using words like ‘energy’, ‘speed’, and ‘physical capability’ (Levin, Reference Levin1988; van Dalen et al., Reference van Dalen, Henkens and Schippers2009). Technological skills focus on the ability to use ‘new technology’ or on ‘technological competence’ (AARP, 2000; McGregor and Gray, Reference McGregor and Gray2002; McCann and Keaton, Reference McCann and Keaton2013).
4.2 Creating the treatment (stereotyped) and control job-ad language
We create two sets of phrases: treatment phrases and control phrases. The treatment and control job-ad sentences differ in the job requirements expressed and the type of language used in these phrases; we try as much as possible to have the treatment and control phrases describe similar skills, although we had to allow for some differences to be appropriate to the occupation (see Table 2).Footnote 16 Our control sentences express job requirements that are also appropriate for the job but use age-neutral language not related to these age-stereotyped skills or abilities, while our treatment sentences use language highly related to these ageist stereotypes.
Control and treatment phrases by occupation
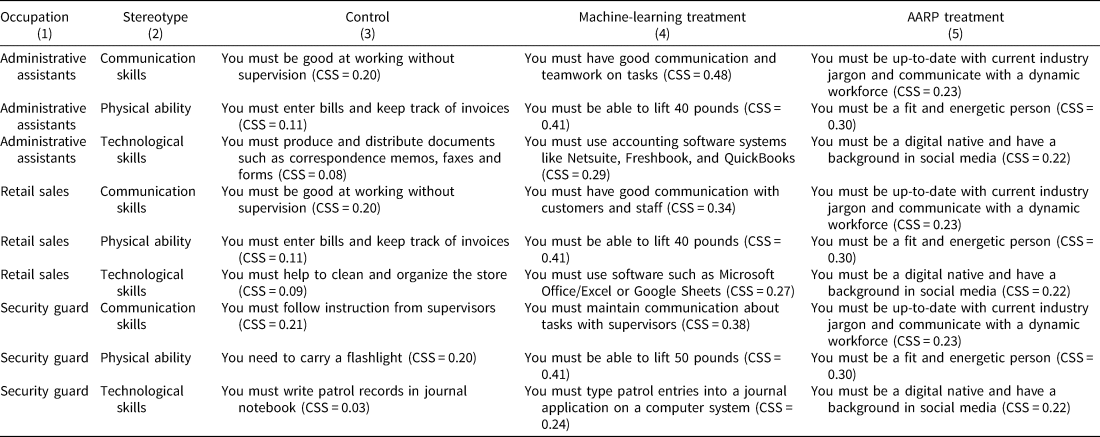
Note: See text for a description of how each sentence was created. The average cosine similarity score with the stereotype for each phrase (averaging over the cosine similarity score of each word contained in the phrase) is reported in parentheses. CSS, cosine similarity score.
Our main method for generating phrases and sentences highly related to ageist stereotypes uses measures of semantic similarity generated by machine-learning methods. Moreover, to isolate the effects of the different stereotypes, we used the results from these machine-learning methods to construct sentences that were highly related to only one of the three stereotypes we use. We calculate the semantic similarity of nearly one million (997,562) phrases from the approximately 14,000 job ads collected in Neumark et al. (Reference Neumark, Burn and Button2019a) to the communication skills, physical ability, and technology skills stereotypes, measuring semantic similarity by the ‘cosine similarity score’, a metric that ranges from −1 (completely unrelated) to 1 (identical).
We provide a brief overview, explanation, and example of these machine-learning methods and the cosine similarity score.Footnote 17 We first identify a corpus of the English language that we will use to measure how similar words and phrases are to each other. We use as the ‘corpus’ the entirety of English-language Wikipedia, which contains all words in the English language. With this corpus, the ‘input data’ are the sentences and paragraphs of Wikipedia, and we compute the semantic similarity between any two words based on the frequency with which they appear together in either sentences or paragraphs, a common procedure in computational linguistics. This procedure results in a vector space (we use 200 vectors), with each phrase (we use three-word phrases, or ‘trigrams’) being represented by weights on each one of these vectors. The vector weights are chosen by a typical machine-learning algorithm that iteratively selects these vector weights so as to accurately predict which phrases are near each other (in the same sentence or paragraph) in Wikipedia.
We use these vector weights to compute the similarity between all three-word phrases in our ads and the ageist stereotypes drawn from the industrial psychology literature. Using the vector weights for these computed from the Wikipedia corpus (which can always be created by breaking down phrases into words), we calculate the cosine similarity (CS) score between these trigrams from the job ads and each stereotype, defined as:

where ‘trigram’ and ‘stereotype’ in the equation refer to the vectors of weights.Footnote 18
The CS score varies between −1 and 1. A score of −1 means the words never appear in the same sentences or paragraphs in Wikipedia. As the CS score increases, the usage of the words becomes more similar; that is, they are used more often in the same sentences or paragraphs, suggesting that they are often used to discuss the same topic. This is what the literature defines as greater semantic similarity. If the words coincide perfectly, the CS score equals 1.
As an example, Figure 1a shows the distribution of CS scores of all three-word phrases (trigrams) with a particular stereotype; the distribution is centered above zero, which makes sense since we are looking at the text from job ads. To provide some examples, referring to the panel for communications skills, trigrams at the lower end of the distribution are highly unrelated (such as ‘Christmas season near’, with a score of around −0.3), and trigrams at the higher end are more closely related (such as ‘interactions excellent phone’, with a score of around 0.5). The examples provided in the other panels – for physical ability and technology – similarly show low CS scores for unrelated phrases and high CS scores for related phrases.
(a) Distributions of cosine similarity (CS) scores. (b) Locations of treatment and control phrases in the CSS distribution of job ad phrases. (c) Comparing the distribution of CSS scores and perceived ageism by stereotype.
Note: (a) Figure reports the distribution of cosine similarity scores for all trigrams from the job ads with the indicated stereotypes. The higher the cosine similarity score, the more related the trigram is to the stereotype, with a minimum of −1 and a maximum of 1. The phrases in the boxes are examples of phrases located at that point in the distribution.
(b) Solid lines indicate the location of a control sentence in the cosine similarity score distribution. Dashed lines indicate the location of a treatment phrase (for the machine-learning treatments shown in Table 2).
(c) The dark points/lines are at the average cosine similarity score of the treatment and control phrases as shown in Table 2, for the indicated stereotype. The height of the right-hand dark point/line in each panel indicates the difference in the perceived ageism of the machine-learning treatment phrases relative to the control phrases for individuals over 50 (Table 4, column 9).

We use the list of words and phrases from our job ads to construct our treatment sentences. We iteratively edited the sentences to ensure that only the CS score of the manipulated stereotype substantively differed between the treatment and control sentences, whereas the CS scores for the other stereotypes listed in Table 1 (including the other two treatment stereotypes) were similar for the treatment and control sentences. For example, if the treatment language related to communication skills was also highly related to the stereotype about personality, we identified which words in the sentence were highly related to personality, and then we selected synonyms that were less related to personality. Our control sentences were created to express requirements for similar jobs without referring to ageist stereotypes about skills or abilities. We iteratively modified words and phrases that were highly related to our stereotypes to minimize the semantic similarity. The resulting sentences, for the treatment and control groups, are listed in columns (3) and (4) of Table 2, along with their CS scores with the stereotype.
Figure 1b repeats the histograms of CS scores from Figure 1a, but now overlaying the positions of these control and treatment phrases. The figure shows that the treatment phrases are a good deal higher in the distributions than the control phrases, indicating that the treatment phrases are more semantically similar to the stereotypes. Figure 1b and Table 2 illustrate that our experimental results based on the treatment phrases derived from our machine learning will not be ‘contrived’ results that pertain to unusual job-ad language designed to evoke the responses we find. In contrast, we are testing whether subtle shifts in language, which echo actual and reasonable job-ad language variation, affect perceived age bias that could in turn influence job application behavior.
We also use a second stereotype treatment that conveys bias by using ageist language identified by the AARP as related to communication skills, physical ability, and technology skills. We select three AARP examples that best correspond to our respective stereotypes: ‘cultural fit’, ‘energetic person’, and ‘digital native’ (Brenoff, Reference Brenoff2019; Terrell, Reference Terrell2019). We adapted the language to fit our job ads and created three sentences, one for each stereotype (Table 2, column (5)). Using the text about cultural fit, we created the sentence ‘You must be up-to-date with current industry jargon and communicate with a dynamic workforce’ to reflect stereotypes about communication skills, emphasizing the communication aspect of fitting in. Using the text about energetic persons, we created the sentence ‘You must be a fit and energetic person’ to reflect stereotypes about physical ability. Using the text about digital natives, we created the sentence ‘You must be a digital native and have a background in social media’ to reflect stereotypes about technology skills by emphasizing social media.
We thought it useful to use these blatant examples of stereotyped language suggested by AARP as a way of validating our methods and potentially learning more about perceptions of job-ad language related to age stereotypes. One might think that if these phrases are not identified as ageist, it is less likely that our more subtle sentences would be. If these blatant phrases were not perceived as ageist, then absence of evidence that the age-stereotyped phrases generated by the machine learning would point more to an uninformative experiment than to a true lack of perception of age bias in these latter phrases. Conversely, at the other extreme, the experimental responses to the AARP phrases might give a sense of the upper bound of perceived stereotyping we could expect. With reference to the earlier discussion of whether the job-ad language reflects outright age discrimination/bias or stereotyping, one might regard the AARP language as more clearly reflecting discrimination/bias.
On the other hand, note that – as shown in Table 2 – in every case, the CS score with the stereotype for the machine-learning phrase is higher than for the AARP language. This does not necessarily mean that the AARP language is less ageist; rather, the AARP language may be perceived as more ageist, while the language is less directly aligned with a particular ageist stereotype. For example, the AARP language we use for the communications stereotype includes ‘up-to-date’, ‘jargon’, and ‘dynamic’, all of which may reflect ageist stereotypes that are not strongly related to communications. This is not surprising since the AARP stereotypes were not chosen by machine learning with the goal of high semantic similarity with a specific stereotype and not with others. Indeed, as we noted, the AARP language used for communications is in fact described as ‘cultural fit’, which could be much broader.
It is also true that the treatment phrases for some stereotypes have higher semantic similarity with the targeted stereotype than do others. In particular, the CS score is always lowest for the treatment phrase corresponding to technological skills than for the treatment phrases corresponding to the other two stereotypes. However, the score is also lower for the technological skills control phrases. Thus, the impact of the difference between treatment and control phrases may not be expected to differ as much across stereotypes (if, in fact, they are perceived as ageist).
4.3 Validating the treatment vs. control differences
While the AARP language is blatant and should be perceived as ageist by workers, a first question is how well the stereotyped vs. neutral sentences generated from the machine-learning results lead to ads that convey the intended stereotypes. In the language of epidemiology, we would like our treatment sentences to have high ‘sensitivity’ (conveying ageist stereotypes) and ‘specificity’ (conveying information about the specific ageist stereotype intended).
To test whether our phrases are powerful enough to be detected in a job ad, we embedded the treatment and control sentences in job-ad templates we created to correspond to actual job ads. In particular, we created 12 templates per occupation using actual ads collected in Neumark et al. (Reference Neumark, Burn and Button2019a, Reference Neumark, Burn, Button and Chehras2019b) as a guide to creating our experimental job ads. For creating these templates, we supplemented the sample of ads from the correspondence study with recent real ads posted on the same job boards used in that study, to capture contemporaneous patterns of behavior. Figure 2 provides a few examples, and online Appendix A provides the full set of job-ad templates.
Job ad examples.

The treatment and control ads differ in the job requirements (denoted in bold with asterisks in each template), with three sentences assigned to be either a treatment phrase (stereotyped) or a control phrase (not stereotyped). As explained above, the requirements we manipulate have to do with a candidate's communication skills, physical ability, and technology skills. Our control phrases express job requirements that are also appropriate for the job but use age-neutral language not related to these age-stereotyped skills or abilities, while our treatment phrases use language highly related to these ageist stereotypes.
Figures 3–5 illustrate how the semantic similarity differs across the templates for the treatment and control job ads – for ads based on the machine-learning treatment phrases and the control phrases – and show that our treatment job ads do activate the intended stereotypes. Information on the distribution of all phrases found in the actual approximately 14,000 collected job ads is shown in grey, information for the ads with the treatment job-ad language is shown with dashed black lines, and information for the ads with the control neutral job-ad language with solid black lines. The figures show the median to 99th percentile range of the distribution of semantic similarity scores with the different stereotypes and the average (with plotting symbols).Footnote 19 We show these for the three stereotypes we study, and then averaged across the other stereotypes.Footnote 20
Cosine similarity scores of administrative assistant templates (based on machine-learning treatments and the controls).
Note: Graphs display median to 99th percentile range of trigram semantic similarity scores for stereotypes for Administrative Assistant ads. The average trigram semantic similarity score for each stereotype is represented by the respective shape for each template. The category ‘Other’ is the average of the remaining stereotypes listed in Table 1. Control (‘neutral’) templates contain trigrams from the created ad templates with only non-stereotyped phrases included. Collected ads comprise trigrams from all Administrative Assistant job ads. Treatment templates contain trigrams from the created ad templates with the respective stereotyped phrase or phrases included.

Cosine similarity scores of retail sales templates (based on machine-learning treatments and the controls).
Note: Graphs display median to 99th percentile range of trigram semantic similarity scores for each stereotype for retail sales ads. The average trigram semantic similarity score for each stereotype is represented by the respective shape for each template. The category ‘Other’ shows the averages for the remaining stereotypes listed in Table 1. Control (‘neutral’) templates contain trigrams from the created ad templates with only non-stereotyped phrases included. Collected ads comprise trigrams from all retail sales job ads. Treatment templates contain trigrams from the created ad templates with the respective stereotyped phrase or phrases included.

Cosine similarity scores of security guard templates (based on machine-learning treatments and the controls).
Note: Graphs display median to 99th percentile range of trigram semantic similarity scores for each stereotype for security guard ads. The average trigram semantic similarity score for each stereotype is represented by the respective shape for each template. The category ‘Other’ is the average of the remaining stereotypes listed in Table 1. Control (‘neutral’) templates contain trigrams from the created ad templates with only non-stereotyped phrases included. Collected ads comprise trigrams from all security guard job ads. Treatment templates contain trigrams from the created ad templates with the respective stereotyped phrase or phrases included.

These figures display a few key results. First, the biased (treatment) job ads have considerably higher 99th percentiles of the semantic similarity scores with the targeted stereotypes than do the control job ads, as well as higher mean scores (and median scores, although less so). For example, this is apparent in Figure 3, looking at the bars and symbols for the physically able stereotype in the upper left-hand panel, the bars and symbols for the technology stereotype in the upper right-hand panel, and the bars and symbols for the communication stereotype in the lower left-hand panel. (In these three panels, we manipulate only the indicated stereotype, using the neutral language for the other two.) On the other hand, for the remaining stereotypes – the ones we do not manipulate – the control/neutral templates, treatment templates, and collected ads generally have similar medians, means, and 99th percentiles; see, for example, the bars for other in the upper right-hand panel in Figure 3. The implication of the differences in the means and especially the upper tails of the distributions is that the ads we write using the treatment sentences do, in fact, create ads with notably stronger age stereotypes for the ‘target’ stereotype we are trying to convey. But our manipulated treatments do not create similarity with the other stereotypes, as shown by the distribution of all other stereotypes in the job ads (besides the three we are trying to study). That is, our treatment ads only generate a shift in similarity for the stereotypes we are seeking to activate, hence isolating those stereotypes in the job ads.
This key result is also apparent from the lower right-hand panel in each figure, where we use the treatment ads in which we manipulate all three stereotypes at once. If one compares the bars and symbols for any of the three manipulated stereotypes in this panel to the corresponding bars and symbols in the first three panels, the results look almost identical. Again, this reinforces the conclusion that machine learning-generated semantic similarity scores are powerful enough to pick up the presence of stereotyped language, even when only one or a few sentences in the ad are actually related to the ageist stereotype.
In addition, the treatment effect is accentuated by using the control ads rather than simply using all the collected ads because the control ads are more neutral than the full set of collected ads. This difference is evidenced by the much lower values of the 99th percentiles for the control ads than for the collected ads for each of the stereotypes we manipulate, but not for the other stereotypes; for example, compare the bars for physically able and for other in the upper left-hand panel of Figure 3.
5. Experimental evidence
Our final step, and the key new contribution of this paper, was to conduct an experiment using Amazon MTURK to measure whether and to what extent job-ad language using phrases with high CS scores with age-related stereotypes – especially those phrases identified by machine-learning methods – are perceived as ageist by potential job applicants, including older applicants.
We recruited participants through the Amazon MTURK online platform. We restricted the sample to US residents. To guarantee that the median age of the sample was roughly 50, we used age-based quotas with a third of the sample in each of the following age bins: 25 to 35, 45 to 55, and 55+. Because the age bins are pre-set by Amazon MTURK, and MTURK's age data may not be up-to-date, we ask participants to self-report their age. The bins we use to collect self-reported age (25 to 35, 35 to 50, and 50+) broaden the MTURK bins to cover a gap in the age distribution and adjust the highest cutoff to 50, in line with our benchmark age for older workers in the survey. We did not balance the recruitment sample on race or gender.Footnote 21
Our experiment consisted of two parts, the baseline survey and the incentivized survey, which were conducted using Qualtrics. In the baseline survey, we recruited 50 respondents who met our criteria and passed the manipulation checks. The responses from the baseline survey were used solely to provide ‘correct’ answers for the next step when we incentivize our second group of respondents to predict the responses of this first group. For the incentivized survey, we recruited 151 respondents who met our criteria and passed the manipulation checks.Footnote 22
In Table 3, we report the self-reported demographic composition of our sampled MTURK respondents (for the incentivized survey). The sample is relatively more-educated, white, and female than the US population as a whole. Consistent with the age-based quotas we set for recruiting participants, the sample is also relatively older, which may explain some of the differences in the other demographic characteristics.Footnote 23 In line with our target, we generated a sample with a median age near 50, with roughly 55% of participants over that threshold.
Demographics of MTURK sample

Note: MTURK participants self-reported their demographic characteristics. Respondents who selected two or more of the race and ethnicity categories were grouped into the ‘Two or more’ group.
5.1 Baseline survey
The baseline survey had three separate blocks of questions. In the first block of questions, subjects were asked to give their informed consent to participate in the survey (online Appendix Figure C2). In the second block, participants were shown a series of job requirements and told they were from job ads posted online. For each requirement, respondents were asked whether they personally agreed or disagreed with the statement that ‘[Treatment or control requirement] is biased against workers over 50’.Footnote 24 Moreover, participants are told that the study in which they are participating ‘explores the effects of ageist language or age stereotypes in job ads, to understand how this affects who applies for jobs’.Footnote 25 This language frames the survey in the context of job search – importantly, whether job seekers would perceive job-ad language as biased against older workers.
Within each of the blocks that asked about whether or not phrases were perceived as biased, there were three pages for each respective stereotype: communication, physical, and technology. All the treatment and control phrases were tested on their respective pages, but the pages were not labeled by stereotypes that respondents viewed. Respondents had to proceed sequentially through the pages and could not go back or skip between them. The ordering of the questions was randomized on each page. We adopted this approach to force respondents to compare treatment and control phrases in a specific stereotype category without prompting them about the specific age-related stereotype in question. The order of questions on a page was randomized for each respondent. Responses to the questions were given on a Likert scale with the options: strongly agree, somewhat agree, neither agree nor disagree, somewhat disagree, strongly disagree.
In the third block, we concluded by collecting the demographic characteristics of our sample (online Appendix Figure C3). They were asked to report their age, gender, education, and race/ethnicity.
5.2 Incentivized survey
The second survey was split into five blocks of questions. The first asked the participants to give their informed consent. The second block of questions repeated questions from the baseline survey and asked respondents about their own opinions on job requirements.
The next two parts formed the crux of the incentivized survey. In each part, the respondents were asked to guess how the participants in the baseline survey rated the job requirements, and they were rewarded for how correctly they guessed.Footnote 26 Before starting each of these blocks of questions, respondents were sent to a landing page that emphasized the new prompt and cash incentive.
The third set of questions asked respondents to predict what the previous survey respondents answered when they were shown job requirements from the job ads.Footnote 27 For each requirement, they were asked whether they thought previous respondents agreed or disagreed with the statement that ‘This job requirement is biased against workers over 50’. They were shown the same Likert scale shown to the baseline respondents. Respondents were informed that either the third set of questions in the survey or the fourth (described below) would be randomly selected for a cash incentive based on their answers to the questions in that part. They were told they would earn bonus pay, which was to be calculated based on how close they were to the correct answer. If they correctly predicted what the average participant said, they would earn $0.32 per question.Footnote 28 Incorrect answers received less money, with the penalty increasing the further they were from the correct answer. Payouts were calculated using the quadratic scoring rule

where P iq was the payout to individual i for question q based on the average response to question q by previous respondents ($\overline {A_q}$ ) and their answer about how previous respondents answered question q (A iq).Footnote 29 All the treatment and control phrases were tested on their respective pages, but the pages were not labeled by stereotypes that respondents viewed. Respondents had to proceed sequentially through pages and could not go back or skip between them. The question order was randomized within each page.
The fourth block of questions differed from the third in that we asked respondents to guess how the older participants in the baseline survey (those over 50 years old) responded.Footnote 30 Before starting this block of questions, respondents were sent to a landing page that emphasized both the scoring rule and the age of respondents for whom they were guessing. The instructions read, ‘For each requirement, please state whether you think previous respondents over the age of 50 agree or disagree with the statement that “This job requirement is biased against workers over 50”’. The structure of this section was identical to the third block of questions.
5.3 Analyses
To test for differences in how the treatment and control phrases were perceived, we employ a series of regression models. We begin with a simple regression testing for differences in respondent beliefs (self-beliefs and beliefs about other respondents) between treatment and control phrases conditional on observable characteristics:

The ranking that individual i gave to question q (A iq) is the dependent variable. We include controls for gender, level of education, race, and age (X i). If respondents view the treatment phrases as more biased against older workers than the control phrases, we should find that β is less than zero, because the responses (A iq) range from 1 for strongly agree to 5 for strongly disagree. If we observe β is positive, then this is evidence that treatment phrases were rated as less biased by respondents. In Equation (3), and all subsequent regressions, the standard errors are clustered at the respondent level.
Our next step is to explore two forms of heterogeneity in our estimated treatment effects.Footnote 31 The first examines whether respondents view treatment phrases differently depending on the stereotype to which the requirement is related. To test this, we define dummy variables for each of our three pairs of a stereotype treatment and the corresponding control (omitting one from the regression), and interactions between these dummy variables and the dummy variables for each stereotype treatment (communication skills, physical ability, or technology skills):

Thus, the coefficients β i, i = 1, 2, 3, capture how biased respondents view the treatment phrase for the stereotype relative to the control phrase.
The second form of heterogeneity we examine is the difference between the machine learning-derived treatment phrases and the AARP treatment phrases. To do this, we add an additional interaction for when the treatment phrase is the AARP phrase:

The coefficients θ i, i = 1, 2, 3, identify how much more biased respondents view the AARP treatment phrases relative to the machine learning-derived treatment phrases for the same stereotype. More importantly, perhaps, only with additional interactions added do we get separate estimates of the treatment effects that exclude the AARP language – i.e., the phrases based on machine learning from the job ads. Their effects are identified from the estimates of β i, i = 1, 2, 3, in Equation (5). This is potentially important because the AARP phrases may be distant from what would be viewed as normal or acceptable job-ad language.
6. Results
Figure 6 provides a graphical depiction of the answers from the MTURK survey participants. Across the three blocks of the survey that solicited respondents' self-assessments of age-bias, their predictions of previous' respondents' answers, and their predictions of the answers of respondents over the age of 50, our results were consistent. The participants, on average, strongly disagreed with the notion that anyone would perceive the control phrases as biased against workers over the age of 50. Respondents rated the physical and technology-biased phrases derived from our CS score index as more biased than the control phrases, but viewed the communication skills stereotyped phrases as roughly identical to the controls. Opinions of the AARP-derived treatment phrases were starker, as all three were rated as far more age biased than their respective control counterparts.
Survey results.
Note: These numerical ratings reflect the degree to which survey respondents rated phrases as age-biased or not age-biased, with lower numbers indicating a greater bias against older workers. Likert scale ratings were translated to a numerical value such that ‘strongly agree’ mapped to 1, ‘somewhat agree’ mapped to 2, ‘neither agree nor disagree’ mapped to 3, ‘somewhat disagree’ mapped to 4, and ‘strongly disagree’ mapped to 5. The three categories: ‘self’, ‘others’, and ‘over 50’, refer to which group's opinions the MTURK respondents were asked to provide or predict in a given survey block. The average bias rating was collapsed on the treatment status of phrases (control, treatment, and AARP) as well as the category of the stereotype (communication, physical, or technology). Hence, each point in the figure reflects the average bias rating MTURK respondents gave to a given treatment status for a specific stereotype from the perspective of a given group of people. For example, the triangle in the first row of the figure indicates that when respondents were asked for their self-assessment of whether or not the physical stereotype control phrases were age-biased, they, on average, stated that they strongly disagreed.

The absence of evidence for bias for the language related to communication skills may reflect the fact that older workers are not always stereotyped as having worse communication skills, but are sometimes, as Table 1 showed, perceived as having better communication skills. In that sense, one might view the evidence of ageist ratings for the physical ability and technology-related stereotypes but not the communications stereotype as further confirmation that respondent perceptions accord with the industrial psychology literature. (Note that the CS scores from the machine learning do not detect positive vs. negative uses of the language.)
In Table 4, we estimate regression models for the survey responses that delve into more detail. In all cases, standard errors are clustered at the respondent level. In column (1), we report the estimated coefficient from a simple model of the responses for self-beliefs on a dummy variable for whether the response is to any treatment phrase. The estimated coefficient of −0.886 implies that responses are lower by almost one category of the Likert scale. Recall that the responses range from 1 for strongly agree to 5 for strongly disagree, so a negative estimate implies the phrase was perceived as more ageist. The estimate is strongly statistically significant. To help interpret the magnitude, the third number (in square brackets) reports the implied effect in terms of standard deviations of the responses.Footnote 32
Differences in beliefs by treatment (negative implies more biased against older workers)

Note: * indicates statistical significance of the coefficient. *p < 0.1, **p < 0.05, ***p < 0.01. † indicates significant differences between the same coefficients in the Beliefs about all respondents and the Self-beliefs models. †p < 0.1, ††p < 0.05, †††p < 0.01. In each regression, we include a constant and controls for gender, level of education, race, and age (not reported). Numbers in parentheses are robust standard errors clustered at the respondent level; numbers in brackets are coefficients normalized to standard deviations of the outcome variable. Negative numbers indicate higher levels of perceived bias against older workers, as the outcome ranges from 1 for ‘strongly agree’ to 5 for ‘strongly disagree’. The row labeled, e.g., Treatment × physical ability, reports the estimated effect of the machine-learning generated phrase for this stereotype, while the row labeled Treatment × physical ability × AARP reports the incremental impact of using the AARP treatment instead. In other words, for the machine-learning treatment only the first interaction variable equals one, while for the AARP treatment both interaction variables equal one.
Column (2) expands the specification to differentiate the treatment by the type of stereotype – communications, physical ability, or technology skills – without differentiating the machine-learning phrases from the AARP phrases. We find significant negative effects (implying more ageist phrases) for all three, with the largest estimate (whether looking at the coefficient or the standard deviation effect) for physical ability, followed by technology skills, and the smallest estimate for communications. In this model, we also include controls for the different stereotype phrases (whether treatment or control) so that the treatment × stereotype interactions measure the differences relative to the paired control phrase.
Column (3) expands the specification to differentiate between machine learning and AARP treatment phrases. In this column, the estimated coefficients of the treatment × stereotype coefficients measure the effects of the machine-learning phrases, and the treatment × stereotype × AARP estimates measure the differential effects of the AARP treatments relative to the machine-learning treatments. We see that in every case the estimated effects of the AARP treatments are larger, in the direction of more perceived bias. All of the estimated differences for the AARP phrases are statistically significant, and the magnitudes are considerably larger for the communications and technology skills stereotypes. For the machine-learning stereotypes, the estimated treatment effects for physical ability and technology skills are sizable, significant, and negative, while the effect for communications is near zero and insignificant (paralleling what we found in the raw data). On the one hand, this suggests that the phrases generated by machine learning for communications stereotypes do not evoke ageism as strongly, while the phrases in the AARP treatment do; on the other hand, recall the earlier caution that the stronger evidence for the AARP treatment for communications may not isolate the communications stereotype well.
Columns (4)–(6) report estimates of the same specifications, but for the beliefs about other respondents – i.e., how respondents think others would perceive the language. The qualitative pattern of estimates is the same, but the estimated impacts of the treatments are generally larger. This can be seen most simply by comparing the estimated treatment effects between columns (5) and (2). The estimated coefficients are substantially larger – especially for the physical ability and technology skills stereotypes – and in all three cases, the differences are strongly statistically significant (as indicated by the ‘daggers’). Comparing columns (6) and (3) indicates that the differences between self-beliefs and perceived beliefs of others for the physical ability and technology stereotypes are driven by the machine-learning phrases, as their estimated coefficients are substantially larger in column (6) than in column (3), whereas the estimated interactions with the AARP phrases are not uniformly larger or smaller. As noted earlier, the differences in responses for perceived beliefs of others and self-beliefs may reflect the incentives we offered in eliciting the former, which could counter social desirability biases.
Finally, columns (7)–(9) focus on the perceived beliefs of those over age 50. These estimates are similar to those in columns (3)–(6), suggesting that respondents did not particularly believe that older individuals were more likely to perceive the language as ageist.Footnote 33 Of course, given that the stereotyped language was perceived as ageist, the impact on behavior would likely be stronger the older is the person reading job ads with these phrases.
Our last analysis compares the perceptions (self-beliefs, or of others) to the CS scores for the phrases we use (see Table 2), providing a useful graphical depiction of our survey results that captures many of our key points. Figure 7a does this for self-beliefs. Note the vertical axis is decreasing in the reported belief because a lower number implies stronger perceived ageism. Consider first the points plotted for control phrases. Referring back to Table 2, there are two control phrases for physical ability and two for communications, so there are two circles for each of these. But there are three circles for technology skills, for which there are three control phrases. The horizontal axis measures the CS scores for these, and they are clustered towards zero. The vertical height measures the perceived bias of these phrases, and – by design – they are low.Footnote 34 The triangles are for the machine-learning phrases. As Table 2 showed, these generally have the highest CS scores with the corresponding stereotypes. The squares are for the AARP stereotypes, which generally have lower CS scores; there are only three of these plotted because there are only three phrases. Comparing the height of the triangles to the squares, we see that the AARP phrases are generally perceived as more biased, even though the CS scores with the stereotypes are lower.
Scatterplot of self-beliefs of age bias and cosine similarity (CS) scores. (a) Self-beliefs. (b) Others' perceptions. (c) Others' over 50s' perceptions.
Note: CSS, cosine similarity score. Figure plots MTURK respondents' average perceptions of age bias against CSS stereotype ratings from Table 2. Lower numbers on the y-axis indicate higher levels of perceived age bias. Higher CSS scores on the x-axis indicate higher average levels of semantic similarity of a phrase with its respective stereotype. Circular, triangular, and square markers represent control phrases, CSS treatment phrases, and AARP treatment phrases, respectively. Black (solid), blue (shaded), and red (unshaded) markers represent physical, technology, and communication phrases, respectively.

Figures 7b and c show the same kind of evidence of beliefs about others' perceptions in general, and then for others over age 50. The qualitative patterns are the same, but Figures 7b and c, in comparison to Figure 7a, show the stronger perceived bias reported when asked about others' perceptions. This is apparent in Figures 7b and c, for both the machine-learning phrases (triangles) and the AARP phrases (squares); there is no apparent shift for the control phrases. This has an interesting potential implication. If an older job applicant thinks others will perceive job-ad language as more age biased than the individual herself perceives the language as age biased, they might expect less competition from older applicants, which might boost the likelihood the person applies for a job relative to the case where her perceptions were the same as those she ascribes to others. This does not mean the age-stereotyped language will not deter the older applicant from applying for a job, but it does mean that the greater perceived age bias by others may mitigate the effect.Footnote 35
6.1 Assessing actual job ads
To help the reader contextualize our results, we now connect the results to real job ads in a more concrete way. In particular, in Figure 1c, we return to the distributions of CS scores from the job ads, but we overlay, for each of the three stereotypes, the average treatment and control CS scores (for the machine-learning treatments), and we also show the estimated effect of the treatments on perceived ageism. The panels in this figure give a sense of how one might, in principle, relate our results to actual job-ad language in a set of job ads, by showing how our experimental manipulation and the effects of that manipulation are related to a large set of actual job ads. For example, language with CS scores near or above the levels of our experimental treatments could be flagged as potentially indicating discriminatory behavior; and as discussed earlier, our treatment relates to actual and reasonable job-ad language, not extreme phrases that are blatant (and perhaps very unlikely to be used). To be clear, though, we would not advocate for this being viewed as definitive evidence of discrimination, but rather – at most – as a potential indicator for further investigation into actual hiring behavior.
7. Conclusions and discussion
In this paper, we explore whether the type of ageist stereotypes used in job ads is detectable using machine-learning methods and whether this language is perceived as biased against older workers searching for jobs. This is important for three reasons. First, workers may respond to this language, with older workers applying to a narrower set of jobs or perhaps choosing not to apply at all, hence diminishing their job market opportunities. Second, the mechanism we study is plausible, as employers who want to discriminate against older workers but also want to avoid getting caught might manipulate job-ad language to discourage older workers from entering the applicant pool. And third, if ageist job-ad language can be detected by machine-learning methods, then these methods could, in principle, be used to help enforce anti-discrimination laws by helping flag job ads by employers who may be more likely to be engaging in age discrimination.
We use machine-learning methods to identify phrases in job ads that are linguistically related to standard ageist stereotypes from the industrial psychology literature. We use these phrases to construct typical job-ad language that reflects specific age stereotypes. We show that machine-learning methods are sensitive enough to detect the presence of stereotyped language, even when only one sentence in the job ad is highly related to the ageist stereotype. We then conduct an MTURK experiment that asks whether respondents perceive this job-ad language – which the machine-learning algorithm classifies as related to ageist stereotypes – as ageist. We also used some more blatant ageist phrases identified by AARP.
Our experimental evidence shows that sentences that are classified as closely related to ageist stereotypes by the machine-learning algorithm are generally perceived as ageist by respondents in our MTURK experiment (and more so when asked, with incentives, how they will be perceived by others). These results imply that the different age stereotypes we study capture real ageist sentiments and will be perceived as such by job applicants. As such, the use of ageist stereotypes in job ads may discourage older workers from applying for jobs, with similar adverse effects on employment of older workers as direct hiring discrimination by employers.
Although the AARP phrases were perceived as more ageist than those generated by our machine-learning methods, the latter were more directly and more distinctly related to specific ageist stereotypes. This is potentially significant from a policy perspective, as it implies that machine learning can be used to identify ageist stereotypes in job ads that pertain to specific stereotypes. Because the legality of an age stereotype in a job ad might hinge on whether the language pertains to a job requirement based on an RFOA, it is important to be able to ascertain the type of job requirement to which the language might refer. In contrast, the AARP phrases we use, while perceived as more ageist, are harder to tie to specific stereotypes and hence, perhaps, to specific job requirements. This distinction may be useful with regard to the issues of what our evidence implies about underlying behavior and how our evidence might assist in enforcing age discrimination laws. It seems safe to say that job-ad language with the same ageist flavor of the AARP phrases will fairly reliably help to identify employers engaging in illegal age discrimination. In contrast, job-ad language identified by machine-learning methods should be interpreted more cautiously, as it could reflect legitimate job requirements, and may not have as adverse an impact on older workers looking for jobs.
More generally, though, the machine-learning methods could be helpful in flagging potentially discriminatory behavior, providing the EEOC (or state agencies) with an additional tool in identifying potential discriminators, above and beyond current enforcement mechanisms that rely on worker-initiated complaints focused on hiring outcomes. To be sure, language flagged as ageist – especially when not overly blatant – should not be viewed, in and of itself, as indicating age discrimination, because the language could reflect actual job requirements that are correlated with age. Rather, such language could prompt additional statistical investigation, focused on two questions: First, are employers who use such job-ad language less likely to hire older workers who nonetheless apply, which could indicate statistical discrimination based on assumptions that older workers cannot meet the stated job requirements, or simple taste discrimination? Second, are the stated job requirements relevant to the job, or perhaps instead just used to discourage older workers from applying? In addition, this research can help inform EEOC guidance to employers on job-ad language to avoid potential age discrimination.
Supplementary material
The supplementary material for this article can be found at https://doi.org/10.1017/S1474747222000270.
Acknowledgements
This research was supported by the Sloan Foundation. Any views expressed are our own and not those of the Sloan Foundation. This experiment was approved by the UCI Institutional Review Board, HS# 2015-2107. We are very grateful for helpful comments from Thiemo Fester, Joanna Lahey, and Andrea Tesei.


 Open access