





Introduction
When acquiring word-meaning mappings, children are faced with a large hypothesis space (Quine, Reference Quine1960). One way to navigate this space to find successful mappings is to reduce the number of hypotheses. For instance, there are suggestions in the literature that children’s word-meaning mappings might follow a systematic set of (pre-conceived or learned) constraints, such as the whole-object bias and the mutual exclusivity bias (e.g. Regier, Reference Regier2003).
A related problem is that children must acquire spoken language from continuous speech (Cutler, Reference Cutler2012), which adds another layer of complexity to the word learning task. However, this problem can be addressed by paying attention to available regularities. For example, across many languages the speech directed to children contains many useful prosodic markers, including variation in pitch, longer vowels, lower tempo and longer pauses (Fernald, Reference Fernald1985). Experimental studies suggest that these cues facilitate learning the meaning of words when presented within sentences (Ma et al., Reference Ma, Golinkoff, Houston and Hirsh-Pasek2011, Reference Ma, Fiveash, Margulis, Behrend and Thompson2020).
Regularities in the input language are also present at the lexical level: word tokens are not randomly distributed. Rather, words differ in their frequency, and show marked tendencies of co-occurrence with other words, or even with extra-linguistic information that may be present during the communicative act. From a very young age, human learners are capable of tracking co-occurrence information in the speech signal, a mechanism often referred to as Statistical Learning (Saffran et al., Reference Saffran, Aslin and Newport1996). This capacity does not seem to be limited to the short exposure of experimental settings: in fact, children can keep track of information (both from linguistic input and extra-linguistic environment) across separate linguistic experiences via cross-situational learning (Smith & Yu, Reference Smith and Yu2008; Yu & Ballard, Reference Yu and Ballard2007).
Children’s sensitivity to distributional information can constitute a powerful mechanism to derive word-meaning mappings from the linguistic input, in particular when we consider that a word’s distributional context (i.e., other words or morphemes occurring around it in a sentence) contributes significantly to its meaning (Harris, Reference Harris1954). For instance, while we may be unaware of the meaning of bardiwac if we encounter the word in isolation, its meaning can be deduced (or, at least, substantially constrained) when it occurs in a sentence like If I drink too much bardiwac I get drunk (Evert, Reference Evert2010). Thus, a potentially fruitful acquisition strategy would be to attend to word co-occurrence, as embodied in the famous quote You shall know a word by the company it keeps (Firth, Reference Firth1957).
In the current paper we discuss computational modelling work investigating whether, and under what conditions, a word’s context contributes to vocabulary acquisition. For instance, does the fact that drink appears often in the context of milk help children learn how to use the word milk? And if so, how far apart in the sentence can words yet still have this effect? And does this change depending on the syntactic category of the word?
We begin with the basic assumption that words that share contexts can be arranged in networks, such that words are connected if they are contextually related – which, assuming the distributional hypothesis mentioned above (Firth, Reference Firth1957; Harris, Reference Harris1954), would also be semantically related. This network construct is gaining traction in computational studies of cognition (Kenett & Hills, Reference Kenett and Hills2022) and language in particular (Cancho & Solé, Reference Cancho and Solé2001), including vocabulary acquisition (Steyvers & Tenenbaum, Reference Steyvers and Tenenbaum2005; Hills et al., Reference Hills, Maouene, Riordan and Smith2010; Roy et al., Reference Roy, Frank, DeCamp, Miller and Roy2015; T. A. Chang & Bergen, Reference Chang and Bergen2022; Grimm et al., Reference Grimm, Cassani, Gillis and Daelemans2017; Stella et al., Reference Stella, Beckage and Brede2017). Interestingly, in the related field of Computational Linguistics and Natural Language Processing the estimation of semantic relations from contextual information is one of the most extensively studied tasks, in particular with Vector Space Models (VSMs), which compute continuous vector-based word representations from distributional information gathered across corpora. While these methods were not originally devised to account for human learning, a substantial amount of work has been dedicated to finding how to exploit context to obtain word representations that best encode their semantic properties. Thus, these models are promising candidate models for investigations of how word learning in children can be supported by contextual information. This is the approach we take here.
To evaluate our models (i.e., to determine whether the semantic representations extracted by VSM models can predict vocabulary acquisition in children), we used Age of Acquisition (AoA) data, estimated from MacArthur-Bates Communicative Development Inventory forms (CDIs). A growing body of work has focused on the use of CDI data to predict vocabulary growth in multiple languages (Frank et al., Reference Frank, Braginsky, Yurovsky and Marchman2017, Reference Frank, Braginsky, Yurovsky and Marchman2021). In addition, CDI data are known to correlate highly with other estimations of children’s vocabulary, with good reliability and validity (Fenson et al., Reference Fenson, Marchman, Thal, Dale, Reznick and Bates2007).
In the remainder of this paper, we review computational work that has used semantic networks to study vocabulary growth. We then present VSMs as an alternative approach to construct such networks to investigate word learning in children. Through a series of studies, we use VSMs trained on child-directed speech to investigate which distributional properties of the input (e.g. amount of context, word frequency) best explain the acquisition of nouns and verbs, as observed in the CDI data.
Background
Semantic networks
This section reviews past research that has investigated how contextual information of words in child-directed speech may support word learning. The papers we review have proposed some metric to quantify the degree of connectivity of a word in a semantic network, such that words which are connected become semantic neighbours. The construction of these semantic networks differs greatly; however, all the work we describe uses some notion of a word’s context to derive these networks, as observed in child-directed input.Footnote 1
Hills et al. (Reference Hills, Maouene, Riordan and Smith2010) investigated how word learning can be predicted from a semantic network derived from words in child-directed speech. The authors hypothesized that these semantic relations can be approximated as a function of word co-occurrence, such that all the words that have co-occurred at least once in child-directed input are connected in an unweighted graph. The cognitive implication of this design is that children are sensitive to word co-occurrence, and use it to derive the semantic relatedness between words (such that words that co-occur are semantically related). The study related these semantic networks to a measure of Age of Acquisition (AoA) of words, and found that contextually diverse words (i.e., words with more connections to other words in the semantic networks) were acquired earlier than words with fewer connections. However, note that the frequency with which co-occurrence happens does not play a role in this study, such that words that co-occur once are equally related to words that co-occur often, which may not be a plausible assumption (see Ambridge et al., Reference Ambridge, Kidd, Rowland and Theakston2015).
A related study (Roy et al., Reference Roy, Frank, DeCamp, Miller and Roy2015) defined the notion of a word’s context more broadly, to include also extra-linguistic elements like the location and time of where and when a word was produced. Unlike the study by Hills et al. (Reference Hills, Maouene, Riordan and Smith2010), the linguistic context of a word was modelled in terms of a word’s topic distribution, which was extracted using Latent Dirichlet Allocation (LDA) (Blei et al., Reference Blei, Ng and Jordan2003). The authors quantified the distinctiveness of a word, measuring how much its context distribution deviated from a baseline distribution of general language use. For instance (borrowing the example provided in the original paper): a word like “with” has less distinctiveness than a word like “fish” or “kick”. The study concluded that distinctiveness is helpful for acquisition (although more so for extra-linguistic rather than linguistic context). One may tentatively conclude that these results are at odds with those of Hills et al. (Reference Hills, Maouene, Riordan and Smith2010), since words with more distinctive linguistic context may, a priori, have fewer semantic neighbours (and therefore less contextual diversity). However, the exact relation between those metrics has not been worked out, and there are notable differences in the methods to extract linguistic context (note that LDA is sensitive to frequency of word co-occurrence within a certain span, which in this work was set to 10 minutes). Thus, differences in the formalization of these measures are likely to have contributed to, if not caused, the apparently different results between the two studies.
Most recently, T. A. Chang and Bergen (Reference Chang and Bergen2022) reported results that directly contradicted those of Hills et al. (Reference Hills, Maouene, Riordan and Smith2010), in this case using an equivalent estimation of contextual diversity. This work extended the statistical analyses of the original study and used a cross-linguistic data set, which included data from four other languages as well as English. The study concluded that contextual diversity of a word hinders, rather than helps, its acquisition.
Stella et al. (Reference Stella, Beckage and Brede2017) studied whether free association norms and semantic feature sharing influence acquisition, in addition to word co-occurrence and phonological similarity. The authors created networks with these different types of information, and found that all of these are fundamental to word learning, although the relative influence of each changed across developmental time, with free association norms being more influential after the age of 23 months. Free association norms and phonological similarity were also used in Fourtassi et al. (Reference Fourtassi, Bian and Frank2020), this time also for 9 languages other than English. The authors reported that, even after controlling for frequency and word length, higher connectivity (i.e., greater contextual diversity) facilitated acquisition.
The work we have reviewed so far assumes that all the linguistic input of caretakers can be used equally for word learning. Grimm et al. (Reference Grimm, Cassani, Gillis and Daelemans2017) present an alternative view which suggests that word learning only takes place after the acquisition of larger multi-word representations, which in turn facilitate the acquisition of single words. According to this premise, the context that effectively influences word learning should be derived from the previously acquired multi-word representations, rather than from the entirety of the raw parental input. To model this idea, the authors used a cognitive model (a modified version of the Chunk-Based Learner, McCauley et al., Reference McCauley, Monaghan and Christiansen2015) to simulate learning of multi-word units from parental input, which was then used to generate the contexts for the network analysis. With this estimation, the authors also found that contextual diversity positively influenced vocabulary acquisition.
Overall, the past work shows that, despite differences in definition of the core construct, contextual diversity influences vocabulary acquisition. However, the direction of the effect is extremely sensitive to different operationalisations of the concept. Thus, more work needs to be done to determine the best way to operationalise contextual diversity in order to accurately capture order of acquisition in children’s vocabulary learning. This is the goal of the current paper.
Vector space models
In our work, we build semantic networks using VSMs in order to study lexical acquisition from linguistic context. These models have a long tradition in the Computational Linguistics and Natural Language Processing literature (Turney & Pantel, Reference Turney and Pantel2010), where they have been used to derive word representations that can capture semantic relations between words, as we describe next. Thus, they are promising candidates for modelling the role of contextual diversity on children’s word learning.
VSMs represent lexical meaning in terms of distributional information, based on the hypothesis that the (lexical) context of a word provides relevant information about its meaning (Harris, Reference Harris1954). Trained over corpora of linguistic productions, the models implement this idea by computing a vector-based word representation that aggregates information about the contexts in which a word appears. Models differ on details of how the vector word representations are constructed, but all the variants are computed in a way such that the dimensions in these vectors preserve information derived from the context in which a word appeared in the training data (see Table 1 for an illustrative example).
Toy example of a matrix of co-occurrence counts, for a corpus featuring 2 sentences, and a window size of 2. The rows (or columns) corresponding to each word can be used as the vector representation for this word. Each model uses these vectors differently: (a) Hills et al. transform the vectors such that any number higher than 1 is transformed to 1; (b) count-based models start with vectors of co-occurrence like the ones in our example and (in most cases) transform them, often to reduce the amount of zeros and the number of dimensions (in our work, we do this with PPMI and SVD); (c) prediction-based models disregard these counts and estimate similar word vectors using neural networks.

My cat eats tuna every Monday.
Next Monday my cat will eat tuna.
Because the models represent words as vectors, it is possible to compute the semantic relation between two words by using similarity metrics for their corresponding vectors (often quantified as cosine similarity, i.e., the cosine of the angle formed by the vectors when projected in multidimensional space). These models have been shown to successfully predict adult human behavior in a range of semantic tasks, such as free word association, synonym tests, similarity ratings, and analogy problems (Baroni et al., Reference Baroni, Dinu and Kruszewski2014; Levy et al., Reference Levy, Goldberg and Dagan2015; Mandera et al., Reference Mandera, Keuleers and Brysbaert2017; Pereira et al., Reference Pereira, Gershman, Ritter and Botvinick2016).
We argue that VSMs have advantages compared to the methods used in previous approaches. First, these models go beyond co-occurrence counting and use well-studied techniques to transform, compress and automatically learn the word vectors that best encode semantic relations. Second, the semantic distance estimated by these models is continuous and bounded: it conveys more information than the unweighted semantic networks proposed in prior work, and we can search for an optimal threshold to decide which words should be connected. Third, these models have more sensitivity to frequency of co-occurrence, in particular compared to some of the semantic networks that have been proposed (in which frequency of co-occurrence is binarized, such that words are considered only to either co-occur or not). This allows us to investigate the role that frequency of co-occurrence may play in acquisition. In sum, given that the method of estimation of contextual diversity has great influence on the prediction of age of acquisition (as shown by the divergence of results in prior work), the use of these models allows us to study how distributional information contributes to vocabulary acquisition using a more fine-grained approach.
The present studies
We approach the study of how contextual information contributes to vocabulary acquisition with three studies.
The goal of Study 1 is to study the effect of different modelling approaches (content-counting and context-predicting, as will be explained later) and different modelling choices (or hyperparameters) in predicting the age of acquisition of nouns and verbs in English. The hyperparameters regulate distributional properties available to the models, such as the amount of context that influences a word’s representation (i.e., how close in the sentence a context word needs to be to affect word acquisition), and the minimum frequency with which words have to occur to become part of the computation and influence the representation of other words. Hence, by analyzing how these modeling choices predict vocabulary growth, we gain insight into how context influences word learning.
The models used in Study 1 are driven primarily by frequency of co-occurrence. However, frequency of co-occurrence is affected by word frequency as well. Therefore, it is plausible that word frequency has an indirect effect on the semantic spaces built with these models (i.e., more frequent words may tend to have different number of neighbours than less frequent words). Since we know that frequency plays an important part in word acquisition (Ambridge et al., Reference Ambridge, Kidd, Rowland and Theakston2015), it is relevant to disentangle whether frequent words have a differentiated status in the semantic spaces. This is the goal of Study 2.
Finally, in Study 3 we revisit prior work and compare our findings to previous studies, specifically addressing the relation between the semantic networks that we have built using VSMs and those used before.
Methods
Models
Alhama et al. (Reference Alhama, Rowland and Kidd2020) proposed methods to evaluate how well vector-based word representations computed with VSMs can be related to children’s emerging semantic networks. To this aim, the authors optimized a threshold parameter to establish connections in a semantic network based on semantic (cosine) distance in those models, and used a metric of contextual diversity (called neighbourhood density) to predict Age of Acquisition (AoA) data. This work established the validity of the approach of estimating semantic networks through threshold optimization in VSM models to predict Age of Acquisition data, providing a basis for the work we present here.
In our work, we focus on the bag-of-words approach to VSMs, according to which context words are indistinguishable in terms of their position in the sentence. For example, in the sentence She likes cats, the words she and cats have the same influence on the representation of likes. Thus, these models do not assume knowledge of the exact position of a word in a sentence (i.e., does not assume grammatical knowledge).
We use models that derive a vector representation for each word type, based on aggregated information about the context of each word tokenFootnote 2. There are two main approaches, which are known as count-based and prediction-based (Baroni et al., Reference Baroni, Dinu and Kruszewski2014). The difference between these models is in the steps followed to build the word representations. Context-counting models gather co-occurrence counts between word types in one pass over the input data, and arrange those counts into vectors. These vectors are then further transformed with mathematical operations that improve these representations. Context-predicting models, instead, start with random vectors for each word, which are adjusted iteratively with a neural network. The network learns through an error-driven algorithm: the (randomly initialized) vectors of each word are used to predict the accompanying words in the input sentences. In this way, word types that appear in similar contexts end up being represented with similar vectors (since a similar representation will be useful to predict the similar contexts).
Algorithmically, these approaches clearly differ in the steps performed on the input data (see Figure 1). Context-counting models are applied over aggregated data (i.e., once all the counts have been gathered), and are normally exact (repeated applications of the models derive the same vectors). Context-predicting models, instead, use neural network models to process the data incrementally (for every word-context pair), over many repetitions, and gradually adjust the learnt vectors representations. Thus, a priori, context-predicting models are more readily interpretable as accounts of cognitive processes, given their incremental nature and the fact that they use a general neural network approach, which is consistent with connectionist approaches to cognitive modelling (McClelland, Reference McClelland1995). It must be noted, however, that authors have derived mathematical connections between these two approaches, suggesting that the context-predicting model we use (Skipgram) implicitly (Levy & Goldberg, Reference Levy and Goldberg2014) or explicitly (Li et al., Reference Li, Xu, Tian, Jiang, Zhong and Chen2015) factorizes a count-based matrix. Nevertheless, we find value in comparing both modeling approaches because they have showed different performance in multiple studies (Baroni et al., Reference Baroni, Dinu and Kruszewski2014; Mandera et al., Reference Mandera, Keuleers and Brysbaert2017; Pereira et al., Reference Pereira, Gershman, Ritter and Botvinick2016), likely due to hyperparameter configurations which may favour each model differently, and possibly the fact that the objective function in Skipgram prioritizes learning from frequent over infrequent word-context pairs (Levy & Goldberg, Reference Levy and Goldberg2014). The latter adds an additional level of interest to our analysis.
Graphical representation of how context is incorporated in context-counting (top) and context-predicting (bottom) models. While in context-counting models each co-occuring word is incorporated with raw counts (which can be weighted later), context-predicting models use a neural network to derive vector representations that are useful for prediction.

We implemented the models as follows:
-
• Count-based model: First, we gathered the co-occurrence counts between words and contexts (i.e., other words with which a target word co-occurs, given a certain window size) in child-directed language corpora (see Data). These were arranged in a matrix of counts in which the dimensions were words and contexts. We then transformed these raw counts with Positive Pointwise Mutual Information (PPMI) and compressed the resulting vectors using Singular Value Decomposition (SVD), a procedure that identifies the most relevant dimensions in the word-context matrixFootnote 3. Concretely, SVD factorizes the matrix above into three matrices $ U\Sigma {V}^T $
, where
$ \Sigma $
is a diagonal matrix of singular values, and
$ U $
and
$ V $
are orthonormal matrices.
$ U\Sigma {V}^T $
, where
$ \Sigma $
is a diagonal matrix of singular values, and
$ U $
and
$ V $
are orthonormal matrices. -
• Prediction-based model (Skipgram): As a context-predicting model we used the Skipgram version of word2vec (Mikolov et al., Reference Mikolov, Sutskever, Chen, Corrado and Dean2013). This model is trained to learn word representations that encode useful properties to predict which context words appear within a specified window around the target word. This is done by incrementally presenting the network with word-context pairs and adjusting the weights based on the prediction error.


Data
We trained the models on transcriptions of English child-directed speech from CHILDES (MacWhinney, Reference MacWhinney2000), including data from all the available English variants, for children aged from 0 to 60 months. We extracted child-directed utterances with the childesr library (Sanchez et al., Reference Sanchez, Meylan, Braginsky, McDonald, Yurovsky and Frank2019)Footnote 4. Word tokens were coded at the lemma level. The resulting data set contains a total number of 34,961 word types, and 12,975,520 word tokens.
To test the models, we used data collected with the MacArthur-Bates Communicative Development Inventory forms (CDI). These are parent report forms that collect information about the number of gestures and words known/produced, and the extent of morphosyntactic knowledge, of children at different ages, and thus can be used to estimate the Age of Acquisition (AoA) of words. To estimate AoA we used all the variants of English ‘Words & Sentences’ CDIs (from children aged 16-30M) from the Wordbank database (Frank et al., Reference Frank, Braginsky, Yurovsky and Marchman2017), which includes data from 1000s of English-learning children. (We excluded the data from twins, as significant differences have been observed in the language development of twins and singletons; see Rutter et al., Reference Rutter, Thorpe, Greenwood, Northstone and Golding2003).
We computed the AoA of a word using the $ R $
method provided in Wordbank, where AoA is defined as the age at which 50% of the children in the sample understood or produced a given word. Our analyses of the relationship between distributional learning and vocabulary acquisition focus on production, since comprehension data is not available for all Wordbank corpora. Note that children typically understand more words than they can produce, and so AoA based on production data from Wordbank will in almost every case be older than AoA based on comprehension data.
$ R $
method provided in Wordbank, where AoA is defined as the age at which 50% of the children in the sample understood or produced a given word. Our analyses of the relationship between distributional learning and vocabulary acquisition focus on production, since comprehension data is not available for all Wordbank corpora. Note that children typically understand more words than they can produce, and so AoA based on production data from Wordbank will in almost every case be older than AoA based on comprehension data.
We focus on the AoA of nouns and verbs, which are among the first categories learnt by children. We decide to study them separately rather than together because they show notably different learning patterns: nouns are consistently found to be acquired earlier across a range of languages (McDonough et al., Reference McDonough, Song, Hirsh-Pasek, Golinkoff and Lannon2011). This has led to arguments in favour of different mechanisms for the acquisition of words in each of these categories, based on the fact that nouns in children’s lexicons tend to refer to static, often observable, entities, while verbs describe actions, most of which have a fleeting, dynamic nature (Golinkoff et al., Reference Golinkoff, Chung, Hirsh-Pasek, Liu, Bertenthal, Brand, Maguire and Hennon2002). It is therefore relevant to our study to analyze whether our models fare well for both syntactic categories.
Study 1: How much context?
Our first goal was to determine the extent to which the context of a word is relevant to its acquisition. To do so, we ran simulations with different hyperparameter configurations that regulate the amount of context available to the model, and we evaluated how well those configurations predicted the AoA data. Note that our goal was not to fine-tune the models but to observe the general effect of different hyperparameter choices; in particular, for those that regulate the amount of context provided to the model.
In VSMs, the relations between words are studied in terms of their geometric distance in semantic space. To cast this continuous space into a network representation (in which words are either connected or not), we established a threshold, such that only words with a distance smaller than the threshold (or, mathematically, words for which the ‘cosine similarity’ $ \theta $
is larger than the threshold) are connected. We then computed, for each word, the number of connections with other words (see Figure 2 for an illustrative example). As in prior work (Alhama et al., Reference Alhama, Rowland and Kidd2020), we call this index (semantic) neighbourhood density, to distinguish it from other approaches to contextual diversity. For reasons of space, we report results for
$ \theta $
is larger than the threshold) are connected. We then computed, for each word, the number of connections with other words (see Figure 2 for an illustrative example). As in prior work (Alhama et al., Reference Alhama, Rowland and Kidd2020), we call this index (semantic) neighbourhood density, to distinguish it from other approaches to contextual diversity. For reasons of space, we report results for $ \theta =0.7 $
, but we observed equivalent tendencies for other values of this parameter, with only small deviations for the thresholds with extreme values.
$ \theta =0.7 $
, but we observed equivalent tendencies for other values of this parameter, with only small deviations for the thresholds with extreme values.
Toy example of a semantic network, with annotated neighbourhood density.

The hyperparameters that we analyze in this study are described below. We fixed the values of the other hyperparameters to common default valuesFootnote 5 , Footnote 6.
-
• Window size (win): defined as the number of context words on each side of a target word. In a context-counting model, a window of size
$ n $
computes co-occurrences for the
$ n $
words occurring on the left and for the
$ n $
words occurring on the right of a word. In Skipgram, win determines the word-context pairs on which the network is trained.Footnote
7 We explore values 1, 2, 3, 5 and 10. -
• Dynamic window size (dyn): when enabled, the window size is dynamic, such that for each occurrence of a target word, the window size is sampled between 1 and win. It has no practical effect when win=1.
-
• Frequency threshold (thr): minimum frequency that words should have to be part of the computation. Words with frequency of occurrence below this threshold are removed, and therefore do not influence other words, and do not have any representation (they are simply not part of the vocabulary). Note that this is done after determining the context windows, and the filtered words are not replaced. For example, take the sentence For whom the bell tolls, for a window size of 1, and frequency threshold set to 50 occurrences of a word type. When deriving the representation of the word bell, the model checks if the and tolls, which are part of the context given the window size of 1, meet this minimum frequency criterion. If, for example, the frequency of tolls is below the threshold, then the effective context of bell in this sentence is only the. Thus this has an effect on the context available to a wordFootnote 8. We explore values 10, 50 and 100.


We first focused on the acquisition of nouns. The simulations for the count-based models can be seen in Figure 3, which shows the size of the correlations between AoA and neighbourhood density for each model configuration. As can be seen, the correlations are low: most points gravitate around 0, and even the best model (win=1, thr=10) yields only a small effect size ( $ r=-0.177 $
). These results suggest that the neighbourhood density metric computed with this model is unlikely to provide a good fit to the AoA data.
$ r=-0.177 $
). These results suggest that the neighbourhood density metric computed with this model is unlikely to provide a good fit to the AoA data.
Correlation between AoA and neighbourhood density computed with count-based models, for nouns. In the legend, thr stands for threshold, and dyn is dynamic window size.

Figure 4 shows the corresponding results for the prediction-based Skipgram models. The pattern of results is clearer and completely different from that of the count-based model. Notably, even the worst-performing configuration of this model performs better in this metric than the best-performing configuration of the count-based model. Results suggest that words acquired earlier by children are those that have fewer semantic neighbours within this model, as evidenced by the clear pattern of positive correlations. This has interesting implications for language acquisition, as we discuss later.
Correlation AoA and neighbourhood density in prediction-based models (Skipgram), for nouns. In the legend, thr stands for threshold, and dyn is dynamic window size.
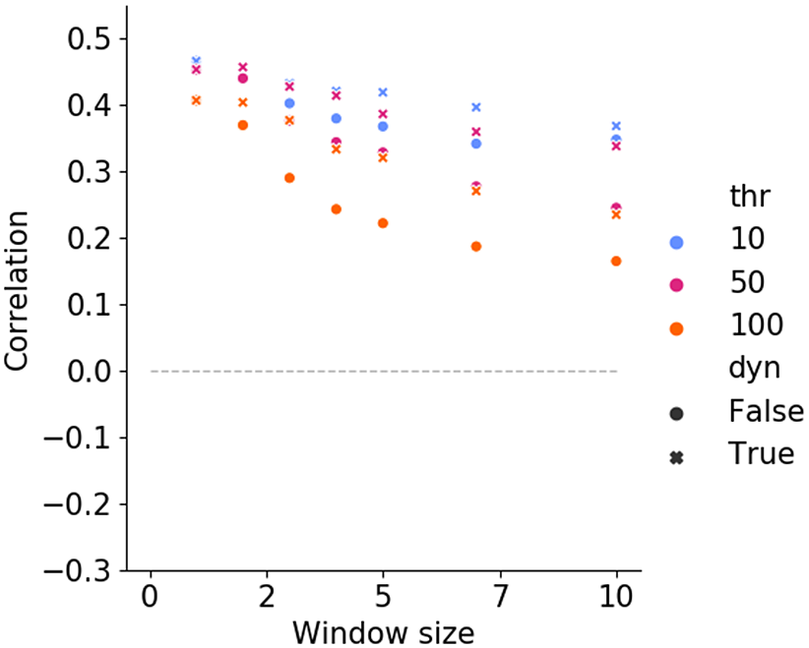
A very clear trend can be noticed for the window size: given the same value of dyn and thr (i.e., for the same shape and colour in the graph), a smaller window size predicts a larger correlation. This suggests that, if children use context in this manner to shape semantic representations, the window size for its computation may be small. Not surprisingly, the use of dynamic windows increases the fit (relative to the same fixed window size), since it decreases the amount of context available to a number of words; nevertheless, the minimum window size of 1 still performed better. We found that a small frequency threshold (thr=10) improves performance, indicating that children are sensitive to words with relatively small frequency, which have a role in shaping the semantic connectionsFootnote 9. Thus, the results suggest that a prediction-based approach like Skipgram holds promise for modelling word learning, with the best model (win=1, thr=10) having a medium effect size of 0.47.
In order to determine whether the good fit of the Skipgram model to nouns also extends to other syntactic categories, we evaluated its performance against the AoA of verbs. As can be seen in Figure 5, the model shows a similar trend as for nouns, albeit with smaller effect sizes. One notable difference, however, is that models which are sensitive to lower frequencies (in particular, thr=10, which was the best-performing value for nouns) do not have the same strong tendency for performance to decrease with window size, i.e., further context is not as unhelpful as in the case of nouns. In the case of dynamic windows, the differences in performance are actually quite small up to window size 5. It appears then that the context that is further from a window of 1 is only detrimental when considered for every word, but less so when its incorporation is only occasional. We return to this in the Discussion.
Correlation between AoA and neighbourhood density in prediction-based models (Skipgram), for verbs. In the legend, thr stands for threshold, and dyn is dynamic window size.

Study 2: Frequency and Semantic Networks
The models we have been working with are optimized for exploiting co-occurrences of words and contexts. Another distributional aspect of the input that is a good predictor of AoA is (log-transformed) word frequency (i.e., the number of times a word has appeared in the input, Ambridge et al., Reference Ambridge, Kidd, Rowland and Theakston2015). For the data we used, we found that correlation between AoA and log-transformed frequency was -0.32 ( $ p< $
0.001) for nouns and -0.14 (
$ p< $
0.001) for nouns and -0.14 ( $ p= $
0.14) for verbs. This is a significant correlation for nouns. Thus, any model of word learning must eventually formalize what role frequency plays in the acquisition process (at least for nouns). For instance, frequency may provide more opportunities to refine the phonetic representation of the word, or the repeated activation of this representation may result in easier retrieval. Here, we investigate whether word frequency plays a role in shaping the network of semantic associations derived from linguistic context.
$ p= $
0.14) for verbs. This is a significant correlation for nouns. Thus, any model of word learning must eventually formalize what role frequency plays in the acquisition process (at least for nouns). For instance, frequency may provide more opportunities to refine the phonetic representation of the word, or the repeated activation of this representation may result in easier retrieval. Here, we investigate whether word frequency plays a role in shaping the network of semantic associations derived from linguistic context.
To investigate this, we correlated log-transformed frequency with neighbourhood density in the best-performing hyperparameter configurations of the models from Study 1. Table 2 shows that correlations are negative and large for Skipgram (nouns) and negative and small to moderate for Skipgram (verbs). This suggests that, with this model, high frequency words end up in less dense neighbourhoods. In the case of the count-based model, the correlations are small and positive for both nouns and verbs. Thus, there is a tendency for higher frequency words to end up in densely populated spaces. One possible interpretation of the divergent results across the two types of model is that Skipgram is factoring in word frequency information, and thus the more occurrences a word has, the more semantically distinguishable it becomes from other competing words.
Correlation between log-transformed word frequency and neighbourhood density

In Study 3 we establish how our work relates to prior work, in particular to the formalization of contextual diversity presented in Hills et al. (Reference Hills, Maouene, Riordan and Smith2010). To see the extent to which we can replicate previous findings with our data, we first computed contextual diversity in our input data, and correlated it with AoA from our evaluation data. Next, we established how our measure (neighbourhood density estimated with Skipgram) correlated with (log-transformed) contextual diversity as defined in Hills et al. (Reference Hills, Maouene, Riordan and Smith2010).
Hills et al. estimated the contextual diversity of a word as follows: given the child-directed speech utterances in CHILDES (from ages 12 to 60 months), and variations in window size, the authors gathered co-occurrence counts (like in the first step of our context-counting model), and then converted all the counts that are different from 0 into 1. Thus, the co-occurrence matrix only had values of 0 (for words that never appear together in the corpus) and 1 (for all the words that have co-occurred at least once). This matrix was then collapsed into one column: all the entries in each row were summed, to obtain the number of different contexts of each word. The log-transformed contextual diversity of each word was then correlated with the AoA norms from Dale and Fenson (Reference Dale and Fenson1996).
We implemented the contextual diversity measure and applied it to our data. The input data in both studies differed only slightly: we used a larger part of the CHILDES English corpus (ages 0 to 60 months, where Hills et al. used 12 to 60). Both studies used the lemma of each word. When it comes to the evaluation data, both studies estimated AoA of words, but used data from different sources: Hills et al. used the norms in Dale & Fenson, Reference Dale and Fenson1996, while we used the CDI data from Wordbank. Our measure of AoA was estimated in the same way as the AoA reported by Hills et al. (as the first month in which at least 50% of the children produced a word).
Table 3 shows the results of correlations between AoA and contextual diversity that were reported by Hills et al., and from the present study, both using Hills et al.’s measure of contextual diversity and AoA estimation Footnote 10. As can be seen, the correlation between contextual diversity and AoA that we find in our replication is smaller than that reported in Hills et al. We assume this is due to the fact that there are differences in the dataset that we use; in particular, the CDI dataset is larger in our case, which, we expect, provides a better estimation.Footnote 11
Correlation (Pearson’s $ r $
) between AoA and log-transformed contextual diversity
$ r $
) between AoA and log-transformed contextual diversity

Study 3: Comparison with Contextual Diversity
Setting aside the difference in magnitude, the correlations are in the same direction (negative), and the correlations were stronger for nouns than for verbs. Thus, consistent with the work by Hills et al., the negative direction indicates that contextual diversity (as defined by Hills et al.) facilitates rather than impedes acquisition.
Note that, according to its definition, contextual diversity is a form of ‘type co-occurrence’, as it indicates how many different words appear in the context of one word, regardless of how many times they do so. In contrast, the models we are working with take the frequency of co-occurrence into account, either explicitly (for the count-based models) or implicitly (for the prediction-based models). In order to see how contextual diversity (as defined in Hills et al., Reference Hills, Maouene, Riordan and Smith2010) relates to the neighbourhood density that we compute with our models, we ran an additional study.
We correlated contextual diversity (log-transformed, as used in the original study) of each word with the neighbourhood density of each word, computed with our models (concretely, with the best hyperparameter configurations of both models). Results can be seen in Table 4. We found a large negative correlation for nouns in Skipgram, which suggests a very strong tendency for nouns to be projected into spaces with fewer neighbours when their contextual profile is more diverse. The direction of the correlation is the same for verbs, although much smaller. The count-based model shows almost no correlation.
Correlation (Pearson’s $ r $
;
$ r $
; $ p $
-values in brackets) between neighbourhood density in the best model configurations and log-transformed contextual diversity
$ p $
-values in brackets) between neighbourhood density in the best model configurations and log-transformed contextual diversity

With this study we have seen that the original study of Hills et al. (Reference Hills, Maouene, Riordan and Smith2010) may have slightly overestimated the effect of contextual diversity, since the strength of its correlation with AoA data became smaller when using our data (and also in line with later work, Jiménez & Hills, Reference Jiménez and Hills2022). The direction of the correlation remains, indicating that we still find the same qualitative effect, albeit weaker than anticipated (and weaker than the correlation of our own metric with the same data, as shown in Study 1). When looking at how contextual diversity correlated with neighbourhood density computed with our models, we found that there is a strong negative correlation for nouns, suggesting that these two measures are capturing a related phenomenon.
Discussion
We have used VSM models to study vocabulary acquisition in English. Our first step was to determine if the selected modelling approaches were suited to predict AoA, and which hyperparameters (amount of context and minimum word frequency) best explained the data. We found that neighbourhood density does hold promise to predict vocabulary acquisition when the estimation model is the prediction-based Skipgram model (but not so for the count-based SVD model, at least for our configurations). The best-performing model used a very local context (only a window of 1 word), and required a very low frequency threshold (thr=10). The medium-sized positive correlation with AoA suggests that the words (in particular, nouns and verbs) that are learnt earlier are those with fewer semantic neighbours, as suggested by some of the prior work (Roy et al., Reference Roy, Frank, DeCamp, Miller and Roy2015; T. A. Chang & Bergen, Reference Chang and Bergen2022) but not others (Hills et al., Reference Hills, Maouene, Riordan and Smith2010; Stella et al., Reference Stella, Beckage and Brede2017; Fourtassi, Reference Fourtassi2020; Grimm et al., Reference Grimm, Cassani, Gillis and Daelemans2017). Overall, the results from these simulations suggest that restricting the influence of context to a very small window size leads to a better fit, and that words with low frequency are relevant to shape the semantic space.
Consistent with the results of our second study – which explored the influence of word frequency in building semantic associations –, the better fit of Skipgram may indicate a prominent role for the flexibility of the algorithm in treating word-context pairs differently depending on their frequency. Frequency of co-occurrence underlies word frequency, which is known to be a reliable predictor of AoA (Ambridge et al., Reference Ambridge, Kidd, Rowland and Theakston2015). However, frequency (for words or for co-occurrences) is not a mechanism in itself: a model of word learning needs to specify how frequency influences learning. Put together, our findings for Studies 1 and 2 indicate that words with fewer semantic neighbours are acquired earlier, and frequent words tend to have fewer semantic neighbours, thus suggesting a possible explanation for why frequency is a good predictor of AoA: more occurrences of a word create more opportunities for variability, which is reflected in a more distinct semantic profile, and hence fewer competitors. Functionally, this means that early acquired words are both frequent and functionally unique – that is, early acquired words develop their own communicatively important niche in the system, in line with the hypothesis explored in Roy et al. (Reference Roy, Frank, DeCamp, Miller and Roy2015).
The results suggest that children may attend to very local context: the window size that best fits the AoA data is very small (win=1), at least at an early age. Such a result makes intuitive sense in the context of children’s small verbal memory spans, which only improve as they acquire more language (Elman, Reference Elman1993). Perhaps surprisingly then, the Skipgram model with dynamic window size sampling did not improve the fit (unless compared to a model of the same fixed window size): even the occasional incorporation of more distant context words was detrimental. However, our current set of simulations did not investigate whether the optimum window size changes with age. When fitting similarity and analogy scores provided by adults, the Skipgram model performs best with window sizes that range from 2 to 10 (e.g. Levy et al., Reference Levy, Goldberg and Dagan2015). Although the tasks differ, a tentative implication is that children may learn to use larger context windows over time to reach adult performance.
Previous work suggests that the effect of distributional information in AoA varies depending on the lexical category (Goodman et al., Reference Goodman, Dale and Li2008; Braginsky et al., Reference Braginsky, Yurovsky, Marchman and Frank2019). Perhaps unsurprisingly then, we saw that the pattern of results of Skipgram with nouns is to some extent replicated for verbs, although with relevant differences. A dynamic window with a maximum size of 5 can provide a similarly good fit to the data (provided we kept a low frequency threshold of 10). One potential interpretation is that larger windows allow the model to reach distant content that may include a verb’s arguments, which is likely a helpful source of information about verb meaning (Gleitman, Reference Gleitman1990). Thus, one feature that may contribute to the comparatively late acquisition of verbs compared to nouns is the need for greater linguistic context, although more simulations are needed to flesh out how (in particular, simulations with adaptive window size that depend on age and/or syntactic category). The requirement for a low frequency threshold is stricter than in the case of nouns, meaning that lower frequency words are even more relevant to the acquisition of verbs than they are for nouns. This outcome is in line with Braginsky et al. (Reference Braginsky, Yurovsky, Marchman and Frank2019), who find that word frequency is more relevant for the acquisition of predicates (a class including verbs, adjectives and adverbs) than for nouns.
Some final issues deserve mention. First, we investigated the relation between our metric (neighbourhood density, as estimated with VSMs) and contextual diversity as defined in Hills et al. (i.e., the number of different types it co-occurs with, regardless of the frequency of co-occurrence). The two models fundamentally agree in the direction of the effect, even though we find a larger effect size with our model. Our study indicates that contextually diverse nouns (which are those that have more connections in semantic networks estimated with that measure) tend to have fewer semantic neighbours in our model, tentatively suggesting that having fewer semantic competitors facilitates the acquisition of a word.
Second, our simulations were limited to English. This was largely a practical decision: the English data on CHILDES and Wordbank are the most dense of any language, thus enabling us to side-step any problems associated with data sparseness. It is instructive, however, to consider how our approach might fare in other languages. Although the number of languages studied is small and has been largely restricted to the Indo-European family, some features of language, such as frequency, word length, and imageability appear to be crosslinguistically robust in terms of their positive influence on learning syntactic categories (Moran et al., Reference Moran, Blasi, Schikowski, Küntay, Pfeiler, Allen and Stoll2018) and words (Braginsky et al., Reference Braginsky, Yurovsky, Marchman and Frank2019). At the same time, some distributional features of language are affected by typology, such that children must implement language-attuned processing mechanisms (F. Chang et al., Reference Chang, Lieven and Tomasello2008; Saksida et al., Reference Saksida, Langus and Nespor2017). We note, however, that these language-specific results occur where order matters, either in segmentation or in sequencing words for production. Since our bag-of-words approach only searches for associations between commonly occurring elements in a manner that is blind to the order, we suspect that it may have crosslinguistic value beyond English. Although there are always exceptions, words that are in a syntactically and/or semantically dependent relationship tend to occur close to each other (Firth, Reference Firth1957), which provides the right conditions for extracting meaning from co-occurrences.
Conclusions
We have reviewed work that has related distributional information to vocabulary acquisition, with a focus on contextual diversity. It is clear from the literature that the choice of the model used to estimate contextual diversity influences the direction of its effect in vocabulary acquisition.
In our approach, we used bag-of-words VSM models to predict AoA. We found that count-based and prediction-based models make opposite developmental predictions for word learning. The better fit of the prediction-based approach suggests that a more flexible treatment of words based on their frequency is particularly important in the context of language acquisition. This approach further offers a specific account for how word frequency and contextual diversity influence the semantic connections between words, and thereby also their acquisition. The prediction-based approach also has the advantage of being easier to relate to cognitive processes. Unlike the count-based approach, it can be interpreted at Marr’s algorithmic level (Marr, Reference Marr1982), a claim that has also been put forward in Mandera et al. (Reference Mandera, Keuleers and Brysbaert2017). Thus, the model can be seen as a procedural approach to error-based associative learning, with prediction as its driving mechanism. This is in line with a long tradition of work that identifies a central role for word prediction, both based on preceding information in a sentence, or even based on the words that appear after a target word (which is often referred to as ‘retrodiction’ or integration, (Federmeier, Reference Federmeier2007; Kutas et al., Reference Kutas, DeLong and Smith2011; Onnis & Thiessen, Reference Onnis and Thiessen2013; Huettig, Reference Huettig2015; Onnis & Huettig, Reference Onnis and Huettig2021; Alhama et al., Reference Alhama, Zermiani and Khaliq2021; Onnis et al., Reference Onnis, Lim, Cheung and Huettig2022).
A relevant, more general question concerns which distributional properties make some words easier to learn than others. We have found that, in the case of nouns, properly-weighted co-occurrence frequencies of words in very local context, word frequency, and contextual diversity are cues that influence the semantic neighbours of a word: contextual diversity reduces the density of semantic neighbours of a given word, which in turn seems to aid the acquisition of that word. A theory of word learning thus needs to account for the fact that children are likely to incorporate these cues into the semantic representations of words.


 Open access

