

Introduction
Childhood obesity is considered a global epidemic and public health crisis in developed and developing countries (Lobstein et al., Reference Lobstein, Baur and Uauy2004) because of its high prevalence and association with risk factors for cardiovascular diseases, articulatory problems, sleeping disorders and insulin resistance, among others (Ebbeling et al., Reference Ebbeling, Pawlak and Ludwig2002; Guh et al., Reference Guh, Zhang, Bansback, Amarsi, Birmingham and Anis2009). In Chile, many changes in socioeconomic conditions, including economic growth, urbanization and globalization, have modified Chilean lifestyle over recent decades. This has brought about an increase in the consumption of high energy density foods (i.e. rich in fat and sugar), together with a significant rise in sedentary lifestyles among all age groups (Albala et al., Reference Albala, Vio, Kain and Uauy2001; Kain et al., Reference Kain, Uauy, Vio and Albala2002).
According to a nutritional map generated by the National Board for School Assistance and Scholarships (JUNAEB), the obesity prevalence in Chile in 2014 was 22.3% in girls and 28.3% in boys in the first grade of school, and 11.0% in girls and 13.6% in boys in the ninth grade (JUNAEB, 2014). However, studies of somatotype – defined as the morphological shape of a subject at a given moment – in the region of Valparaiso have demonstrated a disadvantage in the use of body mass index (BMI) as a measure of adiposity, in that it evaluates the relationship between mass and height without taking adipose and muscle tissue make-up into account. Notably, the somatotype of the Chilean teenage (15- to 18-year-old) population has shifted towards a predominantly endomorph somatotype (related to relative adiposity), particularly in girls, whereas its mesomorph component (associated with muscularity) has decreased (Lizana et al., Reference Lizana, Almagiâ, Simpson, Ivanovic, Binvignat and Berral2012). The increase in high relative adiposity in school-aged children is a major public health concern because the health consequences persist into adulthood, contributing to increases in chronic non-transferable diseases (NCDs) (Kendzor et al., Reference Kendzor, Caughy and Owen2012).
Many studies have demonstrated associations between socioeconomic status (SES) in childhood and a higher risk of developing NCDs (Shrewsbury & Wardle, Reference Shrewsbury and Wardle2008). The mechanisms underlying this association have been studied in great detail, and many articles investigating the role of obesity have been published over the last decade (see, e.g., Wang & Zhang, Reference Wang and Zhang2006; Liberona et al., Reference Liberona, Castillo, Engler, Villarroel and Rozowski2011; Wronka, Reference Wronka2014). Shrewsbury and Wardle found a predominantly inverse association between SES and adiposity in children in 45 research projects conducted between 1990 and 2005 (Shrewsbury & Wardle, Reference Shrewsbury and Wardle2008). The goal of this study was to compare the body composition and somatotype of schoolchildren by SES and school stage in the region of Valparaiso, Chile.
Methods
A total of 1168 children and adolescents between the ages of 6 and 18 years (572 males) from educational institutions in the Valparaíso, Viña del Mar and Concón regions of Valparaíso, Chile, were enrolled in the study. The sample was divided into three school levels: Level 1, 1st–4th grades (6–9 years); Level 2, 5th–8th grades (10–13 years); and Level 3, 9th–12th grades (14–17 years) (see Table 1). All of the children were evaluated between the years 2011 and 2012.
Table 1 Characteristics of schoolchildren (n=1168) by sex and school level, 2011–2012, Valparaíso, Chile
a Pecentage body fat (BF%) was estimated using Ellis equations for Hispanic children.
b Definition of obesity: BF% ≥25 for boys; ≥30 girls.
c High endomorph was ≥5.5.
*p<0.05 using Mann–Whitney U-test for continuous variables and chi-squared test for categorical variables.
Anthropometry measurements
Body fat percentage
Body mass index was estimated as weight (kg) divided by the square of height (m2). Body fat percentage (BF%) was derived from the anthropometric equations described by Ellis (Reference Ellis1997) and Ellis et al. (Reference Ellis, Abrams and Wong1997), which were specifically tailored to Hispanic children and adolescents by sex: Hispanic boys, BF (kg)=0.591×weight (kg)–1.82×age (years)+3.36; Hispanic girls, BF (kg)=0.667×weight (kg)–0.217×height (cm)+15.5.
Obesity was defined as BF% ≥25 in boys and ≥30 in girls (Williams et al., Reference Williams, Going, Lohman, Harsha, Srinivasan, Webber and Berenson1992).
Somatotype
To calculate Heath and Carter’s anthropometric somatotype three numerical ratings representing the endomorph, mesomorph and ectomorph components were calculated (Carter & Heath, Reference Carter and Heath1990). The ratings were calculated using ten anthropometric measurements. Height was measured using a SECA 217 stadiometer (0.1 cm precision); mass was measured using a SECA 813 scale (0.1 kg precision); four skinfolds (triceps, subscapular, supraspinal and medial calf) were measured using a Slim Guide calliper; two bone breadths (the biepicondyles of the humerus and femur) were evaluated with a small Campbell 10 anthropometer; and two perimeters (flexed arm in maximum tension and leg) were measured with a Lufkin flexible steel tape-measure. Anthropometric measurements were taken in triplicate by the first author for the right side of the body with the median value being used as the criterion.
Mean somatotype and the three somatotype components (i.e. endomorph, mesomorph and ectomorph components) were used in the analysis. For a comparison between groups, the Somatotype Dispersion Mean
 $$({\rm SDM}{\equals} {\vskip -2 \root 3 \of {}} ((X_{2} {\minus}X_{1} )^{2} {\plus}(Y_{2} {\minus}Y_{1} )^{2} )$$
was applied, which corresponds to a two-dimensional dispersion measurement of somatotype.
$$({\rm SDM}{\equals} {\vskip -2 \root 3 \of {}} ((X_{2} {\minus}X_{1} )^{2} {\plus}(Y_{2} {\minus}Y_{1} )^{2} )$$
was applied, which corresponds to a two-dimensional dispersion measurement of somatotype.
Carter and Heath’s thirteen categories were used to classify somatotype (see Carter & Heath, Reference Carter and Heath1990). A graphic representation of the somatotype was made by means of a somatochart, which is a projection of the three-dimensional somatochart over a two-dimensional plan. The values of the X and Y co-ordinates were calculated, where:
 $$X\;{\equals}\;{\rm ectomorphy-endomorphy};$$
and
 $$Y\;{\equals}\;2{\times}{\rm mesomorphy}-({\rm ectomorphy{\plus}endomorphy})].$$
‘High endomorph’ was defined as an endomorph component (EC) of ≥5.5 (Carter & Heath, Reference Carter and Heath1990).
Socioeconomic status
The European Society for Opinion and Marketing Research (ESOMAR) survey, adapted to Chile, was used to determine socioeconomic status (ADIMARK, 2016). The survey was based on the household main provider’s occupation and educational level, and was delivered and applied to parents or guardians. The survey assigned one of six SES strata to a family: A=very high SES, B=high SES, Ca=medium–high SES, Cb=medium SES, D=medium–low SES; and E=low SES. If the main provider was inactive in terms of work (i.e. retired, unemployed, inexistent or simply not classifiable), a set of six goods was used: automobile, computer, microwave, video camera, hot shower system and cable TV service. For this study, the following categories were grouped: A+B, corresponding to the very high and high SES levels; Ca, medium–high SES; Cb, medium SES; and D+E, medium–low SES; and low SES.
Statistical analysis
The descriptive statistics of the sample were calculated as means, standard deviations, frequencies and percentages. The normality of the data distribution was evaluated separately using the Shapiro–Wilk test. Significant differences in sample characteristics by school level and sex were evaluated based on a Mann–Whitney U test (non-parametric). For categorical variables, the chi-squared test was used. A variance analysis (one-way ANOVA) and Bonferroni’s test were applied for comparison of the continuous variables. The SDM was used for somatotype comparison among groups, in which a value equal to or greater than 2 corresponds to a statistically significant difference (p<0.05). The relation between adiposity and SES was assessed using logistic regression models. Obesity (as indicated by BF%) and a high EC were considered as the dependent variables in the models. In two models, the primary explanatory variable was high or low SES versus medium SES. The models were adjusted for potential confounding factors, including sex, school level and height. For the remaining analyses a significance of p<0.05 was used. The data were analysed in the STATA 12.0 statistical package.
Ethical considerations
The subjects were informed of the procedures via a written consent form as part of the preliminary screening. All of the procedures were in line with the ethical policies established in the Declaration of Helsinki (World Medical Association, 2008). In addition, the protocol was approved by the Ethics Committee of the Pontificia Universidad Católica de Valparaíso, Chile.
Results
Table 1 presents the general characteristics of the sample: age, height, weight, BMI, BF% and somatotype components (endomorphy, mesomorphy and ectomorphy) by sex and school level. Comparing these variables by sex at each school level, significant differences were found in the mesomorph component: this was higher for males than females at all school levels, and decreased over time in parallel with moderate skeletal muscle development. The height of males was significantly greater than that of females at Level 3 (p<0.01). The EC was higher in Level 3 females compared with those at Levels 2 and 1, and a high relative adiposity (>5.5) was maintained in this component. The ectomorph component was higher in males and increased over time but did not change in volume or relative linearity by height for either sex; the values did not exceed 2.5 for this component. In the last school level, which included the adolescents in the sample, significant differences by sex were found in all variables except age and BMI. In addition, the highest prevalence of obesity was reported in females at Level 3 (over 80%).
When the children were classified by SES and somatotype (Tables 2 and 3), in the male sample a higher percentage of individuals were sorted into the mesomorph–endomorph category (39.8%), independent of SES. However, separating by school levels revealed that individuals were aggregated into the mesomorph–endomorph category, with the exception of Level 1, where SES A+B individuals were distributed mainly in the ectomorph–mesomorph category (30%).
Table 2 Distribution (n, %) of thirteen somatotype categories among male schoolchildren (n =572) by education level and socioeconomic statusFootnote a , 2011–2012, Valparaíso, Chile
a A+B, very high and high SES; Ca, medium–high SES; Cb, medium SES; D+E, medium–low SES; and low SES.
High prevalence by group is shown in bold.
Table 3 Distribution (n, %) of thirteen somatotype categories among female schoolchildren (n=596) by education level and socioeconomic status, Valparaíso, Chile, 2011–2012
See footnote to Table 2 for definitions of SES categories.
High prevalence by group is shown in bold.
In the total female sample, a majority of the individuals were sorted into the mesomorph–endomorph category (64.8%), but as SES decreased, the individuals disaggregated by school levels.
Somatotypes showed significant differences in their EC (Table 4), with individuals of lower SES ranking higher compared with those of higher SES. The predominant relative adiposity transitioned from moderate to high for individuals of medium, medium–low and low SES levels. The mesomorph component values were moderate for all levels. However, the ectomorph component declined as SES decreased.
Table 4 Body composition and somatotypes of children (n=1168) by sex and socioeconomic status, 2011–2012, Valparaíso, Chile
See footnote to Table 2 for definitions of SES categories.
SDM, somatotype dispersion mean (comparisons in two dimensions of somatotype); significant differences between groups in bold (p<0.05).
BF%, body fat percentage (Ellis equation for Hispanic children). Endo, endomorph component. Meso, mesomorph component. Ecto, ectomorph component.
*p-values from one-way ANOVA with Bonferroni post hoc test.
Sex-specific analysis revealed significant differences in the female group. By component, endomorphy increased as SES decreased, and in this group, adiposity shifted from moderate to high at the medium–high income level. This contrasts with males, for whom high adiposity values were maintained. In a similar manner, the ectomorph component decreased with lower SES. Comparing somatotype as a whole (SDM), it was observed that differences in the total sample could be attributed to the female gender, whereas extreme SES resulted in significant differences (A+B≠Cb; A+B≠D+E; Ca≠D+E).
Table 5 shows body composition and somatotype by school level, sex and SES. The male sample registered significant differences in BMI, BF% and EC at school Level 1, where SES Ca was significantly higher than D+E. In contrast, in the ectomorph component of Level 1, SES Ca was lower than D+E. Levels 2 and 3 in males showed significant differences in somatotype as a whole, whereas in Level 2, A+B differed from Ca and Ca differed from D+E. In Level 3, Ca differed from Cb. Females in Level 1 registered significant differences in BMI, BF% and endomorphy by SES. When SES decreased, these variables increased. In Level 2, only EC differed, and the tendency for this to increase as SES decreased was maintained. School Level 3 presented differences in BMI, endomorphy and mesomorphy, which tended to increase as SES decreased. In addition, the ectomorph component (p<0.05) decreased as SES decreased. Comparing somatotype as a whole highlighted the fact that all three school levels exhibited extremes in SES: A+B was different from D+E, and Ca was different from D+E.
Table 5 Body composition and somatotypes of children (n=1168) by sex, school level and socioeconomic status, Valparaíso, Chile, 2011–2012
See footnote to Table 2 for definitions of SES categories.
SDM, somatotype dispersion mean (comparisons in two dimensions of somatotype); significant differences between groups in bold (p<0.05).
Level 1, 1st–4th grade. Level 2, 5th–8th grade. Level 3, 9th–12th grade. BF%, body fat percentage (Ellis equation for Hispanic children). Endo, endomorph component. Meso, mesomorph component. Ecto, ectomorph component.
*p-values from one-way ANOVA with Bonferroni post hoc test.
High prevalence by group is shown in bold.
Table 6 shows the association between high adiposity, as measured by the variables ‘high BF%’ and ‘high endomorph’, and SES. Both variables were significantly associated with SES, but low SES increased the risk of high adiposity compared with very high and high SES (high BF%: OR=2.25; 95% CI 1.40, 3.61; high EC: OR=2.19; 95% CI 1.37, 3.47). In addition, high adiposity was strongly associated with the female sex for both variables (high BF%: OR=3.39; 95% CI 2.60, 4.41; high EC: OR=2.31; 95% CI 1.80, 2.98), and the assessment of school levels revealed that only a high BF% was associated with the second school level.
Table 6 Associations between high percentage body fat and high endomorph component and socioeconomic status in schoolchildren (n=1168) after controlling for sex, school level and height, Valparaíso, Chile, 2011–2012
a Defined as BF% ≥25 in boys and ≥30 in girls.
b Defined as ≥5.5 in the endomorph component of somatotype.
c Definition according to the ESOMAR survey.
*p<0.05; **p<0.001.
Figure 1 is a somatochart representing the somatotype of the male sample by SES and school level. This illustrates the distribution between the mesomorph and EC, except for Level 1 when SES was very high, which was more closely associated with mesomorphy. However, a somatochart representing the somatotype of the female sample by SES and school level (Fig. 2) shows that when SES decreases, the groups shift towards endomorphy.
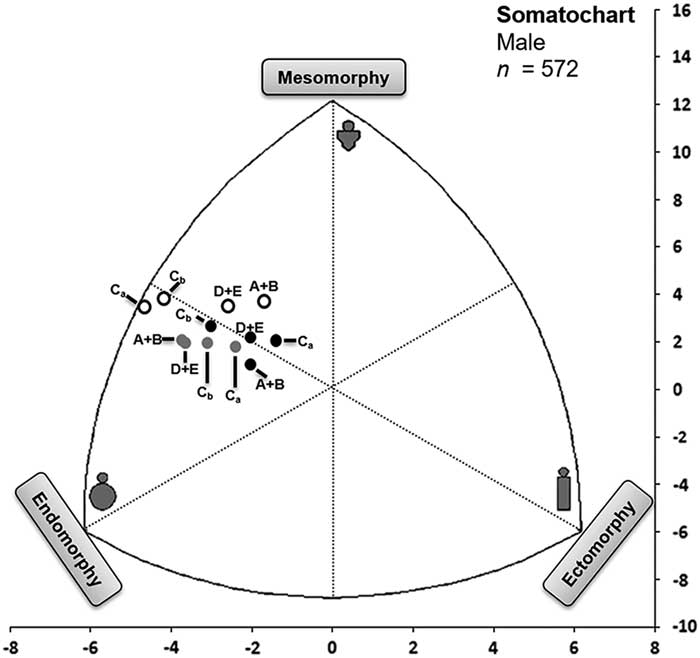
Fig. 1 Somatochart representing the mean somatotypes of the male children sampled from 2011 to 2012 in the region of Valparaíso, Chile, by socioeconomic status (A+B, very high and high; Ca, medium–high; Cb, medium; D+E, medium–low and low) and distributed by school level (white circles=Level 1, 1st–4th grade; grey circles=Level 2, 5th–8th grade; black circles=Level 3, 9th–12th grade).
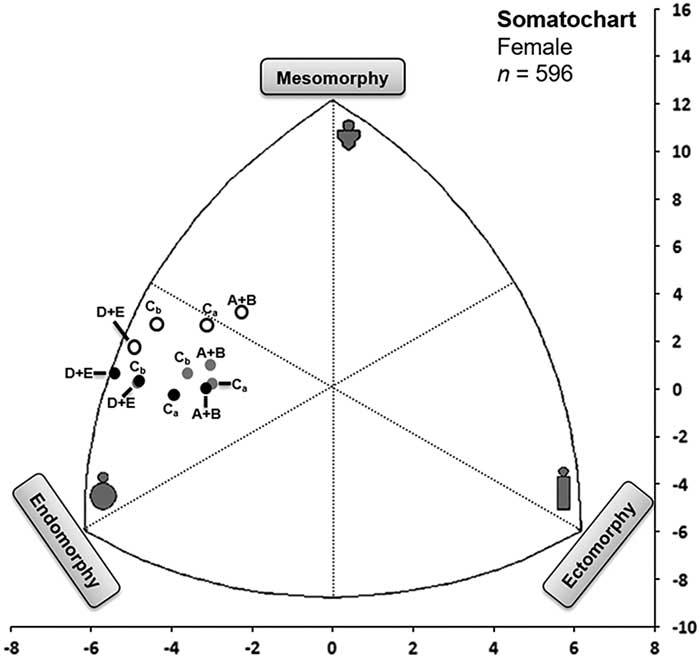
Fig. 2 Somatochart representing the mean somatotypes of the female children samples from 2011 to 2012 in the region of Valparaíso, Chile, according to socioeconomic status (A+B, very high and high; Ca, medium–high; Cb, medium; D+E, medium–low and low) and distributed by school level (white circles=Level 1, 1st–4th grade; grey circles=Level 2, 5th–8th grade; black circles=Level 3, 9th–12th grade).
Discussion
This study’s assessment of the somatotype of Chilean schoolchildren by sex and school level revealed differences between the sexes, with males presenting a significantly higher mesomorph component at each school level, as previously reported in the literature (Lizana et al., Reference Lizana, Almagiâ, Simpson, Ivanovic, Binvignat and Berral2012, Reference Lizana, Olivares and Berral2015; Martínez et al., Reference Martínez, Silva, Collipal, Carrasco, Rodríguez and Vargas2012). In contrast, females were more endomorphic than males, a difference that was most significant in the third (later) school level, and which has also been reported previously (Lizana et al., Reference Lizana, Almagiâ, Simpson, Ivanovic, Binvignat and Berral2012, Reference Lizana, Olivares and Berral2015). Another study of adolescents (15–18 years of age) conducted in Valparaíso between 2009 and 2010 reported that the somatotype of adolescent females was mainly endomorphic (i.e. mesomorph–endomorph in profile) and differed from that of males; although the mesomorph component was significantly higher in males than in females, the endomorph–mesomorph biotype was dominant (Lizana et al., Reference Lizana, Olivares and Berral2015). This is in contrast to the mesomorph–endomorph profile that was identified as dominant in this study.
In females, this study found an increase in the endomorphic character of schoolchildren as SES decreased. This phenomenon is important because a strong relationship between EC and adiposity has been reported (Slaughter et al., Reference Slaughter, Lohman, Boileau, Horswill, Stillman, Van Loan and Bemben1988); this was reported in the current study as a correlation between increased BF% and low SES. Values of EC greater than 5.5, which correspond to high relative adiposity, in lower SES females are concerning and were maintained across all school levels.
The possible association of socioeconomic status with adiposity is a subject of concern worldwide (Moreno et al., Reference Moreno, Mesana, Fleta, Ruiz, González-Gross and Sarría2005; Wronka, Reference Wronka2014; Zsakai & Bobzar, Reference Zsakai and Bodzsar2014). However, few national investigations have used somatotype to evaluate adiposity among children and adolescents. One possible explanation for the association between higher adiposity and low SES is that a low SES family exhibits riskier behaviour, which influences child obesity by affecting physical activity and food intake (Villagran Pérez et al., Reference Villagran Pérez, Novalbos-Ruiz, Rodríguez-Martín, Martínez-Nieto and Lechuga-Sancho2013). Another possible explanation is that Chile is a country in a post-transitional nutritional stage, with the adoption of a Western lifestyle linked to changes in nutrition and physical activity, including a strong preference for foods with a high caloric content, high in saturated fats and sugar and a decreased intake of vegetables and fruits, accompanied by a reduction in physical activity (Albala et al., Reference Albala, Vio, Kain and Uauy2001, Reference Albala, Vio, Kain and Uauy2002). More than 90% of the Chilean population over 15 years of age are sedentary (JUNAEB, 2014). Moreover, in Chile fruit and vegetables are available at affordable prices in most regions of the country. However, barriers remain for households of low SES, whose members have a fruit and vegetable intake of only approximately half the OMS recommendation (Olivares & Bustos, Reference Olivares and Bustos2006). The consumption of processed foods with a high energy density is apparently replacing that of fruit and vegetables, possibly because of advertising, availability and low prices across the entire country (Olivares et al., Reference Olivares, Bustos, Lera and Zelada2007). Food intake preferences are highly related to family context during infancy, when most eating habits are established (Domínguez-Vásquez et al., Reference Domínguez-Vásquez, Olivares and Santos2008). Additionally, higher SES groups are more preoccupied with physical appearance than poor groups, particularly females (Liberona et al., Reference Liberona, Castillo, Engler, Villarroel and Rozowski2011). This information matches the results obtained in this investigation when comparing somatotype with SES disintegrated by sex because there was a moderate relative adiposity in women of higher SES in Levels 1 and 2. In school Level 3, adiposity was moderate in individuals of higher SES and increased to high adiposity in the other levels.
One limitation of this study is that the participants were sampled from one region of Chile and might therefore not represent other localities. Nonetheless, the region of Valparaíso is the third most populated area of the country (Instituto Nacional de Estadística, 2010), and the sample only represented schoolchildren. An additional limitation was the use of BF% and EC but not the body fat distribution and free fat mass in children. However, a higher BF%, by itself, is known to be associated with obesity co-morbidities (Williams et al., Reference Williams, Going, Lohman, Harsha, Srinivasan, Webber and Berenson1992). Another limitation was the stratification of the sample by school levels and not by age. Nevertheless, the stratification performed in this study is of greater use for public policy interventions, which are not made by age but by school levels. Moreover, a third study limitation was its cross-sectional design, which prevented drawing conclusions regarding the temporality of the relationships.
The results obtained in this investigation indicate that low SES female children and adolescents should be the focus of Chilean public and school health efforts to increase weekly time devoted to physical activity, promote healthy eating and implement an active curriculum. In addition, future interventions should consider SES inequalities in obesity to achieve better outcomes for this variable (Beauchamp et al., Reference Beauchamp, Backholer, Magliano and Peeters2014). The study provides evidence that significant differences in the endomorph component of somatotype are related to SES school level; furthermore, the female sample showed greater differences in SES-associated adiposity.
Acknowledgments
The authors are grateful to the Dirección de Investigación, Vice-rectoría de Investigación y Estudios Avanzados and the Instituto de Biología of the Facultad de Ciencias de la Pontificia Universidad Católica de Valparaíso, Chile, for their constant support. This work was supported by Grant SA10I20005 from the National Fund for Health Research and Development (FONIS/MINSAL of CONICYT). Additionally, it was supported in part by Grant DI 037.484/2013 from the Dirección de Investigación, Vice-rectoría de Investigación y Estudios Avanzados, Pontificia Universidad Católica de Valparaíso, Chile.


