


An important decision that most Americans face near retirement is when to claim Social Security benefits. While benefits can be claimed as early as 62, individuals who delay claiming receive higher annual benefits to compensate for the reduction in the expected number of years over which benefits will be paid. A growing body of literature has documented the large and increasing returns to delaying the onset of Social Security benefits, particularly for primary earners (e.g., Sun and Webb, Reference Sun and Webb2009; Sass et al., Reference Sass, Sun and Webb2013; Shoven and Slavov, Reference Shoven and Slavov2014a, Reference Shoven and Slavovb). The advantage of delaying has grown considerably over the last several decades due to changes in Social Security rules (including increases in the credit for delaying Social Security beyond full retirement age), changes in real interest rates, and changes in life expectancy, and there is advantage to delaying even for individuals with mortality rates twice the average rate in the population (Shoven and Slavov, Reference Shoven and Slavov2014a, Reference Shoven and Slavovb). Delay also increases utility beyond the boost to expected present value, as the increased benefits are paid as a real annuity and therefore provide insurance against inflation and length-of-life risk (Sun and Webb, Reference Sun and Webb2009).
However, despite the fact that a large proportion of the population can gain financially by delaying their Social Security benefit, the majority of beneficiaries claim benefits before the full retirement age (66 for individuals born between 1943 and 1954), and very few delay to age 70 (see Annual Statistical Supplement, 2014, Table 6.A4).Footnote 1 There are several hypotheses that may explain why individuals claim Social Security earlier than the age that maximizes the expected monetary value of benefits. Individuals may believe that, due to Social Security's long-term financial shortfall, their Social Security benefits could be reduced if not claimed as soon as possible. Individuals may view the full retirement age as a reference point or recommendation by the government (Behaghel and Blau, Reference Behaghel and Blau2012), choosing to claim at that age even though it may increase wealth to wait until age 70. Many individuals may choose to claim at the same time they retire from a career job, which may be out of their control due to unexpected job loss or disability, or may be driven by health insurance availability via Medicare. Alternatively, individuals tend to undervalue annuities and may therefore not value the marginal increase in their Social Security annuity from deferring (Chai et al., Reference Chai, Maurer, Mitchell and Rogalla2013; Fitzpatrick, Reference Fitzpatrick2015). In this paper, we assess the role of liquidity constraints, namely those individuals who wish to stop working before their wealth-maximizing claiming age may lack the ability to borrow against assets to finance a delay. We also explore whether mortality differs between early and late claimers enough to justify the decision to claim early.
We assemble a panel of administrative tax data for the 1940 birth cohort. Our panel includes annual data for 1999 through 2011, allowing us to observe individuals from ages 59 through 71. Our sample restrictions drop individuals who died before 1999, individuals who received disability benefits or other Social Security benefits before age 62, and women who were married and filing a joint return for some year between 1999 and 2011. These sample restrictions allow us to focus on those who gain the most from delay (non-disabled singles and primary earners claiming worker benefits). A key advantage of the IRS administrative data, other than sample size, is that it provides detailed information on withdrawals from retirement accounts, which are generally not recorded in household surveys like the HRS. While some prior studies have examined the relationship between claiming age and the stock of wealth (e.g., Hurd et al., Reference Hurd, Smith and Zissimopoulos2004; Glickman and Hermes, Reference Glickman and Hermes2015), to our knowledge, we are the first to examine the relationship between claiming age and wealth drawdown behavior.
Using information returns we are able to observe the year of Social Security claiming, the pattern of distributions from tax-deferred retirement accounts, and the fair market value of Individual Retirement Account (IRA) assets. We have several findings. First, we corroborate earlier findings by showing that the vast majority of our sample claims Social Security before the full retirement age, with more than a third claiming Social Security at the earliest eligibility age of 62. Second, we look at the relationship between IRA withdrawals and Social Security claiming and find that 56.6% of our sample takes distributions from their IRA after they claim Social Security, with an average time between Social Security claiming and first IRA distribution of 1.6 years. We then construct the ratio of IRA fair market value at the time an individual claims Social Security to their annual Social Security benefit, and show that approximately 31–34% of beneficiaries who claim before the full retirement age have IRA assets to finance at least 2 years of Social Security benefits and that 24–26% of beneficiaries have IRA assets to finance at least 4 years of Social Security benefits.
While the administrative tax data offer many advantages, the level of assets other than IRAs is more difficult to quantify. We therefore supplement our analysis by creating a sample of likely primary earners from the Health and Retirement Study (HRS). Our results suggest that adding other sources of financial wealth increases the percentage of beneficiaries with wealth at least 2 or 4 years of Social Security benefits to 64% and 54%, respectively. These results suggest that liquidity constraints are not likely to be the main reason a significant segment of the population chooses to claim Social Security early.
Prior studies have shown a correlation between early claiming and subjective mortality (Hurd and McGarry, Reference Hurd and McGarry2002; Glickman and Hermes, Reference Glickman and Hermes2015) as well as actual mortality (Waldron, Reference Waldron2002; Beauchamp and Wagner, Reference Beauchamp and Wagner2012). This relationship could operate through different channels. For example, higher mortality directly reduces the gains from delaying Social Security, potentially making early claiming optimal. Also, those with higher mortality rates are likely to stop working earlier, and individuals may believe that the appropriate time to claim is upon stopping work. We investigate the relationship between Social Security claiming and mortality using the administrative tax data and update and confirm these earlier findings: individuals who claim before the year they turn age 65 have an 80% higher mortality hazard of dying between the year they turn 66 and the year they turn 71 than those who claim after the year they turn age 65. These differences persist across subsamples with different levels of wealth. While these mortality differentials are sensible, since delay benefits those who expect to live longer more, their magnitudes are unlikely to explain why so many individuals claim Social Security at age 62.
The remainder of this paper proceeds as follows. In the next section, we describe the extent of gains from delay for the 1940 birth cohort, and the sample selection in both the administrative tax data and the HRS. We then analyze the distribution of Social Security claim ages and the timing of IRA withdrawals, and also report IRA wealth held by members of our sample at different claim ages. Finally, we report the relationship between mortality and Social Security claiming and conclude.
1 Background and data
1.1 Gains from delay
Studies documenting widespread, large gains from delay (e.g., Shoven and Slavov, Reference Shoven and Slavov2014a, Reference Shoven and Slavovb) have focused primarily on cohorts that have turned 62 recently. Therefore, we begin by documenting the extent of gains from delay for this cohort using the methodology of Shoven and Slavov applied to the cohort examined in this study, namely the 1940 cohort who turned 62 in 2002 (2014b).
Social Security worker benefits are based on a progressive formula applied to the average of an individual's highest 35 years of earnings, after indexing earnings in each year to economy-wide wage growth. An individual who claims at full retirement age receives a monthly benefit equal to his or her primary insurance amount (PIA). Benefits are reduced for claims made prior to full retirement age and increased for claims made after full retirement age. For individuals born in 1940, full retirement age is 65.5. Those who claim at the earliest possible age of 62 receive a monthly benefit equal to 77.5% of PIA. Those who delay beyond full retirement age receive an increase in their monthly benefit of 7% of PIA per year, resulting in a monthly benefit of 131.5% of PIA if claimed at age 70. Primary earners pass on these benefits, including all actuarial adjustments, to their surviving spouses.Footnote 2
We consider stylized single males and females turning 62 in 2002. We also consider stylized couples in which the husband (assumed to be the primary earner) turns 62 in 2002 and the wife turns 60 in 2002. For one-earner couples, the wife's PIA is assumed to be zero. For two-earner couples, the wife's PIA is assumed to be 75% of the husband's PIA. Our baseline mortality rates come from the cohort mortality tables underlying the intermediate assumptions in the 2013 Social Security Trustees Report. We also consider singles and couples with age-specific mortality rates (i.e., at each age, the probability of dying within 1 year) equal to 1.33, 1.5, 1.67, and 2 times the baseline.Footnote 3 We assume that all deaths occur midway through the year. For couples, we scale up the mortality of both members of the couple, and we assume that the deaths of both spouses are independent events. Any survivor benefits are claimed immediately upon the death of the spouse, with the appropriate actuarial adjustment for survivor benefit claims made before full retirement age.
To compute present values, we must make an assumption about interest rates. Previous research (e.g., Shoven and Slavov, Reference Shoven and Slavov2014a, Reference Shoven and Slavovb) has argued that the 20-year Treasury Inflation Protected Security (TIPS) rate is appropriate, as Social Security benefits are inflation-indexed obligations of the U.S. government and 20 years is roughly the expected time period over which benefits are paid. However, 20-year TIPS did not exist in 2002. Instead, we use the fixed rate on Series I Savings Bonds, which was 2% for most of 2002.Footnote 4 This is somewhat lower than the 2.9% long-term average assumed in Social Security Trustees Reports.
A claiming strategy for a single person is simply an age at which to claim Social Security benefits. A claiming strategy for a couple consists of a claiming age for each member of the couple. The primary earner claims worker benefits and the secondary earner claims either a worker benefit of a spousal benefit, whichever is higher.Footnote 5 To reduce complexity, we require benefits to be claimed at whole ages, even though benefits are adjusted on a monthly basis.
We note that these simulations take into account only the expected monetary gains from delay. The utility gains are likely to be even higher given the insurance value of the higher Social Security annuity. The simulations also do not take into account taxes. Taxes raise additional complications, as the gains from delay depend on the amount of additional (non-Social Security) income that the individual or household receives. However, other research suggests that taxes generally do not substantially alter the finding that delaying Social Security results in net gains for many primary earners and singles (e.g., Mahaney and Carlson, Reference Mahaney and Carlson2007; Bronshtein et al., Reference Bronshtein, Scott, Shoven and Nataraj Slavov2016).
Table 1 shows the key results. The first column indicates how much mortality rates are scaled up relative to baseline. The second column indicates the present-value maximizing claiming ages for each stylized single and for the primary earner in each stylized couple.Footnote 6 The third column shows the gain in expected lifetime benefits relative to claiming at age 62. Overall, the table shows that single males and females with up to 50% higher mortality than baseline benefit from some delay, though the gains are modest for single men.
Table 1. Gains from delay for the 1940 birth cohort
Source: Authors’ calculations.
For couples, the gains from delaying Social Security are more significant. In both one-earner and two-earner couples, primary earners always benefit from some delay, even with mortality equal to twice the baseline. Primary earners have such large gains from delay even with high mortality because their higher monthly benefits are paid as a joint-and-survivor annuity. That is, even if the primary earner dies early, the surviving spouse continues to receive the higher monthly payments.
1.2 Tax return data
Our data come from the population of tax and information returns collected by the Internal Revenue Service (IRS). We use supplementary information provided by the Social Security Administration (SSA) on date of birth, gender, and date of death to restrict our sample to individuals who were born in 1940. We then construct a panel spanning 1999–2011; thus, we observe the 1940 cohort from ages 59 through 71. Our dataset contains information on household income (Form 1040), wage earnings and employee contributions to employer-sponsored retirement plans (Form W2), distributions from IRAs and distributions from employer-sponsored retirement plans (Form 1099R), contributions to and account balances of IRAs (Form 5498), and Social Security payments (Form 1099-SSA). The initial 1940 birth cohort has 2,617,194 individuals, comprising both filers and nonfilers.Footnote 7 Because the data are unedited, we make a number of restrictions in an effort to remove observations with erroneous information. We drop individuals who died before 1999 or who do not receive a 1040, W-2, or 1099-SSA over the entire sample period. We also drop same sex couples, individuals with unidentified gender, and individuals who do not have Social Security numbers. These restrictions reduce the sample to 2,339,893.
We define an individual's year of claiming Social Security as the first year in which the individual received a 1099-SSA reporting Social Security payments. All types of Social Security payments, including retired worker benefits, auxiliary (spousal or survivor) benefits, disability benefits, and railroad benefits are reported on the 1099-SSA.
We wish to construct our sample to include those who both have a choice of when to claim Social Security benefits and among those, specifically people who would benefit from claiming benefits later than the earliest age of eligibility. The preceding analysis suggests that these individuals include primary earners in married couples and singles with mortality that is not too much higher than average. We would like to drop individuals who claim spousal or survivor benefits, which do not grow with delay beyond the full retirement age, and individuals receiving railroad or disability benefits, which are subject to different computation rules.
The 1099-SSA reports whether an individual's benefit is drawn from the disability or railroad trust fund. We use this information to drop all individuals who received these benefits at any point during the sample period.Footnote 8 Dropping individuals who have received disability benefits also has the advantage of eliminating a group with substantially higher mortality than average (see Zayatz, Reference Zayatz2011). Unfortunately, the 1099-SSA does not report whether a non-disabled individual's benefit is a worker, survivor, or spousal benefit. We also have no good way of determining whether an individual is a primary or a secondary earner. As an approximation, since married women are more likely to be secondary earners or to receive auxiliary benefits, we retain only the male member of married couples, as well as singles of any gender.Footnote 9 We also eliminate individuals whose benefit is drawn from the retirement trust fund, but who claimed before 2002 (age 62). These individuals are likely to be receiving survivor benefits, which can be claimed as early as age 60. These restrictions reduce our sample to 1,238,927 observations. Even after this sample selection, it is still possible that some of our singles are receiving survivor benefits or spousal benefits based on an ex-spouse's record. However, there is no way to identify these individuals in the data.
Of the remaining 1,238,927 observations, 91% claim Social Security at some point between 1999 and 2011. We drop individuals who never claim Social Security, leaving a sample of 1,127,977, consisting of roughly 24% single men, 54% married men, and 22% single women.
Our information on wealth comes from Form 5498, which reports the fair market value of IRAs.Footnote 10 Unfortunately, tax records do not contain information on other kinds of wealth, including defined contribution balances. IRA balances therefore provide a lower bound on the wealth that can be used to delay Social Security. To compare Social Security claiming behavior with retirement account claiming behavior, we use information from Form 1099-R, which reports distributions from IRAs and employer sponsored pension plans. Distributions from employer-sponsored pension plans include payments from both defined benefit and defined contribution plans. Since defined benefit plans do not represent a source of liquid wealth that can be used to delay Social Security, and since individuals have less flexibility regarding the timing of defined benefit distributions, we would ideally like to focus only on distributions from IRAs and defined contribution plans. While IRA distributions are identified separately on the 1099-R, defined benefit and defined contribution distributions are not distinguishable. Therefore, we once again focus only on IRAs.Footnote 11 Among the sample of 1,127,977 individuals who claim Social Security at some point during the sample period, 40% take distributions from both IRA and employer plans, 12% take distributions from IRAs only, and 27% take distributions from employer plans only.
In addition to comparing the timing of IRA distributions and Social Security claiming ages, we also examine the ratio of IRA wealth at the time of Social Security claiming to the average Social Security benefit for one's gender and claiming age in the 1940 birth cohort. While the tax data includes data on Social Security income, as discussed above, it does not distinguish between different types of benefits (i.e., spousal, retirement, etc.). It also does not indicate if an individual's benefit has been reduced due to the earnings test. We therefore use the Social Security Benefits and Earnings Public Use File, a dataset containing administrative Social Security data on a random sample of individuals receiving benefits in December 2004, to calculate the average retired worker's PIA by gender. These PIAs are inflated or deflated to the year in which wealth is measured using the Social Security cost-of-living adjustment. Of course, an individual receives his or her PIA only if benefits are claimed at the full retirement age. To determine the average benefit that would be available at the individual's claiming age, we adjust these PIAs using the actuarial reduction factors for claims made before the full retirement age, and delayed retirement credits for claims made after the full retirement age.Footnote 12 We then examine the ratio of IRA wealth to the average Social Security benefit based on the individual's gender. This ratio indicates how much longer an individual could potentially have delayed Social Security, using IRA wealth alone, at the time of their claim.Footnote 13 Because we only observe IRA wealth, and not total wealth, this estimate of the additional delay that could be financed can be viewed as a lower bound. As we will explain in the following section, we can use the Health and Retirement Study, which contains information on total wealth, to approximate how tight that lower bound is.
1.3 HRS data
The HRS is a biennial panel survey intended to be representative of the population aged 50 and older. The survey began in 1992, with new cohorts added periodically to keep the sample representative of the target population. We begin with 38,130 individual-level observations from the RAND version of the HRS from the 11 waves of the survey available at the time of analysis, collected between 1992 and 2012 (see RAND HRS Data Files, 2014). The HRS includes information on Social Security income. However, it does not distinguish among the different types of benefits. Thus, we drop anyone who claimed benefits before age 62, as well as anyone who reports receiving either Social Security disability benefits or Supplemental Security Income due to disability. These eliminations reduce the sample size to 31,999. Next, we drop individuals with missing Social Security claim dates and missing birth years, as well as individuals who are not observed all the way through their full retirement age (as we cannot determine if these individuals delayed until the full retirement age). These restrictions reduce the sample size to 10,710. If individuals were surveyed at age 62, we look at their wealth and most other characteristics from that wave. For individuals who were not surveyed at age 62, we look at their characteristics from the wave in which they were either 61 or 63. Individuals who were not observed at any of these ages are dropped, reducing the sample to 7,125. We also drop married womenFootnote 14, individuals with less than 10 years of work history (who are unlikely to qualify for Social Security), and individuals with missing education or race. Our final sample contains 4,362 observations, of which roughly 67% are married men, 12% are single men, and 21% are single women.Footnote 15 The individuals in this sample were born between 1928 and 1947.
The RAND HRS includes information on household-level IRA wealth, as well as total non-retirement financial wealth. Total non-retirement financial wealth includes checking and savings accounts, certificates of deposit, bonds, stocks, mutual funds, and any other savings less debt. To obtain the value of defined contribution balances, we merge in a supplemental dataset, created by Gustman et al. (Reference Gustman, Steinmeier and Tabatabai2014), containing estimates of pension wealth through the 2010 wave. We aggregate defined contribution balances by household, using the HRS tracker file to identify couples. These household-level defined contribution balances are added to the existing RAND measures of household-level IRA and non-retirement wealth to create total household wealth.Footnote 16 Wealth is measured in the wave in which the respondent turns 62 (or, if not observed at 62, then 61 or 63).
Since our goal is to determine which individuals have sufficient wealth to delay Social Security, we need to compare wealth with the Social Security benefits that would be forgone during the delay period. We match individuals to the average PIA for their gender and birth cohort, calculated from the Social Security Earnings and Benefit Public Use File as described in the previous section. Since the benefit data does not include benefit information for workers who were born after 1942 (as these individuals would not have turned 62 by 2004), we inflate the average PIAs for the 1942 cohort by the average wage index and assign these to younger cohorts. To determine the average benefit that would be available at the individual's claiming age, we adjust these PIAs using the actuarial reduction factors for claims made before the full retirement age, and delayed retirement credits for claims made after the full retirement age.Footnote 17 We then examine the ratio of both IRA wealth (for comparison with the tax data) and total wealth to the average benefit within the individual's gender and birth cohort.Footnote 18 Before calculating these ratios, we inflate or deflate PIAs to the year in which wealth is measured using the Social Security cost-of-living adjustments.Footnote 19
1.4 Social Security claim ages, IRA withdrawals and liquidity constraints
Figure 1 shows the distribution of Social Security claiming ages and the first year of IRA distributions for individuals in our administrative tax sample. Consistent with previous research, more than a third of individuals claim in 2002 (at age 62). Another spike in claims occurs in 2005–06, as members of the 1940 cohort reach their full retirement age of 65½. Very few individuals delay their claims beyond this point.Footnote 20 The middle panel shows the distribution of first-time Traditional IRA withdrawals for the subset of individuals who have Traditional IRAs.Footnote 21 Here, a very different pattern emerges. While there is a spike in withdrawals in 1999–2000 (as the cohort reaches age 59½), it is far more common to wait until age 2010–11, when the cohort reaches age 70½ and required minimum withdrawals become mandatory. Finally, the bottom panel shows the distribution of first-time Roth IRA withdrawals for the subset of individuals with Roth IRAs. Here, since the basis of a Roth IRA can be withdrawn without penalty prior to age 59½, there is no observable spike in withdrawal activity in 1999 and 2000. The majority of the sample withdraws from both Traditional and Roth IRAs in 2005 or later (57 and 71%, respectively), while the majority of Social Security claims occur prior to 2005 (59%).
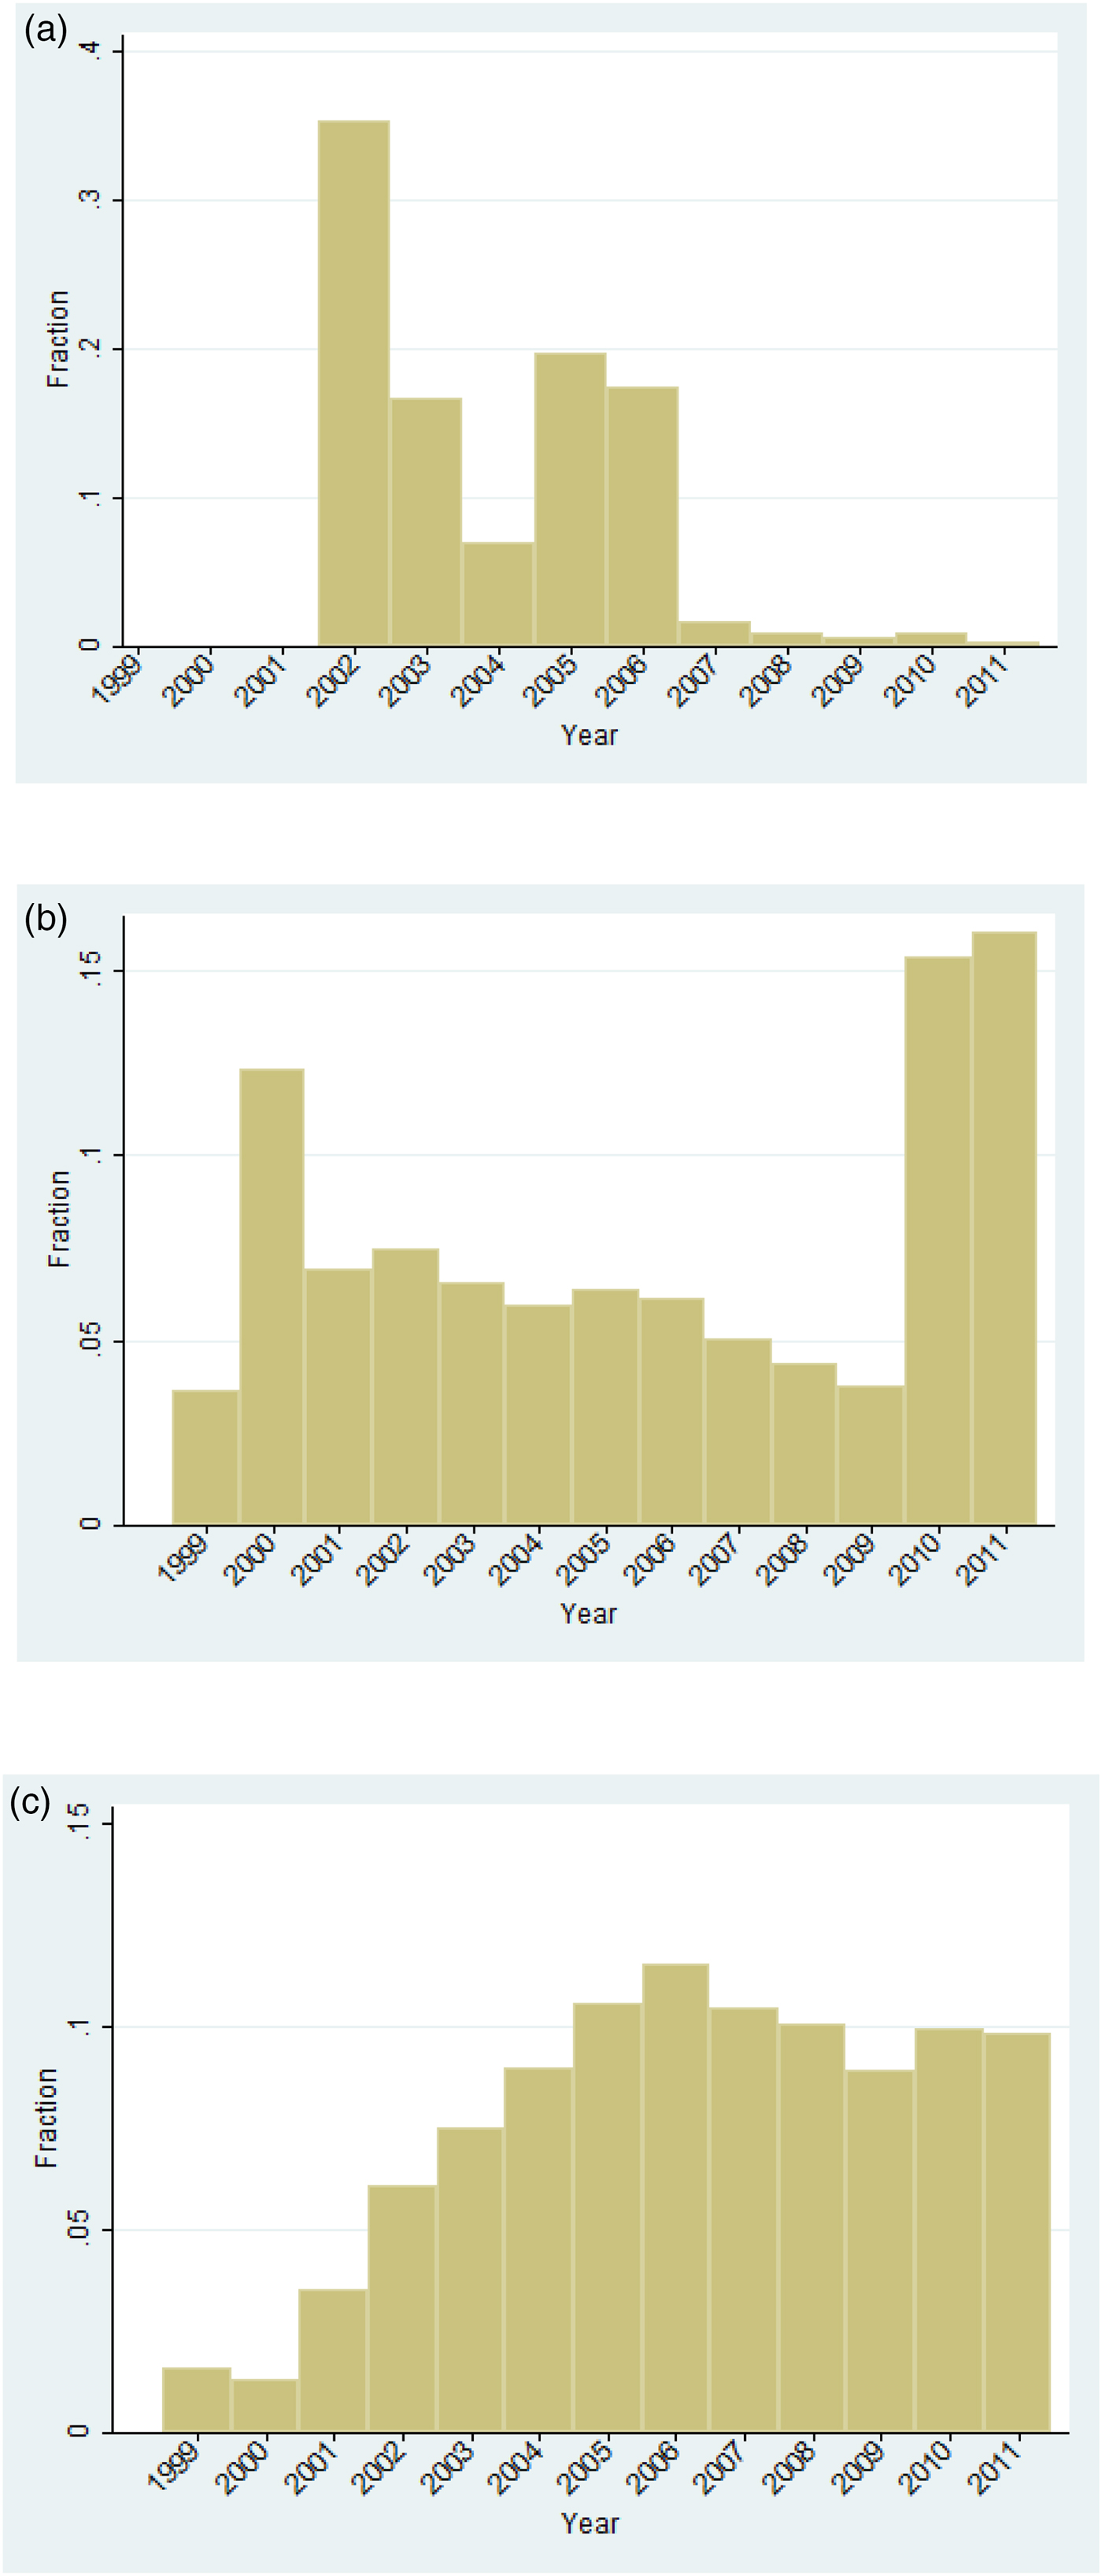
Figure 1. (Colour online) (a) First year of Social Security claim. (b) First year of distribution from Traditional IRA. (c) First year of distribution from Roth IRA. Source: Author's calculations.
Of course, the individuals depicted in the bottom panels of Figure 1 are a selected sample of those represented in the top panel of Figure 1. We therefore also compare the IRA and Social Security withdrawal behavior of the subset of individuals who have IRAs. Figure 2 provides a histogram of the difference between Social Security claiming age and Traditional IRA first-withdrawal age for these individuals. Negative values indicate that Social Security was claimed first. Positive values indicate that the IRA first withdrawal occurred first. The figure shows that individuals with IRAs tend to claim Social Security before making IRA withdrawals, as most of the mass is on the left part of the graph. In particular, 57% of the sample claim Social Security benefits prior to withdrawing funds from IRAs. The spike at -5 represents individuals who claim Social Security at their full retirement age of 65½ and make their first withdrawal from their IRA at 70½. Many individuals claim Social Security benefits in the same year they make their first IRA distribution. Only 33% of the sample claims Social Security benefits after they take distributions from their IRA. These IRA withdrawal results are consistent with the empirical finding that retired individuals draw down on their wealth much more slowly than the life cycle model would predict (see e.g., Hurd, Reference Hurd1990; Di Nardi et al., Reference Di Nardi, French and Jones2010).
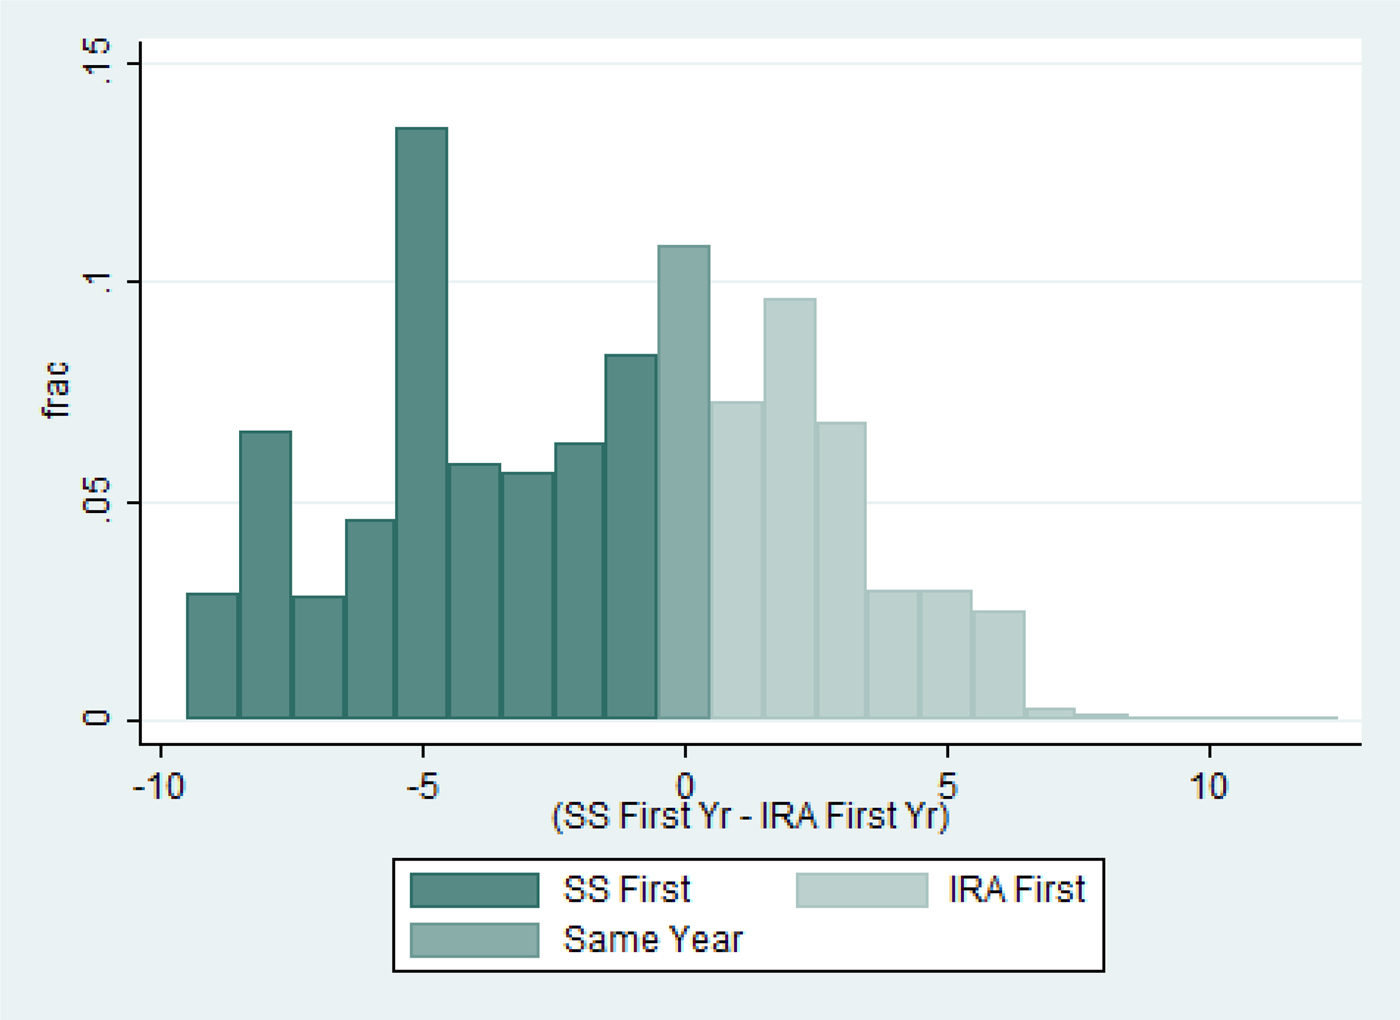
Figure 2. (Colour online) Difference between Social Security claim year and first year of IRA distribution. Source: Author's calculations.
We next construct a measure of what proportion of the sample have IRA balances that could potentially allow someone to defer Social Security benefits. We take the sum of each individual's IRA fair market values (retrieved from Form 5498) and divide by the gender-specific average benefit received by the 1940 cohort at different ages.Footnote 22 We then plot the percentage of our sample with IRA balances equal to at least twice the average benefit or at least four times the average benefit in Figure 3.

Figure 3. (Colour online) Percent of households with IRA fair market value greater than 2 or 4 Years of Social Security benefits. Source: Author's calculations.
The proportion with IRA wealth at least twice or four times the average benefit is on average 35 and 27%, respectively. In other words, approximately a third of the sample has an IRA balance that could allow them to defer Social Security benefits for an additional 2 years, while about one quarter have funds to defer for an additional 4 years. These numbers fluctuate over the study period, between a low of 25% (20%) in 2009 (2008) and a high of 42% (33%) in 2006 for 2 years (4 years). There are two main reasons for these fluctuations. The first is market fluctuations that occurred between 2002 and 2010. The second is selection in claim ages. For instance, those who claim at age 62 may have different levels of wealth than those who claim at age 67. Still, the figure suggests that a significant share of our sample has funds that could allow them to delay claiming retirement benefits and in turn receive higher annual benefits due to the delayed retirement credit, even among those who claim prior to the full retirement age.
These estimates are likely to be lower bounds since IRA wealth represents only part of total wealth that could potentially be used to delay Social Security. To obtain an estimate of how the relationship between financial wealth relates to Social Security benefits for a broader measure of wealth, we turn to our HRS sample.
Table 2 provides summary statistics for our sample, and Table 3 shows how early claiming behavior varies with wealth. According to Table 2, around 35% of individuals in our sample have IRA wealth equal to at least 2 years of average Social Security benefits, in line with our estimates from the tax data. If we use total wealth, the fraction is much larger: around 64% of the sample has wealth equal to at least 2 years of average Social Security benefits. The vast majority of people – around 72% – claim Social Security before the full retirement age. According to the last column of Table 3, that fraction is slightly higher (73%) among those in the low total wealth category. Using just IRA assets, approximately 26% of the sample has wealth equal to at least four times the average Social Security benefit; this fraction increases to 54% when total wealth is used instead of IRA assets (see Table 2). Individuals in the low total wealth category are slightly more likely (again around 73%) to claim early (see Table 3). If we limit our sample to those born in 1938 or later, who receive more generous delayed retirement credits from delaying Social Security benefits, the difference in claiming behavior by wealth is somewhat more pronounced. In particular, the second column of Table 3 shows that around 80% of those in the low total wealth category claim before the full retirement age, versus 74% in the high wealth category.
Table 2. HRS sample characteristics
Notes: Based on 4,362 observations. Sample construction is described in Section 2.
Table 3. Percent claiming early by wealth and birth cohort
Notes: Sample size is 4,362. Sample construction described in Section 2.
1.5 Social Security claiming behavior and mortality
In the tax data, we do not observe many other characteristics of individuals other than what is available from tax reporting. However, we can examine mortality by claim age to test whether the relationship between subjective mortality expectations and claim age translate into differences between realized mortality and claim age. The mortality hazards by Social Security claiming age are shown in Figure 4. The figure shows that mortality hazards decrease as claim age increases, suggesting that one reason people may claim Social Security benefits early is due to private information regarding their health status. In particular, delaying benefits to older ages has lower returns for those with higher than average mortality, and these individuals are also more likely to stop work early. We calculate the 5-year mortality rate between 66 and 71 for all three groups. The group that claims Social Security prior to 2005 has a 5-year mortality rate of 8.2%. The group that claims in 2005 has a 6.3% chance of dying prior to 2011, while those who claim after 2005 have only a 4.6% chance of dying over the same 5-year period.Footnote 23 We repeat this exercise separating the sample by wealth at age 62, and find that the differences persist within similar wealth categories.Footnote 24 These results suggest that the relationship between subjective mortality and claiming age found in the HRS translates into a relationship between actual mortality rates and claiming age for the 1940 birth cohort. They are also consistent with prior research on actual morality and claiming (Waldron, Reference Waldron2002; Beauchamp and Wagner, Reference Beauchamp and Wagner2012).
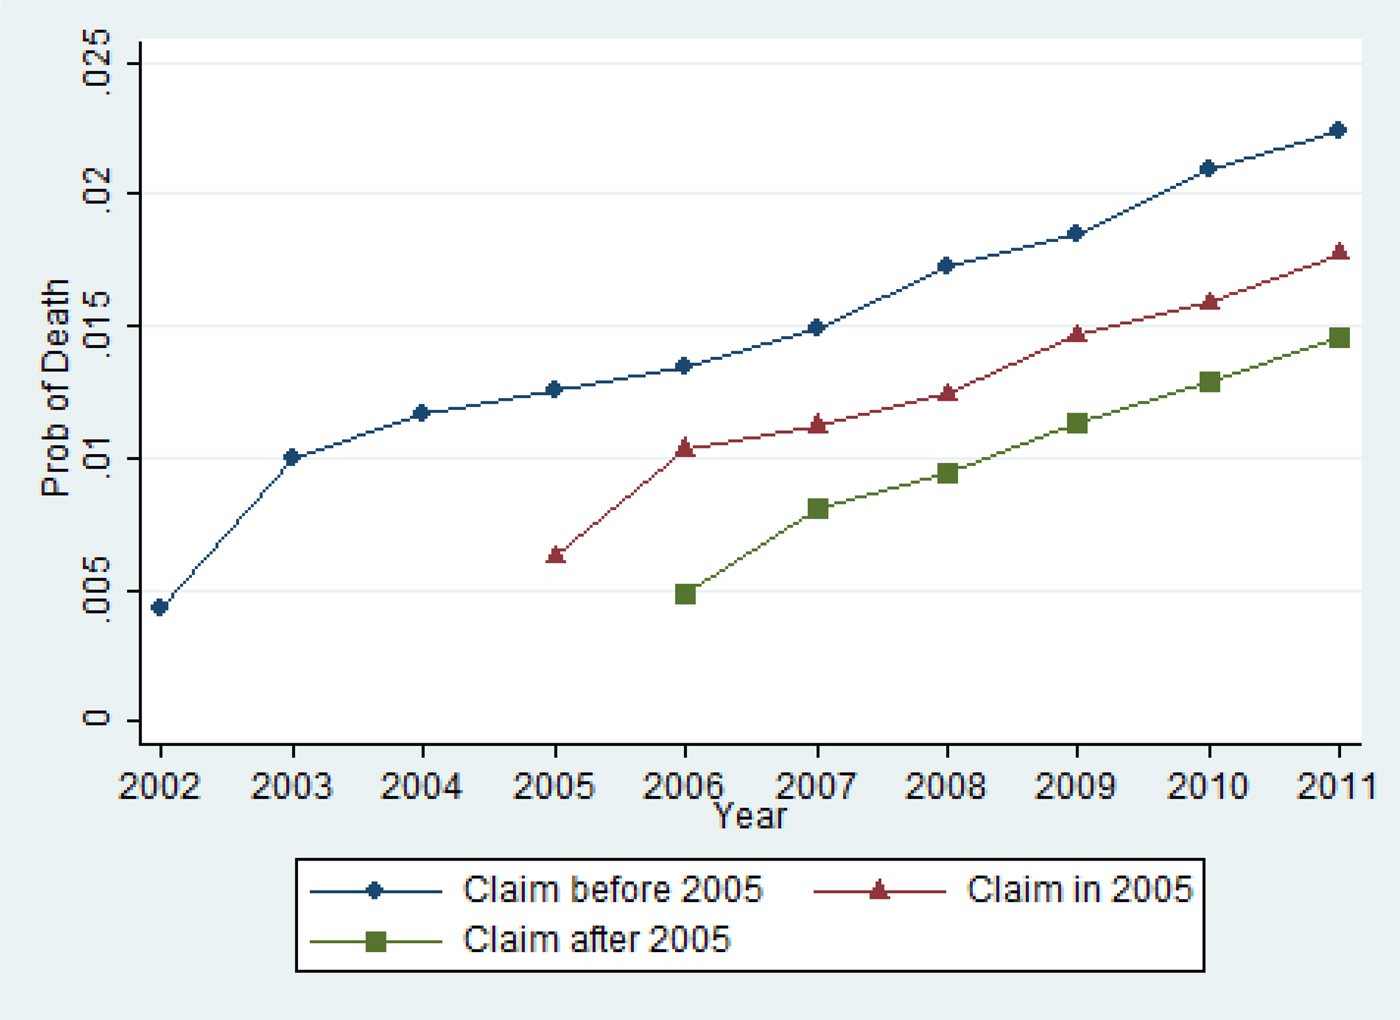
Figure 4. (Colour online) Mortality hazards by Social Security claim age. Source: Author's calculations.
However, we do not think these mortality differences are large enough to explain why so many individuals claim early. The early-claiming group has a mortality rate that is around 30% higher than the group that claims at full retirement age. As we showed in our simulations, singles and primary earners with mortality rates that are 33% higher than average gain from some delay. Furthermore, individuals in our sample are likely to have lower mortality than average considering that we dropped individuals who have ever received disability benefits.
2 Conclusion
In this paper, we provide new evidence on the relationship between when people claim Social Security benefits relative to when they take distributions from their IRAs, and how IRA wealth compares with Social Security benefits. Our analysis of administrative tax data shows that a significant share of individuals in our sample has sufficient IRA wealth to finance a delay in claiming Social Security benefits. We supplement this analysis with data from the HRS, which suggests that an even greater share could finance a delay in claiming if other sources of wealth are considered. While using all of one's financial assets to delay Social Security claiming is unlikely to be optimal given precautionary savings and bequest motives, recent literature suggests that the financial gains to delaying Social Security benefits are large, even for individuals with higher than average mortality rates (Shoven and Slavov, Reference Shoven and Slavov2014a). Our results rule out liquidity constraints as a reason to claim Social Security benefits early for a significant share of our sample.
We also explore the relationship between Social Security claiming and mortality and find that those who claim prior to the full retirement age have higher realized mortality. These findings are consistent with both the idea that delayed claiming provides less financial gain to those who have higher than average mortality, and the possibility that those who claim prior to the full retirement age are those with work-limiting disabilities who leave the labor force earlier and claim Social Security once they are no longer working.
The statistics we report are relevant for our selected sample, namely the subset of the 1940 birth cohort that is likely to be making a decision of when to claim Social Security retired worker benefits. This sample excludes married women (who are more likely to be secondary earners and receiving spousal benefits) and those already receiving Social Security benefits prior to age 62 due to either disability or as widows. We choose this particular birth cohort because we are able to observe them from the year they turn 59 through the year they turn 71, spanning the time period during which individuals are permitted to take distributions from their tax-deferred retirement accounts without penalty. However, other cohorts may have different characteristics due to, for instance, a greater number of secondary earners who are making independent claiming decisions and different levels of stock market returns during their claiming years. Overall, our results suggest that while decisions of when to claim Social Security are strongly associated with life expectancy, the mortality differentials are not likely to be large enough to justify claiming at age 62. In addition, our results indicate that a significant share of the population can potentially finance a delay in Social Security claiming by accessing financial wealth earmarked for retirement.


