


Introduction
Over the past several decades, agricultural production has increasingly shifted to larger operations, the total number of farms has steadily declined, and the average age of principal operators has increased (USDA-NASS, 2019). These trends may indicate that beginning farmers, who are typically younger and operate smaller farms than their more experienced counterparts, face increasing economic challenges. Larger farms have been shown to be more productive than smaller ones, and many beginning farmers lack the net worth and access to capital with which to increase their scale of production (Key, Reference Key2019; Kauffman, Reference Kauffman2013). Some new farmers may also lack the skills required for efficiently managing and operating their farm business in a competitive economic environment. The challenges faced by beginning farmers are reflected in higher farm business exit rates compared to more established operations (Katchova and Ahearn, Reference Katchova and Ahearn2017).
The USDA administers numerous programs designed to help beginning farmers—who are usually defined as farm or ranch operators with no more than 10 years of farming experience. The Farm Service Agency (FSA) operates loan programs that target beginning farmers and operates a program providing retiring landowners with supplemental payments for expiring Conservation Reserve Program (CRP) contracts if they agree to sell or rent their land to a beginning farmer. The Environmental Quality Incentives Program provides enhanced financial and technical assistance to beginning farmers for the installation of select conservation measures. The Risk Management Agency offers benefits to beginning farmers and ranchers who buy crop insurance, including exemptions from paying certain administrative fees, a higher premium subsidy, and less stringent yield and production history requirements. The USDA also funds a Beginning Farmer and Rancher Development Program to provide training, education, outreach, and technical assistance to beginning farmers.
This study seeks to understand the determinants of business success for beginning farmers—information that could be helpful in the design and functioning of programs and policies that support these operators. A prerequisite for this research is an accurate and operational measure of business success. Farm financial performance provides one possible metric for success, and, as we review in the next section, several studies have sought to link farm and operator characteristics to financial outcomes using cross-sectional data. While panel data on farm financial performance are rare, other measures of business success may be available when farms are observed over time. Many farm-level panel data sets permit analyses of farm business survival (exit) rates or farm growth rates conditional on survival. Unfortunately, neither of these outcomes alone provide a satisfactory measure of farm business success.
A problem with analyzing the survival rate alone is that not all farms that remain in business can be considered successful. Some surviving farms may contract in size over time as their owners disinvest from their operations in anticipation of business failure (Kazukauskas et al., Reference Kazukauskas, Newman, Clancy and Sauer2013). While older farmers may disinvest in anticipation of retirement, a reduction in farm size for younger farmers may indicate that the owners failed to earn sufficient profits to meet their loan obligations and had to liquidate productive assets in order to remain in business. On the other hand, an expansion in farm size suggests that the owners were able to invest in their operation because it was profitable or was expected to be profitable. Hence, for many surviving farms, the growth rate provides useful information about business success.
A disadvantage to focusing on growth alone is that a growth rate analysis is limited, by definition, to the population of surviving operations. While a growth analysis can identify the factors that affect growth, it cannot conclusively identify the determinants of business survival, which is obviously required for success. A factor positively (or negatively) correlated with the growth rate may have the opposite effect on the probability of business survival. For example, as we show later in the study, direct-to-consumer (DTC) marketing is negatively associated with subsequent farm expansion among surviving farms but is positively associated with the likelihood that a farm survives in business. The fact that DTC marketing is associated with slower subsequent growth does not necessarily mean it is associated with lower rates of business success since farms with DTC sales are more likely to survive.
In this study, a farm is defined as successful if it remains in business and does not decrease in size (measured using the inflation-adjusted value of farm real estate assets) over a 5-year period. This definition accounts for the fact that business survival is necessary but not sufficient for success and that business growth provides useful information about success for surviving operations. This definition permits estimation of the determinants of farm business success for all farms in a panel sample—including those that subsequently exit farming. This allows us to estimate the net effect on business success of factors that have opposing effects on farm survival and farm growth, such as the use of DTC marketing.
Farm-level data from the 2007, 2012, and 2017 U.S. Agricultural Censuses are used to estimate how farm characteristics (size, tenancy arrangements, productivity, organizational arrangements, commodity specialization, and region), marketing strategies (DTC sales), operator and farm household characteristics (age, race, gender, off-farm income), and agricultural program participation (agricultural payments) affect the probability of farm business success. To better understand the determinants of success of smaller-scale operations, we separately conduct analyses on both small- and larger-scale operations.
The expansive farm-level panel data set, which includes almost all beginning farmers in the U.S., allows for statistically significant comparisons across farm types, regions, commodity specializations, and operator demographics. By using multiple years of data, the data set also allows for comparisons of farm performance in periods with different farm and nonfarm economic conditions, enhancing the robustness of the estimates.
The results include estimates of the probability of success for different categories of farms and farmers—information that could be useful in targeting program resources to beginning farmers that are facing greater business challenges. By identifying the factors that contribute to farm business success, the results also suggest possible mechanisms for raising beginning farm success rates.
Potential Measures of Farm Business Success
Possible measures of farm business success include financial performance, business longevity, and farm size growth. Many studies have analyzed how farm and operator characteristics and other factors influence financial outcomes, such as liquidity, solvency, profitability, and financial efficiency (e.g., Ahrendsen and Katchova, Reference Ahrendsen and Katchova2012; Franks, Reference Franks1998; Gloy and LaDue Reference Gloy and LaDue2003; Mishra, El-Osta, and Johnson, Reference Mishra, El-Osta and Johnson1999; Zech and Pederson, Reference Zech and Pederson2003). A smaller number of studies have focused on the financial performance of beginning farms. Mishra, Wilson, and Williams, (Reference Mishra, Wilson and Williams2009) found that younger and more educated beginning farm operators had a lower return on assets. They also found that certain management strategies, such as increasing the number of decision-makers, engaging in value-added farming, and having a written business plan, led to higher returns. Kropp and Katchova (Reference Kropp and Katchova2011) investigated the effects of direct farm payments on the liquidity and repayment capacity of both experienced and beginning farmers. They found a positive significant relationship between the level of direct payments and the term debt coverage ratio for experienced farmers, but not for beginning farmers. Similarly, they found a significant negative relationship between the number of base acres and the current ratio for experienced farmers and no significant effect for beginning farmers. More recently, Katchova and Dinterman (Reference Katchova and Dinterman2018) sought to identify the personal and farm characteristics that determine whether farm business financial ratios fall into a critical zone, indicating financial stress. They found that beginning farmers were at a greater risk of financial stress than more established operations across all examined financial measures.
Most studies that have sought to link farm and operator characteristics to financial outcomes have relied on cross-sectional data. The availability of panel data makes it possible to explore how operator and operation characteristics affect farm performance over time. However, it is rare that panel data sets include information on farm financial performance. Consequently, most studies of business performance using panel data have sought to explain variation in farm survival (or exit) rates or variation in farm growth rates conditional on business survival. Weiss (Reference Weiss1999) found that for Austrian farm households, initial farm size and the age, schooling, and sex of the farm operator were all significant determinants of farm growth and survival. In particular, he found that smaller farms are found to grow much faster than larger farms, presumably because smaller have higher returns to scale. Kimhi and Bollman (Reference Kimhi and Bollman1999) found that the effect of initial farm size on survival depends on the national context: the exit probability decreases with farm size in Canada but increases with size in Israel.
Among older operators in particular, the decision to exit or disinvest from farming can be influenced by retirement and farm succession choices. Retiring from farming may involve intergenerational transfers of farm assets in order to secure retirement income for the current farm operators (Pesquin, Kimhi, and Kislev, Reference Pesquin, Kimhi and Kislev1999). Mishra, El-Osta, and Shaik (Reference Mishra, El-Osta and Shaik.2010) examined the determinants of farm succession in the United States and found that succession decisions were affected by household wealth and the operator’s age, educational attainment, and off-farm work choices. Mishra and El-Osta (Reference Mishra and El-Osta2008) also found that government farm policy had a significant influence on farm succession decisions. Diwisch, Voithofer, and Weiss (Reference Diwisch, Voithofer and Weiss2009) investigated the effect of past and planned successions on employment by Austrian farm businesses. The authors found no significant difference in employment growth between farms that planned to transfer the firm in the next 10 years and those that did not. In contrast, past succession exerted a significant and positive employment growth effect. Griffin, Hartarska, and Nadolnyak (Reference Griffin, Hartarska and Nadolnyak2019) used Census of Agriculture data to estimate the probability of retirement-age farmers’ exit and disinvestment for the 1992–2012 period. They found that larger farms were less likely to exit but more likely to disinvest and scale down the operation.
Other research using panel data has focused on the influence of government farm payments on farm growth and survival. Using U.S. Census of Agriculture data, Key and Roberts (Reference Key and Roberts2006) found that government payments were positively associated with the likelihood of farm survival and with farm size growth—and that the magnitude of this association was generally greater for larger farms. Also using Census data, Key and Roberts (Reference Key and Roberts2007) estimated the effect of government payments on the probability of a farm business failure using a Cox proportional hazards model. They found that an increase in government payments has a small but statistically significant negative effect on the rate of business failure. Storm, Mittenzwei, and Heckelei (Reference Storm, Mittenzwei and Heckelei2015) estimated a spatial model to explain the survival of Finnish farms based on the characteristics of the farm and of neighboring farms. The authors found that while direct payment increase the probability of survival, the effect is mitigated by the fact that a farm’s survival is negatively affected by its neighbors’ receipt of payments.
Some studies of beginning farmers that have used panel data have focused on the relationship between operator age and farm size growth. Using Census of Agriculture data, Katchova and Ahearn (Reference Katchova and Ahearn2016) found that farms operated by older beginning farmers tend to be smaller and do not tend to grow as much over time. Their results show that it is mostly young farmers, as opposed to all beginning farmers, who rapidly expand their farm operations after entering agriculture. Williamson (Reference Williamson2017) also explored how differences in the initial ages of farmers affect farm finances and assets. The study used a synthetic panel of data consisting of age cohorts of beginning farmers and compared them in two time periods. His results indicate farmers who are under 45 years old saw a much larger increase in production, assets, and liabilities than older farmers. A drawback to the cohort approach is that it only provides information on surviving operations, so is not able to identify the factors that caused some farm businesses to fail.
More recently, Nadolnyak, Hartarska, and Griffi (Reference Nadolnyak, Hartarska and Griffin2019) used farm-level panel data from the US Census of Agriculture to examine how weather variability, along with other economic and demographic factors, affect beginning farm exits. The authors found that profitability and off-farm employment does not affect beginning farm exit rates, but farm size (sales) lowered the probability of exit. The study also found that weather impacts on exits were mostly attributable to droughts.
This study contributes to the literature by examining the determinants of beginning farm success, where a farm is considered successful if it remains in business without declining in size (value of real estate assets) over a 5-year period. Because this definition of success requires that a farm business both survive and grow, it likely provides a more accurate measure of business success than either the survival rate or growth rate alone. This definition also allows for an interpretation of the net effect on success of factors that have opposing effects on farm survival and farm expansion.
Empirical Methods
The data used in the study and described in the next section consist of pooled 2-year panels. In each panel, a farm observed period t may or may not be observed again period t + 1. Farms that are observed in consecutive periods are classified as having survived. The following probit regression models are estimated for all operations observed in period t:
 $${\rm{P}}({D_{it + 1}}|{X_{it + 1}}) = \Phi (\alpha + X_{it}^{^\prime }\beta )$$
where P denotes probability and x03A6 is the standard normal cumulative distribution function, D it+1 is a dichotomous outcome variable (1/0) that depends on conditions observed in period t + 1 and X it are control variables observed in the initial period t. Maximum likelihood is used to estimate the parameters α and β. The three dichotomous outcome variables indicate whether, between t and t + 1, a farm (1) survived in business; (2) had positive business growth, or (3) had success (remained in business and had positive business growth). These outcome variables are defined in detail in the next section. The probits for the survival and success outcomes are estimated for all farms observed in period t. The probit for the positive growth outcome is estimated only for farms that were observed in periods t and t + 1.
Data
The farm-level panel data used in this study are drawn from the Census of Agriculture conducted in 2007, 2012, and 2017. The Census of Agriculture is administered by the USDA National Agriculture Statistics Service (NASS) with the aim of collecting information from all agricultural operations that produce, or would normally produce and sell, at least $1,000 of agricultural products per year.Footnote 1
Farm operators are matched across consecutive Censuses (2007–2012, and 2012–17), and the two panels are pooled. To focus on beginning farms, the sample is limited to farms on which the principal operator reported 10 or fewer years of farming experience in the initial period. Since beginning farms are defined based on the characteristics of the principal operator, the NASS “Principal Operator Identification” is used to track farms across time.Footnote 2
Some USDA policies that target beginning farms impose farm size limits on program participants. For example, to qualify for some FSA loans as a beginning farmer, the operator cannot own a farm or ranch greater than 30% of the average size farm in the county (USDA-FSA, 2018). To better understand the determinants of success of smaller-scale operations, the study separately analyzes two categories of farms: “small” farms, which initially (in the first period observed) have less than $250,000 in farm real estate assets (the value of land and buildings in constant 2018 dollars), and “large” farms with initial assets between $250,000 and $10 million. Farms with more than $10 million in initial real estate assets are dropped from the analysis to reduce sample heterogeneity.
Table 1 reports summary statistics for the variables used in this study for farms in the small and large size categories. The first three rows in the table show the three binary outcomes: survival, positive growth, and success.Footnote 3 “Survive” indicates whether a farm responded to the subsequent census conducted 5 years later. “Grow” indicates whether a farm had non-negative growth in the inflation-adjusted value of its farm real estate assets between censuses. “Success” indicates whether a farm both survived and grew between censuses. In some cases, an operator may not respond to the census even though the farm remains in business. For this reason, the observed farm business survival and success rates are lower than the actual survival and success rates.
Sample statistics: small-scale and large-scale beginning farms

Notes: All variables are dichotomous indicators (1/0) unless otherwise noted. Agricultural program payment intensity = agricultural payments / (agricultural payments + total value of production). Small-scale farms are those with less than $250,000 in farm real estate assets (constant 2018 dollars) in the first period. Large-scale farms are those with initial real estate assets between $250,000 and $10 million.
Source: USDA-NASS Census of Agriculture, 2007, 2012, 2017.
Variables used to explain likelihood of farm survival, positive growth, and success include the initial (first period) characteristics of the operation and operator. Farm size, which has been shown in past studies to be correlated with both farm survival and growth, is measured using the inflation-adjusted value of real estate assets used on the farm.Footnote 4 Land tenancy is included as an explanatory variable because it is correlated with net worth and hence, access to credit—farmers who inherit a relatively large amount of land will be better able to access loans and expand production compared to similar farms that rent in a greater share of their land. Farms are placed into one of three land tenancy categories, based on whether the operator: (1) rents out more land than rents in, (2) does not participate in land rental markets (or rents out and rents in the same amount), or (3) rents in more land than rents outs.
As discussed in the previous section, past studies have found a link between government agricultural payments and farm survival and growth for crop farms. This study examines whether this also holds for beginning farmers and whether payments affect business success. The importance of government payments to the farm is measured using an intensity index defined as the value agriculture payments divided by the sum of the value of payments plus the total value of production.Footnote 5 This index has the advantage of being bounded by zero and one, which eliminates outliers that could potentially skew parameter estimates.
We expect survival and growth to increase with farm productivity, as greater productivity is often associated with higher profits and superior managerial skills. Farm productivity is measured as the ratio of output (value of production) to real estate assets.Footnote 6 If net returns are proportional to the value of production, then this productivity ratio will be proportional to the return on assets.Footnote 7
Other farm characteristics included as explanatory variables include a family farm indicator (as opposed to a non-family partnership, corporation or other organization arrangement); a commodity specialization categorical variable (there are five crop types and five livestock types); and a location categorical variable (for the nine USDA-ERS Farm Resource RegionsFootnote 8 ).
In terms of marketing arrangements, we include an indicator of whether the farm has DTC sales. DTC marketing—where producers engage with consumers face-to-face at roadside stands, farmers’ markets, pick-your-own farms, on-farm stores, and community-supported agricultural arrangements (CSAs)—is a substantially different business model from traditional marketing and is one that could help some beginning farmers survive and prosper in a risky and competitive business environment. We compare the farm business survival and growth rates of farms with DTC sales to those who market through traditional channels, such as grain distributors, processors, and wholesalers. As we discuss later, differences in survival and growth rates could be explained by attributes of DTC marketing that result in different levels of debt, farm income risk, and labor requirements, or possibly by differences in off-farm employment opportunities or preferences for farm versus nonfarm work.
Operator characteristics hypothesized to affect farm success include age, gender, race, and ethnicity (Hispanic/non-Hispanic). Gender, race, and ethnicity are included to capture unobserved factors that might be correlated with the operator’s access to credit, off-farm employment opportunities, participation in agricultural programs, education, etc. Also included are two variables that characterize the farm household’s relationship to off-farm employment. The first indicates whether farming is the operator’s main occupation. The second is the self-reported share of household income that comes from farming. These variables are correlated with each other but provide different information.Footnote 9 The first provides information only about the operator, while the second provides information about both the operator household—including the spouse (most beginning farm operators are married, and a large share of spouses work off-farm) (Key and Lyons, Reference Key and Lyons2019). Finally, we include a measure of local off-farm employment opportunities, which is measured as the percentage point change in the Bureau of Labor Statistics county unemployment rate in the Census years.
To test for possible multicollinearity, the Variance Inflation Factors (VIFs) were calculated for each variable. All VIF values were below 5 indicating the multicollinearity is not a problem with any of the variables.
Results
Tables 2 and 3 compare the survival, positive growth, and success rates for small-scale beginning farms based on selected farm and operator characteristics, respectively. Among the different categories of farms considered, success rates are higher for those that receive government payments, have relatively high productivity, have DTC sales, produce grains, oilseeds, dry beans, or dry peas, or produce milk or dairy products. In terms of producer characteristics, success rates are higher for farmers who are younger, or white, or male. These statistics could be useful to policy makers and others who seek to target groups based on their business performance.
Survival, growth and success rates by farm characteristics: small-scale beginning farms

Notes: Small-scale farms are those with less than $250,000 (constant 2018 dollars) in farm real estate assets in the initial period.
Source: USDA-NASS Census of Agriculture, 2007, 2012, 2017.
Survival, growth and success rates by operator characteristics: small-scale beginning farms

Notes: Small-scale farms are those with less than $250,000 (constant 2018 dollars) in farm real estate assets in the initial period.
Source: USDA-NASS Census of Agriculture, 2007, 2012, 2017.
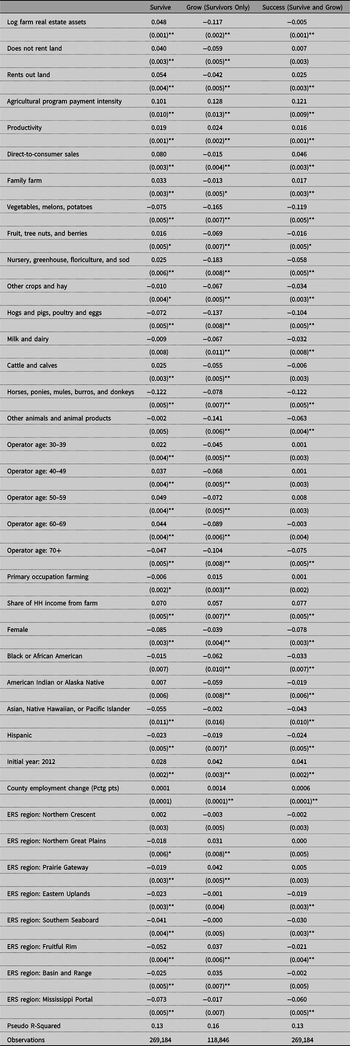
The comparisons in Tables 2 and 3 quantify success rates for groups with similar characteristics, but do not necessarily reveal how the group’s shared attributes affect farm performance since confounding factors will also vary across groups. For example, as Table 2 shows, larger farms are more likely to survive than smaller farms and farmers who receive agricultural payments are more likely to survive than farmers who do not receive payments. However, since operators of larger farms are more likely to receive payments, it is not clear from the summary statistics whether, or by how much, each factor is affecting farm survival. Probit regressions are used to determine the marginal effects of individual variables on the likelihood of farm survival, positive growth, and success, while holding other exogenous factors constant. Tables 4 and 5 show the estimated marginal effects at the means for small- and large-scale beginning farms, respectively.Footnote 10 Classification tables corresponding to the probit regressions in Tables 4 and 5 are shown in Appendix Table A1.
Probit regression marginal effects: small-scale beginning farms

* p < 0.01;
** p < 0.001.
Notes: Small-scale farms are those with less than $250,000 (constant 2018 dollars) in farm real estate assets in the initial period.
Source: USDA-NASS Census of Agriculture, 2007, 2012, 2017.
Probit regression marginal effects: large-scale beginning farms

* p < 0.01;
** p < 0.001.
Notes: Small-scale farms are those with less than $250,000 (constant 2018 dollars) in farm real estate assets in the initial period.
Source: USDA-NASS Census of Agriculture, 2007, 2012, 2017.
The regression results (Tables 4 and 5) are qualitatively consistent with the effects implied by the mean values displayed in Tables 2 and 3. Since the estimated coefficients obtained for small and large farms are generally similar, we focus the discussion on small-scale beginning farms and note the differences with larger operations when they are substantial. For small-scale beginning farms (Table 4), farm size is strongly correlated with survival: doubling farm assets increases the probability of surviving by about 5 percentage points.Footnote 11 Larger farms may have a higher survival rate because larger farms are more profitable and have higher household income and wealth and are hence more resilient to economic shocks (Whitt, Todd, and MacDonald, Reference Whitt, Todd and MacDonald2020). While the survival rate increases with scale, among those farms that survive, farm size is negatively correlated with positive growth: doubling farm size reduces the likelihood of positive growth by about 11.6 percentage points. Larger farms might be less likely to expand because they are already closer to an optimal scale, and therefore, there is less incentive to expand production compared to smaller farms. With scale being positively correlated with survival and negatively correlated with growth, the effect of scale on success (survival and positive growth) is limited: size has a very small negative association with success.
The results also show that land tenancy arrangements matter for farm business performance. Compared to similar farmers who rent in land (the missing category), those who do not rent in land or who rent out land have survival rates that are about 4 and 5 percentage points higher, respectively. Those who rent out land might have higher survival rates because they earn rental income which can provide a financial cushion during periods of low prices or yields. In contrast, farmers who rent in land likely face higher per-acre costs in the form of rent, which makes them more vulnerable to financial shocks.
Renting out farmland is associated with a higher survival rate, but a lower probability of positive growth. Operators who rent out land may have less time to work on their farm because they have better off-farm employment opportunities. With less time available to work on-farm, farm expansion may be more difficult. Tenancy arrangements, therefore, have conflicting effects on the components of success: farmers who rent out land are more likely to survive but less likely to grow that similar farmers who rent in land. In net, the results indicate that farmers who rent out land have a business success rate that is 3 percentage points higher than similar farmers who rent in land.
The results also show that farmers who depend more on government agricultural payments tend to have better business performance. Increasing the “payment intensity” (agricultural payments as a share of payments plus the total value of production) increases survival, positive growth, and success rates. Increasing the payment share by 10 percentage points is associated with a 1.2 percentage point increase in the likelihood of success. These findings are consistent with earlier research that found that agricultural program payments are associated with an increase in the likelihood and duration of farm business survival of crop farms (Key and Roberts, Reference Key and Roberts2006, Reference Key and Roberts2007). The results of this study show that this relationship also holds for beginning farmers and that the combined effects of payments on survival and growth also increase the likelihood of farm business success.
There are several mechanisms through which agricultural payments could improve farm outcomes. Higher government payments raise net returns, which could reduce the likelihood of financial insolvency and allow farms to remain in business longer. Higher payments may also make agriculture more profitable relative to alternative occupations, which could reduce the incentive to quit farming, especially if off-farm occupations are in different locations or require a significant degree of specialization. The finding that higher payments allow farms to expand in size could mean that some farmers face binding liquidity constraints that inhibit their farms from achieving an optimal scale and that payments relieve these constraints. Commodity program payments provide cash, some degree of insurance (due to links with commodity prices), and perhaps also a means to leverage greater resources from lending institutions, all of which may lower farmers’ capital costs. Lower capital costs may allow farms to more easily adopt new technologies and expand in scale.
As expected, farm productivity (value of production relative to assets) is positively and significantly correlated with survival, growth, and success. More productive farms are generally more profitable and hence better able to cope with financial shocks and have the financial resources to expand production. The productivity index value for a small beginning farm has a mean value of 0.16 with a standard deviation of 0.50 (Table 1). The results imply that increasing the average farms’ productivity value by one standard deviation to 0.66 would raise the survival rate by 1 percentage point, the growth rate by 1.2 percentage points, and the success rate by 0.8 percentage points.
For small-scale beginning farms, using DTC markets is associated with an 8 percentage point increase in the survival rate. It is possible that DTC sales provide a relatively secure income stream, which increase survival rates. Income from DTC marketing depends on the margin between the wholesale and retail price. Even when the farmer’s input and output prices vary, the markup between the wholesale and retail prices tends to be relatively stable. Hence, the additional income that farmers can earn by selling directly to consumers should be less influenced by price fluctuations, making this income less risky.
While farmers who directly market to consumers are more likely to continue farming than those who do not, they were about 1.5 percentage points less likely to have positive asset growth. Farms with DTC sales might be less likely to expand because of market constraints. DTC markets may have a limited size within a local region, making it more challenging for farms to expand in scale without substantial additional travel and marketing costs.
Despite the small negative effect on farm size growth, the relatively large positive effect on survival causes DTC sales to have a positive association with farm business success: farms with DTC sales were about 4.6 percentage points more likely to succeed than similar farms without DTC sales. This effect on success is larger for small farms compared to large farms (Table 5). For larger operations, having DTCs resulted in smaller effect on growth and a larger negative effect on survival.
Being organized as a family farm was associated with a higher rate of survival, but a lower likelihood of farm growth. Unlike family farms, partnerships (the most common non-family farm arrangement) might lower survival rates because they are vulnerable to dissolution from any single partner. Higher survival rates and slower growth for family farms might be explained by different attitudes toward farm work by the farm operators. Researchers have found evidence that non-pecuniary benefits from self-employment explain why small business owners remain in business despite earning less income (Hamilton, Reference Hamilton2000). It is possible that non-pecuniary benefits from farming (e.g., greater autonomy, independence, and lifestyle factors) provide operators of family farms a greater incentive to remain in business even with lower business expansion possibilities, compared to non-family farms that may be organized solely for pecuniary reasons (Howley, Reference Howley2015). Because of their higher survival rates, family farms are about 2 percentage points more likely to be successful than otherwise similar non-family farms.
Commodity specialization is an important determinant of farm performance. There are substantial differences in performance rates between farms having different specializations: with survival, positive growth, and success rates varying by about 10, 18, and 12 percentage points, respectively. Holding all other characteristics constant, farms that produce “grains, oilseeds, dry beans, or dry peas” (the missing category) have the highest probability of success. Compared to that missing category, being a producer of “vegetables, melons, potatoes, or sweet potatoes” or a producer of “hogs and pigs, poultry or eggs” or a producer of “horses, ponies, mules, burros or donkeys” reduces the success rate by 10 to 12 percentage points. While there could be numerous factors, including differences in pest, climate, and market conditions that cause variation in farm performance across commodity groups, it is plausible that insurance availability plays a role. The categories associated with the highest (lowest) success probability are comprised of commodities with historically higher (lower) Federal crop insurance programs participation rates. Crop insurance may reduce the risk of default and bankruptcy and result in higher survival rates. Greater crop insurance coverage might also enhance farmers’ access to credit with which to expand production (Ifft, Kuethe, and Morehart, Reference Ifft, Kuethe and Morehart2015).
The results indicate a U-shaped relationship between the operator’s age and the likelihood of farm survival. Holding all else constant, farms with operators younger than 30 (the missing category) or over 69 have a lower likelihood of surviving than farms with operators between the ages of 30 and 69. The youngest farmers may be less like to survive because they are the most financially vulnerable to financial shocks—they tend to be more highly leveraged and have accumulated less net worth. As was discussed in the literature review, the oldest farmers probably have higher exit rates because they are more likely to retire or leave farming for health reasons.
There is a monotonic negative relationship between age and the likelihood of positive growth. Compared to having an operator under 30 years old, having an operator age 40–49 reduces a farm’s likelihood of positive growth by about 7 percentage points, while having an operator over age 69 reduces the likelihood of positive growth by about 10 percentage points. Older beginning farmers start farming later in life so have had more time to accumulate net worth. Consequently, older farmers may be able to start a farm closer to their desired scale and so they would have less incentive to expand farm size. Older farmers also have a shorter lifetime investment horizon, so may find it less advantageous to incur the sunk costs associated with increasing their farm size.
Operator age does not have a large effect on the probability of success except when the operator is 70 or older. Farms with these older operators are about 7.5 percentage points less likely to be successful compared to farms with younger operators. Farms having the oldest operators have a lower likelihood of success because they are less likely to survive in business and less likely to have positive growth.
Whether or not the principal operator had farming as his or her main occupation had no significant effect on the likelihood of farm success. In contrast, if the farm household is more dependent on farm income, then the farm business is somewhat more likely to survive, to have positive growth, and to succeed. Increasing the farm’s share of household income by 10 percentage points increases the likelihood of success by about 0.8 percentage points. Being more dependent on farm income might incentivize the operator to provide additional effort and attention to assuring the success of the farm.
Several demographic characteristics of the principal operator have a significant influence on farm business performance. Having a female operator is associated with an 8.5 percentage points reduction in the survival probability, a 4-point reduction in the likelihood of positive growth, and an 8-point reduction in the likelihood of success, holding other observable factors constant. The race of the primary operator had a relatively small effect on the farm outcomes. Non-white or Hispanic operators had success rates that were about 2–4 percentage points lower than similar farms with white operators.
The year indicators are included in the model to adjust for aggregate changes in the national economy and to adjust for changes in the Census methodology that could have affected the way farmers were tracked over time. The coefficients indicate that the likelihood of farm survival, positive grow, and success was 3–4 percentage points higher in 2012–17 compared to 2007–12. This is somewhat counterintuitive since net cash farm income decreased substantially over the later period. However, the Great Recession occurred during the 2007–12 period, and unemployment rates were unusually high. There is substantial evidence that the nonfarm economy is an important determinant of farm bankruptcies (Dinterman, Katchova, and Harris, Reference Dinterman, Katchova and Harris2018; Shepard and Collins, Reference Shepard and Collins1982). This is reflected in farm Chapter 12 bankruptcy rates, which increased substantially from 2008 to 2011 (Dinterman, Katchova, and Harris, Reference Dinterman, Katchova and Harris2018). Beginning farmers are more reliant on off-farm employment for household income than are more experienced operations (Key and Lyons, Reference Key and Lyons2019). Contraction in the macroeconomy may have contributed to higher farm exits and slower farm growth in the wake of the Great Recession.
The importance of the nonfarm economy is also reflected in the positive coefficients associated with the county employment change. An increase in the county employment rate indicates improving off-farm employment opportunities. While the results do not indicate that changes in the local employment rate affect farm survival, an improving local job market is associated with a greater likelihood of positive farm growth rates and farm business success. This suggests that farmers are more inclined, or better able, to expand their operations when the local economy is improving. This finding seems to contradict the hypothesis that more rapid local economic growth “pushes out” farming and discourages farm growth. Instead, local job growth may allow for greater off-farm employment and higher household income, which can lead to more on-farm investment (Key, Reference Key2020). Local economic growth might also be associated with expanding local and DTC agricultural market opportunities.
In terms of location, having a farm in the Heartland and Northern Crescent regions is associated with significantly higher survival rates; while being in the Northern Great Plains, Prairie Gateway, Fruitful Rim, or Basin and Range regions is associated with higher probabilities of growth. Interestingly, there was no regional overlap between high survival and high positive growth rates. In fact, the regions associated with the highest rates of positive growth had among the lowest survival rates. It seems plausible that at the regional level, farm survival and growth are in tension. Farms need additional land in order to expand and the main source for this land is farms that are exiting production. Hence, in regions where there are relatively few farms exiting, fewer farms will be able to grow.
In terms of success, the results show that the regional effects on survival rates outweighed the effects on growth. Being located in the Eastern Upland, Southern Seaboard, and Fruitful Rim regions reduced a farm’s success rate by 2–3 percentage compared to being located in the Heartland, Northern Crescent, Northern Great Plains, Prairie Gateway, or Basin and Range regions. Being located the Mississippi Portal reduced a farm’s success rate by about 6 points compared to the same set of regions. Further research is needed to understand what factors (not controlled for in the model) are responsible for these differential regional effects.
As a robustness check, we explore how the growth and success probit regression results change using total value of production instead of real estate asset value as a measure of farm size (Appendix Table A2). As can be seen by comparing the results to Tables 4 and 5, the coefficients are very similar in magnitude and in statistical significance. In fact, out of the 76 coefficients shown in Table 2, only 1 statistically significant coefficient changed sign when using the alternative farm size measure.
We conclude this section by noting that the regression estimates could potentially suffer from selection bias if unobserved factors correlated with the outcomes were not adequately controlled for by the observable farm and operator characteristics. For example, the estimated relationship between payments and farm success could be biased if missing variables affect both the likelihood that farmers received agricultural program payments and the likelihood of business success, and if these missing variables were not sufficiently correlated with the observable variables. Future work could test the robustness of the estimates using experimental, or more feasibly, quasi-experimental econometric techniques.
Conclusion
This study compared the survival, positive growth, and success rates of small-scale beginning farms categorized by selected farm and operator characteristics. These results could be useful for policy makers who seek to target beginning farmers who have relatively low levels of business success and might therefore be considered in greater need of assistance or more likely to benefit from program interventions. The types of beginning farmers found to have lower business success rates include those who do not receive agricultural program payments, those not participating in DTC markets, producers of specific commodity groups, women, and members of socially disadvantaged racial groups.
The study also sought to understand how particular farm or operator characteristics influence the probability of farm business survival, growth, and success, holding other factors constant. The regression results point to possible opportunities for raising beginning farmer success rates. In particular, the findings suggest that efforts to increase farm productivity, farmer participation in DTC marketing, and the share of farmers who receive agricultural program payments could improve outcomes for beginning farms. Studies have shown that enhanced training, education, outreach, and technical assistance programs can facilitate adoption of new and more efficient technologies and thereby increase farm productivity (e.g., Anderson and Feder, Reference Anderson and Feder2003; Birkhaeuser, Evenson, and Feder, Reference Birkhaeuser, Evenson and Feder1991). Additionally, credit constraints have been shown to limit farm size, suggesting credit programs targeting beginning farms could help these operations obtain a more efficient scale of production (Briggeman et al., Reference Briggeman, Towe and Morehart2009). Promoting the formation and expansion of DTC sales, through efforts such as the USDA Local Food Promotion Program, could increase the number of beginning farmers who sell directly to consumers, as could targeting such programs toward beginning farmers. More active and targeted outreach efforts could increase beginning farmer participation in USDA programs that provide agricultural payments.
Some of the study’s findings raise questions for future research. Future work could explore why farm business success rates vary widely across commodity specialization categories, even after controlling for major operation and operator characteristics. To what extent can this variation be explained by the availability of federal commodity insurance or other commodity-specific programs? Future research could also seek to understand the strong regional patterns of farm survival and growth that were revealed by the study. Are farms less likely to expand in regions where exit rates are low because there is less land available for rent or purchase in these regions? Research could explore the role of land availability for the growth and success of beginning farms and possibly shed light on ways to improve the transfer of land across generations to allow beginning farms to both survive and grow.
There remains substantial scope for exploring how the financial position of the farm household affects business success rates. For beginning farmers, the method by which farm assets were acquired is likely an important determinant of their success. Those who inherited land and other assets may be able to start farming in a strong financial position with little debt. For those who initiated production with few inherited resources, business success may hinge on access to sufficient credit. Future work could try to better understand how borrowing and farm household finances interact to influence business success rates. Linking the Census of Agriculture with administrative data or other data sets containing more detailed financial information could provide a way to address these important questions. Recently, a study by the National Academy of Sciences recommended that administrative data be better integrated into how information is collected about farms, including the Census of Agriculture (NASEM, 2019). The integration of administrative data could facilitate analyses of how programs influence farm business performance, in addition to having other potential benefits such as lower respondent burden, more accurate information collection, and greater information sharing across government agencies.
Acknowledgements
This research was supported by the U.S. Department of Agriculture, Economic Research Service. The findings and conclusions in this article are those of the author and should not be construed to represent any official USDA or U.S. Government determination or policy.
Financial support
This research received no specific grant from any funding agency, commercial, or not-for-profit sectors.
Conflict of interest
None.
Data availability
Data were obtained from the U.S. Census of Agriculture maintained by the USDA National Agricultural Statistics Service. Data can be obtained and used for research purposes, although access is subject to approval and a fee may be charged for access. See https://www.nass.usda.gov/AgCensus/ for details.
Appendix

Probit regression marginal effects: total value of production measure of farm size

* p < 0.01;
** p < 0.001.
Notes: Small-scale farms are those with less than $250,000 (constant 2018 dollars) in farm real estate assets in the initial period.
Source: USDA-NASS Census of Agriculture, 2007, 2012, 2017.


 Open access