


Background
Structural and functional changes in the frontal lobe have been implicated in late-life depression.Reference Taylor, Aizenstein and Alexopoulos1, Reference Alexopoulos2 Neuroimaging studies have demonstrated that older people with late-onset depression have higher rates of frontal lobe atrophy than controls, as well as their older counterparts with earlier-onset depression.Reference Almeida, Burton, Ferrier, McKeith and O'Brien3, Reference Dotson, Davatzikos, Kraut and Resnick4 White matter hyperintensities (WMHs), particularly those involving the frontal lobe, are closely associated with late-life depression and progression of WMHs is associated with poorer response to treatment.Reference MacFall, Payne, Provenzale and Krishnan5, Reference Herrmann, Le Masurier and Ebmeier6 It is proposed that these pathological changes in frontal lobe structure disrupt neural connections along frontostriatal circuits, which are particularly important in the regulation of mood and cognition.Reference Taylor, Aizenstein and Alexopoulos1, Reference Alexopoulos2 This is supported by neuroimaging studies demonstrating loss of functional connectivity,Reference Nobuhara, Okugawa, Sugimoto, Minami, Tamagaki and Takase7 and abnormal frontal lobe biochemistry,Reference Kumar, Thomas, Lavretsky, Yue, Huda and Curran8 as well as neuropathological studies demonstrating a reduction in frontostriatal neuronal cell volume, in depressed older people.Reference Almeida, Burton, Ferrier, McKeith and O'Brien3, Reference Lai, Payne, Byrum, Steffens and Krishnan9 Clinically, depression in later life is associated with presentations such as executive dysfunction and apathy, which are related to frontostriatal dysfunction.Reference Taylor, Aizenstein and Alexopoulos1, Reference Alexopoulos2 Depressed older people have demonstrated poorer scores on formal frontal lobe–related cognitive tests compared with controls,Reference Taylor, Aizenstein and Alexopoulos1 and late-life depression is also closely associated with other clinical syndromes where frontostriatal connectivity has been implicated, including gait disorders, dementia and urinary incontinence. The frontal lobe is particularly susceptible to damage by cerebral hypoperfusionReference Hoffmann10 and conditions affecting cerebral blood flow, such as systemic hypotension and orthostatic hypotension, have been shown to increase the risk of incident depression in older people.Reference Briggs, Kenny and Kennelly11, Reference Briggs, Carey, Kennelly and Kenny12 A hypothesised mechanism for this is via reduction in blood flow to the frontal lobe resulting in frontal WMHs and altered frontal lobe function.Reference Taylor, Aizenstein and Alexopoulos1 Cross-sectional single-photon emission computed tomography and magnetic resonance imaging (MRI) studies have shown frontal lobe perfusion deficits in older depressed participants when compared with controlsReference Navarro, Gastó, Lomeña, Mateos and Marcos13, Reference Lesser, Mena, Boone, Miller, Mehringer and Wohl14 and prospectively, reduced global cerebral perfusion measured by transcranial Doppler ultrasound is a predictor of greater depressive symptomology in older people with heart failure at 1-year follow-up.Reference Alosco, Spitznagel, Cohen, Raz, Sweet and Josephson15
However, studies to date examining the association between frontal lobe cerebral perfusion and depression have involved relatively small numbers and did not control for important clinical conditions such as heart disease or stroke. Studies have also utilised imaging modalities such as MRI and single-photon emission computed tomography, rather than techniques such as near-infrared spectroscopy (NIRS). NIRS provides a non-invasive index of cerebral perfusion based on the finding that light in the near-infrared spectrum penetrates the skull and allows measurement of oxyhaemoglobin and deoxyhaemoglobin concentrations in the brain.Reference Strangman, Boas and Sutton16 It is used extensively in cardiac and other surgery to measure intra-operative cerebral perfusion on a continuous basis, and is now available outside these setting as a validated, portable non-invasive bedside test.Reference Taussky, O'Neal, Daugherty, Luke, Thorpe and Pooley17 The aim of this study is to examine the association between clinically significant depressive symptoms and frontal lobe cerebral perfusion, measured by NIRS, in a large cohort of community-dwelling older people, embedded within the Irish Longitudinal Study on Ageing (TILDA). Furthermore, we will determine how conditions such as orthostatic hypotension (OH) and hypotension modify this relationship. The comprehensive TILDA data-set also allows us to control for important competing covariates such as heart disease, stroke and antidepressant use.
Method
Ethics
The study was approved by the Faculty of Health Sciences Research Ethics Committee at Trinity College Dublin (REC Ref: 1/10/List 37) and all participants gave informed written consent. All experimental procedures adhered to the Declaration of Helsinki. All assessments were carried out by trained research nurses.
Study design
This is a cross-sectional study examining the association between clinically significant depressive symptoms and frontal lobe cerebral perfusion, measured by NIRS.
This study is embedded within TILDA, a large population-based study of a nationally representative sample of community dwelling older adults aged 50 years and over, with an initial study population of over 8000 participants.
The TILDA study design has been outlined previously.Reference Whelan and Savva18 We analysed data from the third wave of TILDA collected between 2014 and 2015. Participants were included in this study if they were aged 50 years or more, and underwent a complete health assessment at wave 3 including measurement of orthostatic blood pressure, frontal lobe perfusion by NIRS and screening for depressive symptoms.
Cerebral perfusion and orthostatic blood pressure
Real-time frontal lobe cerebral oxygenation was measured by the Artinis Portalite System, a portable, continuous-wave NIRS system, that uses spatially resolved spectroscopy, reporting absolute values, developed to measure cerebral perfusion.Reference Nieuwhof, Reelick, Maidan, Mirelman, Hausdorff and Olde Rikkert19 The NIRS technique, first described by Jobsis,Reference Bale, Elwell and Tachtsidis20 is based on the property of human tissue being relatively transparent to light in the near-infrared spectrum; by measuring changes in light absorption at different wavelengths, the oxygenation of tissue can be monitored continuously.Reference Colier, Binkhorst, Hopman and Oeseburg21
An optical sensor is placed on the participant's forehead, on the equivalent of the FP1 position in the international 10–20 electrode system, to measure changes in frontal lobe oxyhaemoglobin and deoxyhaemoglobin continuously. Tissue saturation index (TSI) was the primary measure used in this study, and is defined as (oxyhaemoglobin)/ (oxyhaemoglobin + deoxyhaemoglobin) × 100 and expressed as a percentage.Reference Jones, Chiesa, Chaturvedi and Hughes22
Continuous orthostatic blood pressure was measured in parallel with this by active stand, using a Finometer Midi (Finopres Medical Systems, Netherlands) as described previously.Reference Finucane, O'Connell, Fan, Savva, Soraghan and Nolan23 Briefly, participants lay in the supine position for 10 min in a quiet room, before standing in a timely manner (<5 s), and were aided by a research nurse to mobilise as necessary. Baseline values for TSI and blood pressure were an average of the readings between 30–60 s before standing. After standing, systolic blood pressure, diastolic blood pressure, heart rate, oxyhaemoglobin, deoxyhaemoglobin and TSI were monitored for a further 180 s. Throughout the recording, participants stood quietly.
OH was defined as a drop in systolic blood pressure ≥ 20 mm Hg or drop in diastolic blood pressure ≥ 10 mm Hg at 30 s compared with baseline blood pressure.Reference Freeman, Wieling, Axelrod, Benditt, Benarroch and Biaggioni24 Signal processing included a median average filter and 10 s moving average filter applied to both blood pressure and NIRS data. The sampling rate of the output data was 1 Hz. TSI was recorded continuously during the active stand but as OH is typically measured at 30, 60 and 90 s, we focused primarily on TSI at these time points in this study.
Depression
Depressive symptoms were assessed with the eight-item Centre for Epidemiological Studies Depression Scale (CES-D-8).Reference Briggs, Carey, O'Halloran, Kenny and Kennelly25 A score of ≥9 was used to define those with clinically significant depressive symptoms.Reference Briggs, Carey, O'Halloran, Kenny and Kennelly25 This short-form version of the longer 20-item scale was utilised in the TILDA study to reduce the time taken to conduct participant assessments, as well as to reduce respondent burden and fatigue, and previous work has confirmed its reliability in comparison to the 20-item CES-D in terms of internal consistency and factor structure within the TILDA cohort.Reference Briggs, Carey, O'Halloran, Kenny and Kennelly25, Reference O'Halloran AM and King-Kallimanis BL26 This was performed generally within 1 month of measurement of cerebral perfusion and orthostatic blood pressure.
Other measures
Detailed social and biological data were also collected. Seated systemic blood pressure was measured with an OMRON digital automatic blood pressure monitor (OMRON M10 IT Upper Arm BP Monitor). Chronic disease burden was defined as the number of chronic illnesses from the following list: liver disease, kidney disease, lung disease, cancer, arthritis and diabetes. Cardiac disease was defined as self-report of angina, prior myocardial infarct or cardiac failure. Self-report was also elicited for prior stroke. Cognitive impairment was defined as a Mini-Mental State Examination score of ≤24.
Medication records were examined with Anatomical Therapeutic Classification (ATC) codes (https://www.whocc.no/atc_ddd_index/), which are assigned to the active substances contained in medicines by the World Health Organization based on the therapeutic indication for the medicine, e.g. all antidepressants are listed under the ATC code N06A. Medication records were examined specifically for antidepressant use (ATC codes N06AB (selective serotonin reuptake inhibitors), N06AX16 (venlafaxine), N06AX21 (duloxetine), N06AX11 (mirtazapine), N06AX22 (agomelatine) and N06AX12 (bupropion)), as well as antihypertensive use (ATC codes C02 (antihypertensives), C03 (diuretics), C07 (beta-blockers), C08 (calcium-channel blockers) and C09 (agents acting on the renin–angiotensin system)).
Statistical analysis
Data were analysed by Stata version 14 (StataCorp for Windows). Normally distributed continuous variables were described as mean and s.d. and compared by Student's t-test. Categorical variables were compared by the chi-squared test.
Multilevel models with TSI as the dependent variable were used to compare TSI data across specific time points after standing, i.e. 30, 60 and 90 s, by depressive symptoms. These models assess the effect of the two-way interaction between depressive symptoms and time (depressive symptoms × time) on TSI, which accounts for the fact that TSI at 60 s is significantly influenced by TSI at 30 s, and so on.
Models were adjusted for covariates, which were chosen a priori based on their hypothesised role in modifying this relationship. Two models were tested initially: the first model was unadjusted; the second model was adjusted for age, gender, height and weight, and for clinical covariates such as cardiac disease, other chronic diseases, cognitive impairment, stroke and antidepressant use.
Further post hoc analyses were undertaken by testing further models by adding OH and systolic blood pressure separately to assess the role blood pressure behaviour had in modifying the relationship between depression and TSI. This allows us to analyse the three-way interaction (e.g. depressive symptoms × time × systolic blood pressure), which allows us to see whether the association between the two-way interaction of depressive symptoms × time and TSI differs depending on systolic blood pressure or OH.
To ensure findings were independent of antidepressant use, subgroups of participants taking these medications were excluded from the analysis and models were rerun to ensure that findings were not significantly different when these groups were omitted. A P value ≤0.05 was considered statistically significant.
Results
Almost 8% (209 out of 2616) of participants had significant depressive symptoms.
Depressed participants were more likely to be female and taking antidepressant medication. Baseline characteristics by depression status are shown in Table 1.
Table 1 Baseline characteristics of study sample by diagnosis of depression
Categorical variables were compared by chi-squared test. Normally distributed continuous variables were analysed by Student t-test. d denotes Cohen's d-test for effect size. CI, confidence interval; MMSE, Mini-Mental State Examination.
a. Blood pressure measured in seated position with a OMRON digital automatic blood pressure monitor.
b. Cardiac disease defined as self-report of heart attack, heart failure or angina.
c. Number of chronic diseases from the following list: liver disease, kidney disease, lung disease, cancer, arthritis and diabetes.
d. Stroke defined as self-report of prior stroke.
e. Cognitive impairment defined as Mini-Mental State Examination Score ≤24.
f. Orthostatic hypotension defined as drop in systolic blood pressure ≥20 mm Hg or drop in diastolic blood pressure ≥10 mm Hg at 30 s, 30 and 60 s, and 30, 60 and 90 s, respectively, compared with baseline blood pressure.
g. Antidepressants are those with Anatomical Therapeutic Classification codes N06AB, N06AX16, N06AX21, N06AX11, N06AX22 and N06AX12.
h. Antihypertensives are those with Anatomical Therapeutic Classification codes C02, C03, C07, C08 and C09.
There were no significant differences between groups in terms of prevalence of cardiac disease, blood pressure, history of stroke and current antihypertensive drug use.
Figure 1 demonstrates mean absolute TSI after standing by depressive symptoms, and Fig. 2 presents the mean TSI drop from baseline by depressive symptoms.
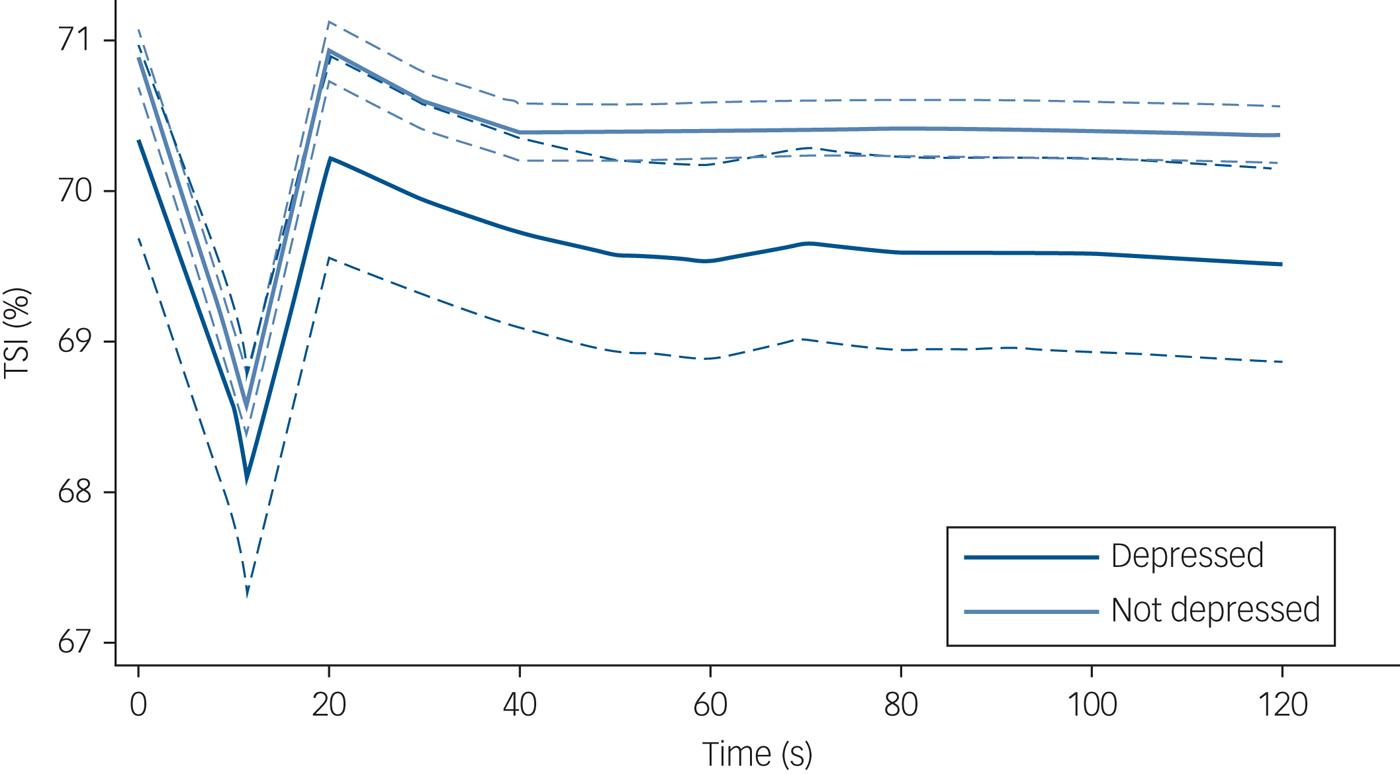
Fig. 1 Tissue saturation index (TSI) post-standing stratified by depression status. N = 2616 (depressed n = 209; non-depressed n = 2407). TSI was measured by near-infrared spectroscopy. Solid lines indicate mean TSI and dashed lines indicate 95% confidence interval, for a given time point post-standing. TSI at 0 s equates to baseline TSI, i.e. the average of the readings between 30–60 s before standing. Depression status was based on the eight-item Centre for Epidemiological Studies Depression Scale.
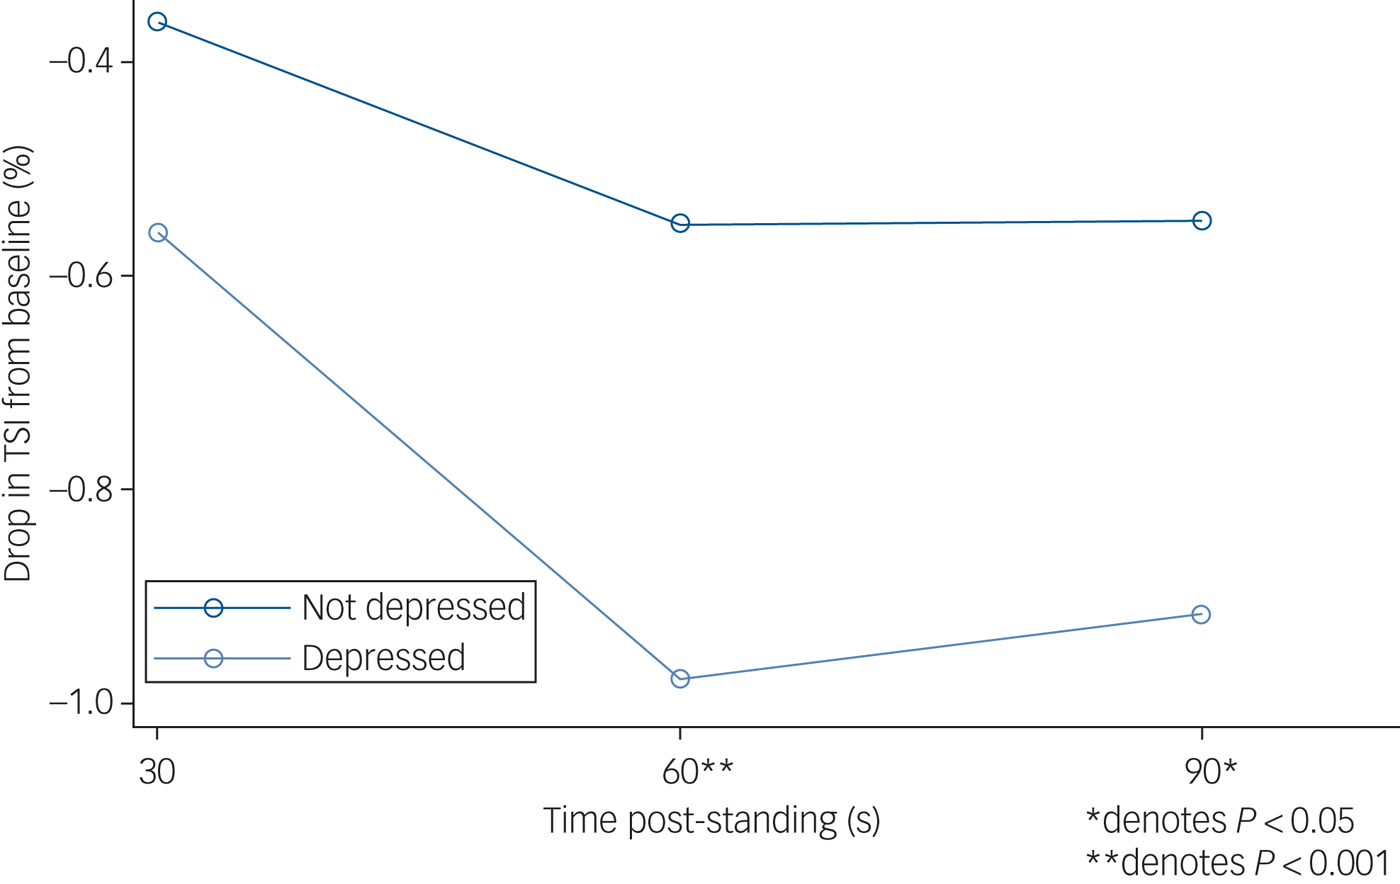
Fig. 2 Drop in tissue saturation index (TSI) from baseline after standing, by depression status. N = 2616 (depressed n = 209; non-depressed n = 2407). TSI was measured by near-infrared spectroscopy at baseline (lying down, denoted as 0 s, an average of the readings between 30–60 s before standing) and 30, 60 and 90 s post-standing. Results from multilevel modelling with TSI as the dependent variable nested within participant.
As presented in Table 2, the time × group interactions revealed significantly lower TSI in participants with depressive symptoms compared with the non-depressed group at both 60 and 90 s post-stand, with coefficients of −0.43 (95% CI −0.63 to −0.22, z = −4.11, P < 0.001) and 0.37 (95% CI −0.57 to −0.16, z = −3.54, P < 0.001), respectively. Controlling for age, gender and clinical covariates such as cardiac disease, stroke and antidepressant use did not significantly attenuate these associations. Depressive symptoms were not associated with TSI at 30 s post-stand in unadjusted models. Full outputs from regression models are shown in supplementary material available at https://doi.org/10.1192/bjp.2018.288.
Table 2 Multilevel linear regression models with tissue saturation index as dependent variable
N = 2616. Results from multilevel modelling with TSI as the dependent variable. Model 1 is unadjusted; model 2 controls for age, gender, height, weight, number of chronic diseases, cognitive impairment, cardiovascular disease, stroke and antidepressant and antihypertensive use. Orthostatic hypotension defined as drop in systolic blood pressure ≥20 mm Hg or drop in diastolic blood pressure ≥10 mm Hg at either 30, 60 or 90 s post-stand, compared with baseline blood pressure; systolic blood pressure measured twice in seated position with an OMRON digital cuff, with the average of values then taken. Reference value is systolic blood pressure 120–139 mm Hg. CI, confidence interval; OH, orthostatic hypotension; TSI, tissue saturation index.
a. Depressive symptoms × time denotes the two-way interaction between depressive symptoms and time after standing, allowing us to account for the fact that TSI at 60 s after standing is significantly influenced by TSI at 30 s and so on.
b. Depressive symptoms × time × OH denotes the three-way interaction between depressive symptoms, time after standing and OH and shows that the effect of the two-way interaction between depressive symptoms and time on TSI is not modified by the presence or absence of OH.
c. Depressive symptoms × time × systolic blood pressure denotes the three-way interaction between depressive symptoms, time and systolic blood pressure and demonstrates that the effect of the two-way interaction between depression and time on TSI is significantly affected by systolic blood pressure, i.e. it is only persistently significant (at 30, 60 and 90 s) in those with systolic blood pressure < 120 mm Hg.
d. Depressive symptoms × time demonstrates that results are not significantly changed when antidepressant users are excluded from analyses.
The depressive symptoms × time interaction was not modified by OH, suggesting that coexisting OH does not influence the relationship between depressive symptoms and TSI across these time points (see Table 2, model 3).
However, after addition of systolic blood pressure to model 5, depressive symptoms × time interaction was no longer significant, suggesting that systolic blood pressure may modify the association between depressive symptoms and frontal lobe perfusion. At 30, 60 and 90 s post-stand, there is a significant drop in TSI in those who had depressive symptoms with systolic blood pressure <120 mm Hg, compared with non-depressed participants with normal blood pressure. This is also the case for those who have depressive symptoms with high systolic blood pressure values (≥160 mm Hg) at 30 s (see Table 2, model 4).
Table 2 also demonstrates that findings remained robust after rerunning analyses with exclusion of all participants taking antidepressant medication.
Discussion
This study shows that, in a cohort of community-dwelling older people, participants with depressive symptoms had lower frontal lobe perfusion measured by NIRS after standing, and that depressive symptoms were associated with a more significant drop in frontal lobe perfusion at both 30, 60 and 90 s, when controlling for important covariates including prior stroke, heart disease and cognitive impairment.
Further analyses found that this association was not modified significantly by orthostatic hypotension and was also independent of antidepressant use. However, addition of systolic blood pressure to the analysis demonstrated that the association between depressive symptoms and TSI was only persistent across time points in those with systolic blood pressure < 120 mm Hg, suggesting that lower systolic blood pressure in depressed individuals may be the predominant driver of this association.
Although the degree of drop in TSI we demonstrate in this study is relatively small (0.5–1%), it is likely to be significant, given that prior work has shown that patients with spontaneous vasovagal syncope undergoing tilt table testing had a change in TSI of 4.5% (±3.0%),Reference Bachus, Holm, Hamrefors, Melander, Sutton and Magnusson27 and that the changes observed in this study are provoked only by changing from a supine to standing position, which is likely to occur multiple times per day/week.
These findings are supported by prior neuroimaging studies showing a similar association between late-life depression and both global and frontal cerebral perfusion.Reference Briggs, Kenny and Kennelly11, Reference Briggs, Carey, Kennelly and Kenny12 Smaller studies utilising NIRS have also demonstrated similar disparities between depressed and non-depressed participants when undertaking cognitive tasks.Reference Rosenbaum, Hagen, Deppermann, Kroczek, Haeussinger and Heinzel28, Reference Ma, Wang, Xu, Feng, Sun and Zhang29 However, our findings are cross-sectional and the direction of the relationship between frontal lobe cerebral perfusion and depressive symptoms remains uncertain, with limited longitudinal analyses to date.
There is also some evidence that remission of depression leads to subsequent improvements in cerebral blood flow in specific brain regions, including the frontal lobe, suggesting that frontal lobe perfusion deficits may form part of the clinical syndrome of depression in later life. Rather than representing a factor in the aetiology of depression, it may be that these deficits are related to reduced demand in the context of frontal hypoactivity, and that they may respond to appropriate therapy, such as antidepressants or electroconvulsive therapy.Reference Abi Zeid Daou, Boyd, Donahue, Albert and Taylor30, Reference Navarro, Gastó, Lomeña, Torres, Mateos and Portella31 Furthermore, the disparity in frontal lobe perfusion between depressed and non-depressed participants that we have demonstrated is significant only when standing, and not at rest. This may be related to the fact that when we stand, blood pressure and therefore cerebral perfusion generally drop, and although baroreflexes act to return these to baseline, blood flow is preferentially directed toward the most metabolically active brain regions and given the reduced frontal lobe activity seen in depression, blood flow may be compromised there temporarily.
Conversely, there is also some evidence that cerebral perfusion deficits may have a role in the aetiology of depression in later life. WMHs have been implicated in late-life depression and it has been shown that these lesions can be caused by strategic deficits in cerebral perfusion.Reference Brickman, Zahra, Muraskin, Steffener, Holland and Habeck32 Depression has been identified as a potential prodromal feature of dementia and pathological changes in brain perfusion have also been identified during this prodrome. Depression in later life has also been also been independently associated with other conditions where global cerebral hypoperfusion occurs, including unexplained falls and syncope.Reference Briggs, Kennelly and Kenny33 Additionally, conditions causing global cerebral hypoperfusion, such as orthostatic hypotension or chronically low blood pressure, have been shown to increase the risk of incident depression in older people.Reference Briggs, Kenny and Kennelly11, Reference Briggs, Carey, Kennelly and Kenny12
Understanding the nature of the link between incident depression and cerebral perfusion is important because cerebral blood flow is potentially modifiable. Factors such as alcohol intake, blood pressure and cognitive training may influence cerebral blood flow.Reference Mozolic, Hayasaka and Laurienti34 Exercise has also been shown to enhance cerebral blood flow in older people, as well as improving remission rates in late-life depression when added to standard therapy.Reference Penninx, Rejeski, Pandya, Miller, Di Bari and Applegate35 Other factors we have shown in this study that are independently associated with frontal lobe perfusion include heart disease and higher weight. Lower blood pressure, as well as OH, is significantly associated with lower frontal lobe TSI, whereas higher values of systolic blood pressure are also associated with higher TSI values at 90 s after standing.
There are some limitations of this study that should be noted. Depressive symptoms were assessed with the CES-D-8 rather than the gold-standard structured psychiatric interview. However, the eight-item CES-D has been well validated in the TILDA population.Reference Briggs, Carey, O'Halloran, Kenny and Kennelly25, Reference O'Halloran AM and King-Kallimanis BL26 Furthermore, data is cross-sectional with no prospective follow-up to determine a longitudinal relationship between cerebral perfusion and depressive symptoms. Information regarding chronic illnesses, such as diabetes or stroke, are based on self-report and may therefore be subject to self-report bias and under-reporting. Importantly, although we consider that cerebral hypoperfusion may cause frontal white matter disease, we do not have access to structural neuroimaging, such as MRI, which would help confirm this association. However, prior studies have demonstrated a significant association between cerebral perfusion and WMH burden.Reference Brickman, Zahra, Muraskin, Steffener, Holland and Habeck32
The strengths of this study include the well-described large population-based cohort of older people involved. This is the largest study to date examining the association between NIRS and depressive symptoms in older people and controls for important covariates such as cardiovascular disease and antidepressant use, which has not been a feature of studies, including those using neuroimaging techniques, up to now. This study also shows that it is feasible for a large population of older people to undergo bedside testing with NIRS for cerebral perfusion analysis. NIRS is non-invasive, portable and given the results we have demonstrated, could therefore potentially be used as a biomarker of either risk or response to treatment in late-life depression.
In conclusion, we have demonstrated that lower frontal lobe perfusion, related to lower baseline systolic blood pressure, is associated with clinically significant depressive symptoms in a cohort of community-dwelling older people. Given the recognised longitudinal association between lower blood pressure and depression in older people, this may represent a potential therapeutic target for prevention of incident depression.
Supplementary material
Supplementary material is available online at https://doi.org/10.1192/bjp.2018.288.
Funding
Financial support was provided by Irish Government, the Atlantic Philanthropies and Irish Life plc. These funders had no involvement in the study design, collection, analysis and interpretation of data, writing of the paper or submission for publication. Any views expressed in this report are not necessarily those of the Department of Health and Children or of the Minister for Health.


eLetters
No eLetters have been published for this article.