

Introduction
Glaciers are one of the most important fresh-water resources in arid regions of western China. The most direct method for studying variations of glaciers and glacial runoff is to monitor changes in important glacial parameters, such as the surface mass balance and the equilibrium-line altitude (ELA). However, substantial human and financial resources are required for each glacier so monitored. Thus, an important area of research in glaciology is to find ways of estimating glacier fluctuations in a valley, or in an entire mountain range, either by using monitored data on one or a few representative glaciers or by other methods, and then further to calculate changes in meltwater production due to fluctuations in glacier mass. Such studies are necessary for evaluating changes in water resources in glacierized mountainous regions.
Glacier fluctuations are caused by variations in the mass and energy balance at the Earth’s surface. These variations result from a combination of natural climatic evolution and forcing by anthropogenic greenhouse gas. Under appropriate circumstances, one can differentiate the roles played in glacier fluctuations by these two effects (Reference Haeberli and BenistonHaeberli, 1994). In addition, however, fresh water supplied by melting glaciers is of great importance to social and economic development in the valleys of smaller rivers in inland arid regions of western China such as the “Hexi Corridor” of the northern Qilian Shan and the Tarimu river basin in Xinjiang Uigur Autonomous Region (Reference ZhenniangYang, 1991). (The Hexi Corridor is an east–west basin-like plains region between the northern Qilian Shan to the south and the North mountains to the north.)
From the late 1950s to the late 1980s, scientists from the Chinese Academy of Sciences (CAS) conducted glacier studies on various scales in the western Qilian Shan (Academia Sinica, 1959; Reference Zichu, Guanghe and LilunXie and others, 1985; Reference Chaohai, Yuoping and MingxiLiu and others, 1992). However, research on large-scale glacier fluctuations in that region is rare. In this paper we re-evaluate glacier changes since the Little Ice Age (LIA) maximum in the western Qilian Shan region, including the valleys of the Shulehe river, Danghe river, Hala lake and others, by combining Landsat Thematic Mapper (TM) image data and geographical information system (GIS) methods. We have tried to combine data obtained by various studies over different time periods, and to develop a general model for glacier fluctuations in the region. Finally, we discuss the influence of glacier fluctuations on water resources in this inland arid area.
Previous research in the region
The Qilian Shan (36–39° N, 94–104° E) are located on the northeastern edge of the Tibetan Plateau. Their northern part is the Hexi Corridor of Gansu Province, and the southern part includes the Qaidamu basin and the Qinghai lake of Qinghai Province. The region of interest lies in the western part of the Qilian Shan, in the headwaters of rivers such as the Shulehe, Danghe and Haertenghe, and around Hala and other lakes (Fig. 1). Here, most peaks are > 4000 m a.s.l., and some in the southwest exceed 5000 m a.s.l. The Shulehe is the largest of the rivers in the western Qilian Shan, with a drainage area of 169 980 km2.
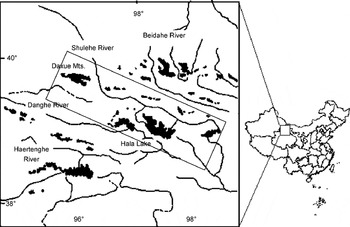
Fig. 1. Sketch map showing the western Qilian Shan, China.
Precipitation in the western Qilian Shan is 150–400 mm a−1, which is relatively low. In the Hexi Corridor region, it is even lower, 36–62 mm a−1. Precipitation in the western part of the Qilian Shan is influenced by westerly winds and the Asian Monsoon, and is characterized by large, concentrated storms in the flood season, infrequent and unsteady rains in spring and autumn, and rare events in winter. The period with greatest precipitation is May–August. In mountainous regions, 79–85% of annual precipitation falls during this period, and in the middle and lower reaches of the Corridor region, 63–70%. The month with the greatest precipitation is July, when 26–29% of the annual precipitation occurs in the mountains and 24–29% in plains.
An inventory of the glaciers in the western Qilian Shan was compiled in 1979 on the basis of aerial photographs acquired largely in 1956, but partly in 1957 and 1966, and topographic maps based on the aerial photographs. In the study area, this inventory lists 2171 glaciers, with a total estimated area and volume of 1734 km2 and 89 km3, respectively.
The runoff derived from glaciers is of great social and economic importance in this region. Using observational data on some glaciers in the region, Reference Qianzhao and XinyuanGao and Yang (1985) calculated that glacier meltwater accounts for 39–56% of the total river runoff in the western Qilian Shan.
Data and methodology
The data used in this study include the aerial photographs taken in 1956, 1: 50 000 topographic maps based on these aerial photographs, and one Landsat TM image acquired on 13 September 1990. Changes in the areas of glaciers during different time periods can be extracted from these images and maps, and then analyzed with GIS techniques.
Since there is no direct historical evidence of the variations of glaciers in the considered region, we must estimate the date of the LIA in the region. Currently, the LIA is considered to be one of several relatively cold periods in the Earth’s climate during the past several millennia. Scientists generally place the LIA between about AD 1500 and 1920 (Reference Xiangsong, Zongtai and YafengZhang and Wang, 1995). During that period, most glaciers advanced and formed obvious moraines. In many cases, there are three distinct end moraines. The chronology of the LIA in the Qilian Shan is derived mainly from proxy records, including tree-ring widths, historical documents and climatic and environmental records from ice cores (Reference Tandong, Zichu, Xiaoling and ThompsonYao and others, 1990; Reference Xiangsong, Zongtai and YafengZhang and Wang, 1995). These data reveal four obvious wet periods (AD 1495–1557, 1652–1772, 1850–90 and 1919–39) from the flood and drought records in the historical documents. Tree-ring width and ice-core δ18O records indicate that these wet periods correspond, for the most part, to periods of cold climate in the Qilian Shan during the LIA. Through comparison of these records, it was inferred that glaciers might have advanced during the periods AD 1428–1532, 1622–1740 and 1797–1865. All three periods were characterized by cold, dry climates initially, followed by cold, wet climates. As the AD 1622–1740 period, in particular, had a much colder and longer cold, wet interval than other cold periods, it is likely to have been especially favorable for glacier advance. For this reason, we refer to this period, corresponding to the formation of the outside ridge of the moraine triplet, as the LIA maximum. The triplet of moraine ridges is also used as evidence for an LIA age in regions without historical observational data in western China (Reference Yafeng and ShiyinShi and Liu, 2000).
The extent of glacierization in the western Qilian Shan during the LIA maximum is mainly determined through stereoscopic analysis of aerial photographs. In this way, we identified moraine ridges formed during the advance of the largest glaciers during the LIA (Fig. 2) and plotted these on topographical maps at a scale of 1: 50 000. Because some moraines have been eroded significantly, the positions of some former glacier tongues may not have been located precisely. In particular, in the western Qilian Shan the amplitude of LIA glacier fluctuations was usually small. However, the error in measured areas is considered to be <1 km2.

Fig. 2. Example showing the LIA moraine triplet of glacier 5y458G2 in Danghe river valley, western Qilian Shan. It was identified by stereoscopic analysis from aerial photo pairs acquired in September 1966 (from which 1:50 000 topographical maps were prepared). Clearly visible are the lower two moraine ridges and the three lateral moraines, on which the extents of LIA glacier distribution are based.
In the present work, the glaciers studied include those in the main stems of the Shulehe and Danghe rivers, parts of glaciers in the Beidahe river valley, and glaciers in the northern Hala lake valley (Fig. 1). The distribution of glaciers in these areas in 1956 was determined using the glacier inventory by digitizing the glacier boundaries on a series of 1:50 000 topographical maps (Reference Zongtai, Chaohai, Genxiang, Jianchen, Huian and PeiyingWang and others, 1981). Of particular interest were the glaciers for which data were available for the LIA maximum.
The extent of glaciers in 1990 was studied only in the Daxue range in the northwestern part of the Qilian Shan. The 1990 Landsat TM digital image was co-registered with the 1:50 000 topographical maps using image-processing software (Fig. 3). Ground-control points were selected that were easily identified on both topographical maps and the Landsat image. Enough were selected to reduce the rms error of the co-registered TM image and topographical maps to 0.56 pixels (Reference RichardsRichards, 1993). Because snow and ice surfaces are relatively easily distinguished from the surrounding rock, landscapes were simply divided into two types when classifying signatures on the image: snow-ice regions and non-snow-ice regions. Fresh snow was not a problem, as the image was taken in September, when melting gives way to new accumulation and the fresh snow tends to persist only on seasonal snow patches. These seasonal snow patches were identified and eliminated using the 1956 aerial photographs, the topographical maps and the glacier inventory data. Thus, the only snow-ice regions retained were those representing glaciers.

Fig. 3. TheTM/Landsat image showing the tongue of glacier 5Y458G2. The glacier tongue has narrowed and the left end of the glacier has retreated. Glacier variations during the 1950s and the 1990s extracted from the TM are constrained by the TM ground resolution which is suitable for glaciers larger than 0.01 km2 (3×3 pixels) considering the limitation of visual interpolations. The thick black line marks the boundary of the glacier.
For easier comparison of the extents of glaciers during different time periods, glacier margins were vectorized. In the GIS software, the resulting vectorized layer (or theme) was compared with the geometrically corrected TM image, and all glacier margins were adjusted so that they crossed through the centers of pixels. In addition, a mountain-ridge theme was created so that each individual glacier could be easily identified and compared. Finally, the boundaries of glaciers in 1956 and during the LIA maximum were manually digitized from 1:50 000 topographical maps using a Summagrid V digitizing tablet. By comparing boundaries during the three periods, we determined the changes in glacier extent between the LIA and 1956, and between 1956 and 1990. The results of this comparison are shown in Tables 1 and 2, respectively.
Table 1. Glacier-area changes between the LIA maximum and 1956 in the western Qilian Shan

Table 2. Glacier-area changes in the Daxue mountains, LIA–1956 and 1956–90. 5Y447 is located to the east, 5Y448 to the north, 5Y449 to the west and 5Y452 to the south of the Daxue mountains

Ice volume estimation
To study the impact of glacier fluctuations on water resources, we analyzed the volume changes of glaciers since the LIA. Volumes were calculated using an empirical relation between surface area, S, and mean thickness, ![]() . This empirical relation is based on thicknesses of six valley glaciers, five cirque glaciers, one hanging glacier, one ice cap and three cirque-hanging glaciers (area 0.46–165 km2) that were measured in 1981 in the Tien Shan. The measurements were made with a radar-sounding system designed at the Lanzhou Institute of Glaciology and Geocryology (LIGG), Chinese Academy of Sciences. In most cases there were, on each glacier, at least one longitudinal and two transverse profiles with enough sounding points to provide a useful estimate of
. This empirical relation is based on thicknesses of six valley glaciers, five cirque glaciers, one hanging glacier, one ice cap and three cirque-hanging glaciers (area 0.46–165 km2) that were measured in 1981 in the Tien Shan. The measurements were made with a radar-sounding system designed at the Lanzhou Institute of Glaciology and Geocryology (LIGG), Chinese Academy of Sciences. In most cases there were, on each glacier, at least one longitudinal and two transverse profiles with enough sounding points to provide a useful estimate of ![]() (Reference Zhen, Liangfu and ChaohaiSu and others, 1984; LIGG, 1986). In addition,
(Reference Zhen, Liangfu and ChaohaiSu and others, 1984; LIGG, 1986). In addition, ![]() was estimated for seven glaciers (area 0.1–7 km2) in the Qilian Shan using what we call the topographical method. In this method, the slope of the glacier bed beneath the entire glacier is assumed to be equal to that of the valley immediately in front of the glacier terminus. The thickness profile of the glacier was then taken to be the difference between the extrapolated bed profile and the surface profile. This method has not been verified by seismic or radar-sounding measurements or by drilling. Multiplying the resulting values of
was estimated for seven glaciers (area 0.1–7 km2) in the Qilian Shan using what we call the topographical method. In this method, the slope of the glacier bed beneath the entire glacier is assumed to be equal to that of the valley immediately in front of the glacier terminus. The thickness profile of the glacier was then taken to be the difference between the extrapolated bed profile and the surface profile. This method has not been verified by seismic or radar-sounding measurements or by drilling. Multiplying the resulting values of ![]() from both the Qilian and Tien Shan by the measured surface areas, S, of the respective glaciers yielded the volumes, V . The resulting relation between S and V is shown in Figure 4a. The curve can be described by the regression equation
from both the Qilian and Tien Shan by the measured surface areas, S, of the respective glaciers yielded the volumes, V . The resulting relation between S and V is shown in Figure 4a. The curve can be described by the regression equation ![]() (
(![]() in meters, S in km2, R
2 = 0.98) so that:
in meters, S in km2, R
2 = 0.98) so that:

Fig. 4. Relation between (a) glacier area (km2) and volume (km3) in the western Qilian and Tien Shan, and (b) glacier area and length in the western Qilian Shan. Volumes are estimated from radar thickness measurements on 16 glaciers in theTien Shan, and by using the topographical method on 7 glaciers in the Qilian Shan.
Data assembled by Reference Meier and BahrMeier and Bahr (1996) suggest a similar relation between area and volume, with an average exponent of 1.36. Their data suggest that the coefficient, and to a lesser extent the exponent, varies with location. In the present study, Equation (1) was used to calculate the ice volume and its change in the western Qilian Shan. Because we are most interested in changes in volume, errors in the estimate of ![]() will cancel to at least some extent. With this formula, the percentage of volume change for each individual glacier can be derived as:
will cancel to at least some extent. With this formula, the percentage of volume change for each individual glacier can be derived as:
The lengths and areas of glaciers were obtained directly from the glacier inventory of the mountain ranges (Fig. 4b). The resulting regression equation between length and area is:
This equation was used to assess length changes.
Changes in glacier area, volume and length
The area percentage change for different periods was calculated as the ratio of the total increase in area to the total area before the area change occurred. For example, the area percentage change from LIA to 1956 is taken as (S LIA − S 1956)/S LIA, and that from 1956 to 1990 as (S 1956 − S 1990)/S 1956. The same applies to calculation of volume and length changes.
Glacier-area changes between the LIA maximum and 1956 in the four river valleys are given in Table 1; those for glaciers analyzed in 1990 are shown in Table 2, for the two periods, LIA–1956 and 1956–90 (data in Table 1 exclude data from Table 2, and vice versa).
During the LIA maximum, the total area of the 866 measured glaciers was 906 km2, which is (from Tables 1 and 2) 118 km2 more than in 1956; thus the glacier area decreased by 13% between the LIA maximum and 1956. The decrease was greatest (22.5%) in the southern part of the western Qilian Shan, and second largest (21%) in the Beidahe river valley located in the northeastern part of the region. In the Shulehe river valley to the north and Danghe river valley to the west, the shrinkage was only 13.5% and 10.6%, respectively, or about half that in the southern part of the mountains. The smallest change occurred in the Daxue mountains in the northwest, where the average decrease was only 4%. Even in valleys (5Y447A, -G, -H and -I in the glacier inventory) where the decrease was largest, it was only 8%.
By comparing the 1956 topographical maps with the 1990 TM image, we found that the total area occupied by glaciers in the Daxue mountains decreased by 7.7 km2, or about 5%, between 1956 and 1990 (Table 2). Although the decrease in glacierized area between 1956 and 1990 was comparable to that between the LIA and 1956, the rate of glacier shrinkage was significantly greater in the 20th century. To take a specific example, Reference Zhongxiang, Zichu and GuangheWang and others (1985) and Reference Chaohai, Yuoping and MingxiLiu and others (1992) found that on Glacier 5Y448D12 in the Daxue mountains, the area decrease was 0.99 km2 between the LIA (midpoint: AD 1680) and 1960, the year of the topographical map, and 0.64 km2 during the 30 years 1960–90. This implies rates of 0.0035 km2 a−1 (0.015% a−1) and 0.021 km2 a−1 (0.09% a−1), respectively. Clearly, shrinkage of glaciers in the study area has accelerated markedly during the last few decades.
Eighty per cent of the glaciers in the Daxue mountains are < 1 km2 in area, and the shrinkage of these small glaciers has been quite marked, with rates up to 0.7% a−1. About 19% of the glaciers have areas of 1–5 km2, and their shrinking rate reached 0.14% a−1. Only three glaciers have areas > 5 km2; their shrinking rates were relatively small, averaging 0.06% a−1.
Using Equations (1) and (3) and the calculated LIA glacier areas, we calculated the volumes and lengths of glaciers in the western Qilian Shan during the LIA, as well as changes between the LIA and 1956 (Table 1). For the 691 glaciers studied, the total volume change and average length change were 6.33 km3 (5.7 km3 w.e., using an ice density of 900 kg m−3) and 110 m, respectively. This is 18% and 11.5%, respectively, of the corresponding quantities at the LIA maximum. The data in Table 1 show that the percentage change in glacier volume is much larger than that in glacier area and length. The greatest shrinkage in volume was in the southern and northeastern parts of the mountains, and the greatest decrease in length was on glaciers in the Beidahe river valley in the northeast of the region (Table 1). This pattern of volume change may be a consequence of both glacier size and climate. Glaciers in the Beidahe river valley are very small, about 0.28 km2 on average, while in other valleys the average size is around 1.0–1.2 km2.
Assuming that the percentage change in glacier area in other parts of the western Qilian Shan from 1956 to 1990 is the same as for glaciers of the same area class in the Daxue mountains allows the area and volume changes of these other glaciers, for which we do not have measurements, to be estimated. The results for the four main valleys of the western Qilian Shan are listed in Table 3. The total decrease in area and volume of these glaciers is 151.9 km2 (12%) and 6.9 km3 (11%), respectively. (The latter is equal to 6.2 km3 w.e.) The greatest changes appeared in the Beidahe river valley, perhaps because of its preponderance of smaller glaciers.
Table 3. Estimated changes in area and volume of glaciers in the western Qilian Shan, 1956–90

From the results in Table 3, it is clear that although the Shulehe river valley has the largest glacier area, both the area and volume changes here are relatively small. The calculated total percentage ice-volume change is also slightly smaller than the area change. This can be attributed to the glacier-size distribution pattern and the percentage area change for glaciers of different sizes based on observations in the Daxue mountains. For instance, volume changes for small glaciers (≤1 km2) were in the range 29–38%, with an average volume change of 4.4 km3, but the total volume of these small glaciers is only 18% of the overall total; whereas the average volume decrease of large glaciers (> 1 km2) was only 3.8% (2.5 km3), but their volume is 82% of the overall total.
Based on the calculated decrease in glacier volume, we conclude that, due to the shrinkage of glaciers between 1956 and 1990, runoff in this valley was 2.7 km3 more than it would have been otherwise.
Glacier terminus retreat
The retreat of termini during the LIA maximum and the 1950s has been measured on 35 glaciers in the 5Y437 A–C river basins in the northeast of the studied region where the “July 1st” glacier is located. These glaciers were 0.3–4.4 km long, with terminus elevations of 4000–4700 m, during the LIA maximum. The retreat measurements show great differences according to glacier size, ranging from 20 m for smaller glaciers to 170 m for larger glaciers. In general, the terminus retreat of small glaciers may be taken as the ELA rise.
This hypothesis is supported by our analysis of small glaciers. In the data of glacier inventories of China, we found 126 glaciers < 1 km long that had ELA measurements available. These glaciers exhibit a good linear relationship between ELA and terminus elevation, Z end, as demonstrated by Figure 5. The regression equation indicates that ELAs on these small glaciers are about 240 m higher than the terminus. If such a relation holds, then the terminus retreat derives from the ELA rise according to the formula ΔZ end = 1.02 ΔELA. This suggests that the terminus retreat of small glaciers < 1 km long is of nearly the same amplitude as the ELA rise.

Fig. 5. Statistical relationship between ELA and the terminus elevations (Zend) of glaciers < 1 km long in China. The solid line is the regression line.
Of the 35 glaciers considered, there are 16 that are < 1 km long. The measured average terminus retreat of these 16 glaciers is 46 m in elevation; the ELA of these small glaciers may therefore have risen by 46 m during the LIA maximum and the 1950s. If a commonly accepted atmospheric lapse rate of 6.5°C km−1 is applied (Weng and Luo, 1990), such a mean ELA rise corresponds to a mean air-temperature rise of 0.3°C. As we have mentioned, climatic conditions in the warmer season have a significant influence on the mass-balance formation on glaciers in western China. Thus the ELA variations are mostly controlled by climate in the warm season, and the temperature rise derived from glacier terminus retreat may reflect the warm-season temperature rise.
Temperature, precipitation and runoff changes
The mean annual and the mean summer (June–August) temperatures at the Anxi (40°32′ N, 95°46′ E; 1171 m a.s.l.) andYumen (40°16′ N, 97°02′ E;1526 m a.s.l.) weather stations decreased between 1956 and 1990. These stations are located in intermontane plains regions of the lower reaches of the Shulehe river valley. Linear trend analysis of mean temperatures shows that the magnitude of the temperature drop in summer is larger than that for the whole year at both weather stations: the average rates of summer and annual temperature decrease are 0.036°C a−1 and 0.008–0.014°C a−1, respectively. During the corresponding period, the records at the two stations displayed a gradual increase in both annual and warm-season precipitation (May–September), with the increases being greater at Yumen station. The average rate of increase at the two stations was 1.1 mm a−1. From these data, it can be concluded that the summer temperature during the 35 year period 1956–90 in the intermontane plains of the western Qilian Shan may have decreased by 1.26°C, and the total precipitation increased by 35 mm. A similar climatic situation appears in the eastern and the middle parts of the Hexi Corridor (Reference Ma, Yaoguang and GuodongMa and Qu, 1996).
At the Changmabao hydrological station (39°54′ N, 96°57′ E; 2112 m a.s.l.), located at the point where the Shulehe river leaves the mountains, both summer (May–September) and annual runoff have increased during the 1956–90 period (Fig. 6). However, the ratio of summer runoff to annual runoff tended to decrease at a rate of about 0.2% a−1. (Linear trend analysis shows that this ratio decreased 6.4% between 1956 and 1990.) This seems to indicate that in the extensively glacierized alpine terrains of the upper reaches of Shulehe river, the trend toward increasing precipitation and decreasing temperature is similar to those in the intermontane plains of lower reaches. On glaciers in the Qilian Shan, and even in most of western China, both surface melting and accumulation occur mainly during the warm summer monsoon season. The cold season has strong winds and less precipitation. Reference Zhongxiang, Zichu and GuangheWang and others (1985) found that June–August precipitation at 4000 m a.s.l. on July 1st glacier in the Beidahe river basin (ELA ≈ 4600 m) accounts for 60% of the annual precipitation, and nearly all of this summer precipitation falls as snow in the high mountains above the ELA (Reference Liangfu and XiangchengDing and Kang, 1985). When summer precipitation increases and summer temperature decreases in these alpine terrains, surface melting weakens, summer snow accumulation increases and meltwater runoff decreases. Thus, the relative proportion of glacier meltwater in rivers decreases.

Fig. 6. Yearly variations of annual and summer runoff and of summer runoff as a percentage of the annual runoff, observed at the outlet hydrological station of Shulehe river in the Qilian Shan. The solid line indicates the linear trend of summer run-off as a percentage of the annual one, and the two dashed lines are the linear trends of summer and annual runoffs.
Since temperatures in the intermontane plains north of the western Qilian Shan all seem to be decreasing, one cannot help asking, “Why are glaciers in the western Qilian Shan shrinking?”. To answer this question, it is necessary to carefully analyze interannual climatic change in the western Qilian Shan. By comparing temperature changes during different periods of time at the Anxi and Yumen weather stations, we have found that during the decade 1956–66 the annual and summer average temperatures were higher than during other periods of similar length. For instance, at the Anxi weather station the mean summer temperature between 1956 and 1966 was 0.7–0.9°C higher than during any other period of the same duration. Moreover, precipitation during this period was relatively lower than during other such time periods. Therefore, the climate was characterized as relatively warm and dry. The mid-1950s to mid-1960s was the period of strongest melting on glaciers in the western Qilian Shan, and the glaciers must have been in a state of negative mass balance.
Changes in glacier extent (length, area and volume) are the end result of a glacier’s response to long periods of non-zero mass balance resulting from climatic change. Generally, the change in glacier extent lags the perturbation in surface mass balance by some time, defined as the response time T r. The magnitude of T r depends on the maximum thickness h max of a glacier and the ablation rate at the terminus of the glacier b t, and it is assumed that
(Reference Jóhannesson, Raymond and WaddingtonJόhannesson and others, 1989). This equation was applied by Haeberli and Hoelzle (1995) for the calculation of glacier response times in the Alps.
Reference Shiyin, Ninglian, Yongjian and ZichuLiu and others (1999) used Equation (4) to estimate the response time of 282 glaciers in the Manas river valley on the northern slope of the Tien Shan, and found that the response time for glaciers 0.5–1.5 km long is generally about 15 years. In the Shulehe river valley, 85% of the glaciers are < 2 km long, so we believe that the response times of most glaciers here should also be < 15 years. Because there is no modelling attempt for glacier dynamic response in this region, we assume that the indicated response time is the time of the response of the terminus or area of glaciers in the region. It is inferred that most of the glacier shrinkage in the Shulehe river valley during the period 1956–90 might have occurred during the mid-1960s to 1970s in response to the warm, dry period from the mid-1950s to mid-1960s. Indeed, three measurements at the terminus of glacier 5Y448D12 in the Daxue mountains using ground-based stereo photogrammetry showed that this glacier retreated more rapidly between 1960 and 1976 than between 1976 and 1985 (Reference Chaohai, Yuoping and MingxiLiu and others, 1992).
Nevertheless, there may be other forcing mechanisms driving glacier retreat during the past few decades in the studied area. By analyzing ice-core climatic records spanning the last 100 kyr and the last 2 kyr, together with instrumental data from theTibetan Plateau, Reference Tandong, Xiaodong and NinglianYao and others (2000) concluded that, during glacial/interglacial transitions, the air-temperature variability was larger on the plateau than at lower elevations. Thus, high mountain regions may experience climatic variations that differ significantly from those in lower areas. For example, they found a warming trend of 0.025°C−1 on the plateau, at altitudes above 3500 m, during the last 30 years. In contrast, in regions below 500 m, the warming was negligible. In the western Qilian Shan, almost all glaciers develop in areas higher than 3500 m. Thus, if the results of Reference Tandong, Xiaodong and NinglianYao and others (2000) are applicable to the present study, the glacierized area in the western Qilian Shan may have experienced warming between 1956 and 1990, rather than the cooling indicated by the meteorological stations. Ice-core studies are needed to determine whether this is so.
Conclusion
In summary, glaciers in the western Qilian Shan, as a whole, decreased in size between the LIA maximum and 1990, but the rate of retreat varied between mountain ranges. The southern and eastern parts experienced more intensive shrinkage than the northern and western parts. The glacial retreat rate between 1956 and 1990 was significantly faster than the retreat from the LIA maximum to 1956. Using the measured glacier area change and the relation between glacier area and volume, we find that ice wastage between 1956 and 1990 increased river runoff by 6.2 km3 in the four river basins under consideration. The area and volume decrease between 1956 and 1990 could be a consequence either of warming and drought between 1956 and 1966, or of continuous warming in the high mountains during the period under consideration. In addition, the glacier ELAs could have risen by 46 m between the LIA and the 1950s, corresponding to a mean warm-season temperature rise of 0.3°C.
Acknowledgements
The authors are very much indebted to R. LeB. Hooke for his enthusiastic help with language and science in the paper. Thanks are due to W.D. Harrison who arranged the revision of the original draft of this paper. We would also like to thank J. Meyssonnier (Scientific Editor), T. J. H. Chinn and an anonymous referee for the many careful reviews of, and helpful comments on, the manuscript. This research was financially supported by the Knowledge Innovative Projects (KZCX2-301, KZCX1-10-06, CZX-30), the Talent Cultivation Project of the Chinese Academy of Sciences and the National Key Project for Basic Research on the Tibetan Plateau (G1998040812).


