


1. INTRODUCTION
Sustained negative mass balance and increasing mass loss rates are affecting most glaciers subject to long-term mass-balance observations (WGMS, Reference Zemp2015). Many of them have experienced a strong reduction or a complete disappearance of the accumulation area over recent decades, and are therefore expected to rapidly vanish in the near future. Given the importance of glacier mass balance as a key variable for the monitoring strategies of the Earth climate system (Zemp and others, Reference Zemp, Frauenfelder, Haeberli and Hoelzle2005; WGMS, Reference Zemp2008), the World Glacier Monitoring Service (WGMS) suggested early parallel observations on larger and higher-reaching glaciers, in order to replace the monitored glaciers undergoing extinction (Zemp and others, Reference Zemp, Hoelzle and Haeberli2009).
The replacement glaciers for those that are currently monitored can have very different behaviour, imbalance with current climatic conditions and spatial representativeness, even when the two glaciers are close to each other (e.g. Kuhn and others, Reference Kuhn1985; Carturan and others, Reference Carturan2013a, Reference Carturanb), making the replacement problematic. In addition, larger glaciers extending to higher elevations may pose issues related to size, altitude, geometry and existence of inaccessible areas (steep slopes, crevasses and séracs), thus being more challenging for mass-balance measurements, compared with smaller glaciers with simpler geometry chosen in the past. Additional difficulties stem from the need to interpolate/extrapolate over unsampled areas, and increasing altitude often implies higher wind speed and more complex snow redistribution patterns.
In the Italian Alps, continuous mass-balance series >10 a exist for nine glaciers. Monitored glaciers with series starting before the 2000s are small (mean area < 1 km2) and characterised by low median elevation and low elevation range (376 m on average). In the past decade, these glaciers almost completely lost their accumulation area and are decaying or close to extinction (Carturan and others, Reference Carturan2016). The most striking example is provided by the Careser Glacier, in the Ortles-Cevedale Group, which is rapidly shrinking and disintegrating (Carturan and others, Reference Carturan2013a).
I present the 2003–14 mass-balance series of La Mare Glacier, which was selected to ensure future mass-balance observations in the area of the vanishing Careser Glacier (Carturan and others, Reference Carturan, Dalla Fontana and Cazorzi2009a). Different methods for the determination of the annual mass balance have been used and discussed. In particular, the methods proposed by Carturan and others (Reference Carturan, Cazorzi and Dalla Fontana2009b) and by Kuhn and others (Reference Kuhn, Abermann, Bacher and Olefs2009) for extrapolating glaciological measurements to unsampled areas were tested and optimised. Results from mass-balance measurements were compared with those from the neighbouring Careser Glacier and from other monitored glaciers in the Ortles-Cevedale Group, in order to assess the significance of this new observation series in the regional context.
2. THE LA MARE GLACIER
The La Mare Glacier (46.4333°N; 10.6362°E, World Glacier Inventory ID number: I4L00102517; WGMS, Reference Haeberli, Bösch, Scherler, Østrem and Wallén1989) is a valley glacier with compound basin located in the central part of the Ortles-Cevedale Group (Eastern Italian Alps; Figs 1, 2). Its current area is 3.501 km2 (2013), 13% smaller than in 2003, when the mass-balance measurements were started. Its elevation ranges from 2662 to 3769 m a.s.l. (Mount Cevedale) and the median elevation is 3285 m a.s.l. The lower edge of the glacier is irregularly shaped and presents three main tongues. The upper edge reaches the highest peaks of the glacier's catchment, which are all above 3500 m a.s.l. Continuous shrinking of the glacier is leading to its separation into two sub-units. The northern unit (1.44 km2) is steep, exposed to the south-east and has a median elevation of 3412 m a.s.l. The southern unit, which feeds the longest and lower-reaching ablation tongue, is flatter and larger (2.06 km2), mainly exposed to the north-east and with a median elevation of 3216 m a.s.l.

Fig. 1. Geographical setting, extent in three different periods and measurement network of La Mare Glacier. The 2012 multi-year firn cover is reported as it represents the average extent of the accumulation area in the period from 2003 to 2014.

Fig. 2. The La Mare Glacier on 25 August 2011.
The glacier is characterised by the presence of inaccessible areas with steep slopes, crevasses and seracs. It is fed mainly during winter (October–May) by direct precipitation and wind-drifted snow; avalanche contribution and topographic shading are of minor importance, except for small areas close to the margins. The debris cover is negligible and confined to the lower limit of the ablation area and to small median moraines. Meltwaters feed the Noce Bianco, which drains into the Noce River, one of the tributaries of the Adige River.
Climatically, the Ortles-Cevedale massif is near the main so-called ‘inner dry Alpine zone’ (Frei and Schär, Reference Frei and Schär1998), being characterised by the lowest precipitation in the entire European Alps (~500 mm a−1 at the floor of the Venosta Valley). Precipitation increases southward, however, reaching 900 mm a−1 in the valleys at the southern edge of Ortles-Cevedale, while total precipitation of 1300–1500 mm a−1 has been estimated at 3000–3200 m a.s.l. in the area of the La Mare Glacier (Carturan, Reference Carturan2010; Carturan and others, Reference Carturan, Dalla Fontana and Borga2012). The mean annual 0°C isotherm is located at ~2500 m a.s.l.
As with nearly all glaciers in the European Alps, La Mare has experienced a strong reduction since the Little Ice Age maximum, whose extent has been reconstructed from geomorphological evidence and has been dated ~1600 AD (Carturan and others, Reference Carturan2014). The glacier is now 44% smaller and 2.2 km shorter than in that period. However, unlike the neighbouring long-term monitored Careser Glacier (5 km east of La Mare), which has retreated uninterrupted since the end of the 19th century, the La Mare Glacier responded to climatic variations of the past 120 a, with alternating periods of retreat and re-advance, the latter peaking in 1897, 1923 and 1986 (Carturan and others, Reference Carturan2013a, Reference Carturan2014). In spite of its high median elevation, the glacier currently shows evidence of imbalance. The firn covers only the upper third of the glacier (Fig. 1), which shows continuous retreat of its lower edge, new bedrock outcrops and significant decrease of the surface velocities, from 6.3 m a−1 on average in 2005, to 3.1 m a−1 on average in 2013, as evaluated from repeat GPS surveys of the ablation stakes (Fig. 3).

Fig. 3. Annual surface displacement of eight ablation stakes (the number of the stakes is reported in Fig. 1).
3. MASS-BALANCE MEASUREMENTS AND CALCULATIONS
3.1. Glaciological method
Considering the physical characteristics of the La Mare Glacier, the available resources and the feasibility of long-term observations, it was decided to start glaciological mass-balance measurements focusing on the southern branch of the glacier. Point measurements of annual mass balance in the ablation area consist of repeat readings of 2 m aluminium ablation stakes, drilled into the ice using a hand drill. Ten ablation stakes were installed in 2003, increasing to 16 in 2005, and decreasing to 13 in the last few years (Fig. 1). Ablation stakes drilled in the firn did not provide reliable readings because of sinking, occurring also when using plastic or wooden plugs at the lower end of stakes. Therefore, ablation measurements from these stakes have been discarded. The positions of the ablation stakes were surveyed each year in September using GPS, for monitoring variations in the surface velocity. In late summer each ablation stake was lengthened applying a threaded bar to its top, in order to prevent burial by snow before the last measurements at the end of the balance year.
Snow depth soundings and density measurements in pits have been used for winter balance measurements, carried out in May, and for annual mass-balance measurements in the accumulation area. The soundings were done using aluminium or carbon fibre probes, and they were arranged along transects with 50 m spacing (Fig. 1). Particular attention was given to the area of the glacier with highest net accumulation, as suggested by Kuhn and others (Reference Kuhn1999). Repeat firn depth soundings served for annual mass-balance determinations in the part of the ablation area that was covered by firn. The snow cover and the transient snowline were mapped every 2–3 weeks during the ablation season, using terrestrial photographs, GPS surveys and Landsat imagery (http://glovis.usgs.gov/). The snowcover maps were obtained by manually digitising the snow limit using GIS software (ESRI ArcMap™); the same software was used for mass-balance calculations.
Winter mass balance (B w) calculations were performed using second-degree polynomial functions of winter balance vs. elevation, integrating this function over the total glacier area. The function was calculated by linear regression of sampled points located in areas with ‘normal’ accumulation, i.e. excluding the areas with too high or too low accumulation as visible in the snowcover maps. Above the highest sampled point, the winter balance was assumed constant as suggested by Escher-Vetter and others (Reference Escher-Vetter, Kuhn and Weber2009). The ‘profile’ method has been preferred to the ‘contour’ method in consideration of the spatial distribution of sampled points and of practicable areas. As suggested by Escher-Vetter and others (Reference Escher-Vetter, Kuhn and Weber2009), polynomial functions have been preferred to linear regressions because they better capture the elevation trend of B w.
Annual mass-balance (B a) calculations were carried out using the contour method, which consists of drawing by hand the mass-balance isolines. Point measurements of b a were combined with knowledge of the spatial distribution of mass balance achieved by repeat mapping of the snow cover and equilibrium line altitude (ELA), which display a recursive pattern controlled by the local topography (e.g. Helfricht and others, Reference Helfricht, Schöber, Schneider, Sailer and Kuhn2014). Over unmeasured areas, additional constraints for the manual drawing of B a isolines were obtained calculating the cumulative mass balance at several points placed along the transient snowline, which was mapped at different dates during the ablation season. This was achieved by linear regression of cumulative mass balance vs. altitude at the ablation stakes, from the dates of snowline observations (which correspond to the dates of ablation stake readings) to the date of the last survey of the mass-balance year. The use of mass-balance gradients over areas where no stakes are available was suggested, among others, by Haefeli (Reference Haefeli1962), Jansson (Reference Jansson1999) and Carturan and others (Reference Carturan, Cazorzi and Dalla Fontana2009b). The summer mass balance (B s) was calculated as the difference between B a and B w. A combination of conventional and reference-surface balance is reported (glacier topography and area were updated in 2006 and 2011), using the floating-date time system (Cogley and others, Reference Cogley2011).
The mass balance over the northern (unmeasured) branch of the glacier was obtained through the transfer of annual mass-balance profiles measured on the southern branch, as proposed by Kuhn and others (Reference Kuhn, Abermann, Bacher and Olefs2009):
 $$b_{\rm u}(h) = b_{{\rm ref}}(h + D),$$
where b u(h) is the mass-balance profile of the unmeasured glacier as a function of altitude (h), and b ref(h + D) is the mass-balance profile of the measured ‘reference’ glacier, shifted by the difference in median elevations (M) of the two glaciers, calculated as:
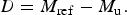 $$D = M_{{\rm ref}} - M_{\rm u}.$$
According to this procedure, D should express the vertical shift of b(h) due to the different topographic and climatic factors existing in the two glaciers, in this case principally the exposure to solar radiation. In this way it was possible to calculate the mass balance of the entire glacier and to compare the results with those obtained from the geodetic and hydrological methods.
3.2. Geodetic method
Two high-resolution aerial LiDAR surveys have been used for calculating the geodetic mass balance of La Mare Glacier. They were carried out at the end of the ablation season, the first on 17 September 2003 and the second on 22 September 2013, with an average point density of 0.6 and 1 points per square metre respectively, and a complete coverage of the glacier. DTMs with cell size of 10 m × 10 m were generated from the two LIDAR point clouds, using the MicroStation™ and ESRI ArcMap™ software packages.
The relative accuracy and consistency of the two DTMs have been checked on stable areas outside the glacier, revealing that no further co-registration was needed as no residual shift exists between them. The standard deviation of elevation differences outside the glacier is 0.206 m.
The total volume change ΔV (m3) from 2003 to 2013 was calculated in Arcmap as:
 $$\Delta V = \overline {\Delta z} \cdot A_{2003}$$
where $\overline {\Delta z} $
is the average elevation change between the DTM
2003 and DTM
2013 (Fig. 4) over the 2003 area (A
2003). The area-averaged specific geodetic mass-budget rate (m w.e. a−1), referred to as ‘average geodetic mass balance’ hereafter, was calculated as:
$\overline {\Delta z} $
is the average elevation change between the DTM
2003 and DTM
2013 (Fig. 4) over the 2003 area (A
2003). The area-averaged specific geodetic mass-budget rate (m w.e. a−1), referred to as ‘average geodetic mass balance’ hereafter, was calculated as:
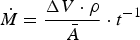 $$\dot{M}= {\Delta V \cdot \rho \over {\bar A}} \cdot t^{ - 1}$$
where ρ is the mean density, $\bar A$
is the average of the A
2003 and A
2013 areas, and t is the time interval (10 a) between the two periods. The firn cover of 2003 and 2013, mapped as described for the snow cover (previous Section), were used to calculate ρ as a weighted average, assigning 900 kg m−3 to the areas with unchanged surface (87% of the glacier) and 650 kg m−3 to the areas where firn was removed or formed (13% of the glacier) and using the respective areas as weights. The obtained ρ was 851 kg m−3. For comparison purposes, the average geodetic mass balance was calculated for the entire glacier and for the southern and northern branches separately.
$\bar A$
is the average of the A
2003 and A
2013 areas, and t is the time interval (10 a) between the two periods. The firn cover of 2003 and 2013, mapped as described for the snow cover (previous Section), were used to calculate ρ as a weighted average, assigning 900 kg m−3 to the areas with unchanged surface (87% of the glacier) and 650 kg m−3 to the areas where firn was removed or formed (13% of the glacier) and using the respective areas as weights. The obtained ρ was 851 kg m−3. For comparison purposes, the average geodetic mass balance was calculated for the entire glacier and for the southern and northern branches separately.

Fig. 4. Elevation difference between the years 2013 and 2003. The contours represent the 2003 surface topography.
3.3. Hydrological method
The availability of a high-altitude weather station (Careser diga, 2605 m a.s.l.; Fig. 1), where automatic temperature and precipitation measurements are supplemented by daily manual observation of fresh snow and total snow heights, enabled a reliable calculation of precipitation inputs over the glaciated areas in this part of the Ortles-Cevedale Group. As described in detail by Carturan and others (Reference Carturan, Dalla Fontana and Borga2012), manual snow observations were used for the correction of the automatic solid precipitation measurements at Careser diga. The precipitation was then extrapolated at different elevations using a monthly vertical precipitation gradient, calculated by linear regression of precipitation vs. altitude between the Careser diga and the Cogolo Pont (1200 m a.s.l., 6.3 km south of Careser diga) weather stations.
In summer 2007 a stream gauging station was setup at the outlet of the Noce Bianco a Pian Venezia catchment, in a natural section (Fig. 5). This 8.4 km2 catchment includes the La Mare Glacier, which covers 42% of the area, and ranges in altitude from 2300 m to 3769 m a.s.l. (median altitude = 3079 m a.s.l.). Water stage was recorded at 15 min intervals by a water pressure recorder, housed inside a metal pipe to shield it from sediments. Discharge was repeatedly measured, in particular during the ablation season, for defining the stage-discharge rating curve and for checking its stability over time. The salt dilution method was used for discharge measurements.

Fig. 5. The Noce Bianco a Pian Venezia catchment. The photo in the inset shows the outlet of the catchment.
The annual hydrological mass balance of La Mare Glacier was calculated as:
 $$\Delta S = P - R - E$$
where ΔS is the change in glacier water storage and P, R and E are the total precipitation, runoff and evaporation, respectively, in the catchment. P has been calculated from the Careser diga and Cogolo Pont weather stations and R has been derived from the runoff data collected at the outlet. E was not measured in the field and its estimate was rather uncertain, given its high spatial and temporal variability (e.g. Strasser and others, Reference Strasser, Bernhardt, Weber, Liston and Mauser2008). Hence, in the absence of detailed and distributed field data, it was preferred to explore the range of values reported for annual E in catchments with similar characteristics in the Alps (i.e. 175 ± 75 mm a−1; Hoinkes and Lang, Reference Hoinkes and Lang1962; Lang, Reference Lang1981 and references therein; Moser and others, Reference Moser, Escher-Vetter, Oerter, Reinwarth and Zunke1986; Braun and others, Reference Braun1994; Escher-Vetter and others, Reference Escher-Vetter, Braun, Siebers, Weber and Herrmann2005). As the bedrock is composed of impermeable rocks (mica schists), and the thickness of deposits and soils is generally low, the water storage in subsurface aquifers was neglected.
3.4. Estimation of uncertainty
The uncertainties of the glaciological and geodetic mass-balance estimates obtained on La Mare Glacier have been assessed on the basis of the conceptual and statistical toolsets proposed by Zemp and others (Reference Zemp2013). In the southern part of the glacier, the random error related to point measurements can be quantified in 100 mm w.e. a−1, as obtained from repeatability tests (33 repeated measurements over 100 m2 areas around the measurement sites). The random error related to the spatial integration was evaluated based on the difference between the observed and calculated mass balance at 24 sites along the transient snowline, which have been excluded from the calculation of the mass-balance gradient, and is 240 mm w.e. a−1. The two errors combined yield a total random error of 260 mm w.e. a−1 for the direct glaciological method.
The uncertainty of the geodetic method can be quantified as 38 mm w.e. a−1, resulting from the integration of the uncertainty related to spatial autocorrelation of the elevation differences between the 2003 and 2013 DTMs (15 mm w.e. a−1, quantified following Rolstad and others, Reference Rolstad, Haug and Denby2009), and of the uncertainty related to density conversion (35 mm w.e. a−1, mean random error reported by Zemp and others, Reference Zemp2013).
The random error in total precipitation estimates, assessed comparing winter balance measurements on the glacier and extrapolated precipitation from the Careser and Cogolo weather stations, is 100 mm a−1. Combined with the random error in runoff measurements (25%) and the random error in evaporation (75 mm a−1), yields a total uncertainty of 0.4 m a−1 for the hydrological method.
4. RESULTS
The mass balance of La Mare Glacier (southern branch) was negative in the first 10 a of observations, close to zero in 2013 and positive in 2014 (Table 1; Fig. 6) The ELA was generally above the median elevation of the glacier (3216 m a.s.l. in 2013), and it was above the highest point of the glacier in 2003, 2006 and 2012. Linear regression of Accumulation Area Ratio (AAR) vs. B a indicates that the balanced-budget AAR (AAR0) is 0.53, while linear regression of ELA on B a indicates that the balanced budget ELA (ELA0) is 3165 m a.s.l. (Fig. 7). In the period from 2003 to 2014, B a averaged −0.756 ± 0.260 m w.e. a−1 and the average AAR was 0.28. In the same period, on the Careser Glacier the average B a was −1.777 ± 0.200 m w.e. a−1 (Fig. 8), with a mean AAR of 0.05.

Fig. 6. Spatial distribution of the annual mass balance in the southern branch of La Mare Glacier in the period from 2003 to 2014.

Fig. 7. AAR and ELA vs. annual mass balance in the period from 2003 to 2014. Years with AAR = 0 and ELA above the upper limit of the glacier have been excluded.

Fig. 8. Comparison of the annual mass balance and cumulative mass balance series of the Careser and La Mare glaciers in the period from 2003 to 2014.
Table 1. Mass-balance results on La Mare Glacier in the period from 2003 to 2014, according to different methods. Anomalies in the precipitation of the accumulation season and in the temperature of the ablation season are referred to the period from 1981 to 2010

* Estimates obtained by the modified version of the method from Kuhn and others (Reference Kuhn, Abermann, Bacher and Olefs2009), using the average difference in the snowline altitude Ds (values in brackets report the estimates using the difference in the median altitude D).
The mass balance displays a consistent spatial pattern from year to year, which is mainly controlled by the elevation and wind redistribution. In particular, above ~3200 m, the interaction of the undulating surface topography and dominant westerly winds leads to a mass-balance distribution pattern that is almost independent of elevation. Therefore, in most years, the late summer snow cover was typically patchy and the transient snowline was nearly perpendicular to the elevation contours (Fig. 6).
In the observation period, the average total precipitation in the accumulation season (October–May) was not significantly different from the long-term mean (+2% on average; Table 1). On the other hand, ablation seasons (June–September) were repeatedly warmer than average (+0.7°C on average). As already acknowledged by other authors (e.g. Zemp and others, Reference Zemp, Paul, Hoelzle, Haeberli, Orlove, Wiegandt and Luckman2008; Carturan and others, Reference Carturan2016; Huss and others, Reference Huss, Dhulst and Bauder2015) the imbalanced conditions of most glaciers in the European Alps is mainly attributable to decreased summer balance, rather than to changes in the accumulation season, and La Mare Glacier is no exception. However, increased winter precipitation in the last 2 a led to a notable increase of B a, in particular in 2014 when the summer was also favourable, thanks to decreased mean temperature and frequent snowfall on the glacier.
The annual mass-balance profiles measured for the southern branch of the glacier were transferred to the unmeasured northern branch, using the procedure suggested by Kuhn and others (Reference Kuhn, Abermann, Bacher and Olefs2009). According to this method, in the period from 2003 to 2014 the average northern branch B a was −0.872 mm w.e. a−1, i.e. 116 mm w.e. a−1 more negative than in the southern branch. An alternative formulation was tested, replacing the difference in the median elevation between the two parts (D, increased from 160 m in 2003 to 196 m in 2013) with the average difference in the transient snowline altitude (D s = 72 m, as mapped in 13 different dates). Using D s, the average northern branch B a in the same period would be −0.549 mm w.e. a−1 i.e. 207 mm w.e. a−1 less negative than in the southern branch. The B a of the entire glacier results −0.806 and −0.668 mm w.e. a−1 using D and D s respectively.
In the decade from September 2003 to September 2013, the average geodetic mass balance was in very close agreement with the glaciological method in the southern branch (Table 1), indicating that the direct mass-balance series does not require calibration (Huss and others, Reference Huss, Bauder and Funk2009; Zemp and others, Reference Zemp2013). According to the geodetic method, the northern branch had ~100 mm w.e. a−1 less negative average mass balance compared with the southern branch, which is in closer agreement with estimates obtained using the glaciological mass-balance profile transferred using D s instead of D (assuming negligible internal and basal mass exchanges).
The map of elevation changes from September 2003 to September 2013 (Fig. 4) shows that surface lowering prevailed at all altitudes, with few exceptions in crevassed areas and in small areas of wind-drifted snow accumulation, in particular close to the top of Mount Cevedale. A very rapid thinning rate, ranging from 2 to 4.5 ± 0.33 m a−1, can be observed in the ablation area below 3000–3100 m, which corresponds to the part of the glacier with largest drop in the surface velocities (stakes 1 and 13 in Fig. 3). It is interesting to observe that the 0 to −5 ± 0.33 m a−1 elevation change class almost perfectly traces the residual accumulation area (multi-year firn cover in Fig. 1).
The mass-balance values provided by the hydrological method were in good agreement with the direct method (Table 1). Underestimations by the hydrological method prevailed (4 out of 5 cases, ranging from −20 to −153 mm w.e. a−1), but the difference was in the range of uncertainty of evaporation losses in most cases (150 mm a−1), except for 2009 when it was slightly larger. In 2012 and 2013 it was not possible to calculate the hydrological mass balance, due to a flood event that damaged the gauging station.
5. DISCUSSION
Long-term high-quality mass-balance measurements on glaciers are demanding in terms of costs, time and expertise of the investigators. In addition they require, if possible, easy and safe access to the glaciers. For these reasons, in the past, the Italian glaciers selected for mass-balance measurements were for the most part small, with small elevation range, simple geometry and easily and safely accessible over their entire surface (Carturan and others, Reference Carturan2016). The interpolation and extrapolation of point measurements is generally easier for these types of glacier. These characteristics, however, are unfavourable for the future survival of measured glaciers, which have lost almost entirely their accumulation areas in the past years/decades. For these reasons, and following the recommendations from the WGMS, mass-balance observations were started in the 2000s over larger and higher-reaching glaciers of Ortles-Cevedale and Breonie Occidentali groups (Carturan and others, Reference Carturan, Dalla Fontana and Cazorzi2009a; Galos and others, Reference Galos2015; http://www.provinz.bz.it/wetter/glacierreport.asp).
The La Mare Glacier was selected among the glaciers close to the long-term monitored and rapidly vanishing Careser Glacier (Carturan and others, Reference Carturan2013a), because it displayed a persistent accumulation area and because it was among the largest, highest-reaching and at the same time accessible glaciers in the Ortles-Cevedale Group. However, it represents a glacier type that is challenging for mass-balance monitoring, due to the presence of inaccessible areas, size, remoteness, complex surface morphology and large lateral gradients of mass balance. These characteristics may pose serious issues for the achievement and continuation of high-quality measurement series, in particular under the possibility of reduced funding and/or change of investigators.
The efforts made in the first 12 a of observations enabled a good knowledge of the glacier and the spatial pattern of mass-balance distribution to be obtained, and offered the opportunity to implement and test two methods proposed in the literature for the extrapolation of point measurements over unsampled areas. These methods allow for a reduction in the subjectivity of mass-balance calculations and, remarkably, they are based on field observations, totally independent of meteorological measurements. This point is important when mass-balance measurements are used for monitoring strategies of the Earth climate system.
The first method is based on the use of mass-balance gradients over unmeasured areas (Haefeli, Reference Haefeli1962; Jansson, Reference Jansson1999). In particular, on La Mare Glacier the cumulative mass balance vs. elevation was calculated for each date of ablation stake readings/snow cover mapping, and applied for calculating the cumulative mass balance along the mapped transient snowline over inaccessible areas. This method helps to draw mass-balance isolines, thanks to the additional points of cumulative mass balance placed along the transient snowline, which can be used as supplementary ‘virtual’ ablation stakes. The performance of this method was evaluated using ablation stake readings carried out when they were along the transient snowline. Twenty-two useable stake readings were identified over the 12 a period, providing a mean estimation error of +0.013 m w.e. in the cumulative mass balance, and a standard deviation of 0.243 m w.e. Additional topographic attributes could be used in multiple linear regressions for improving the method. Carturan and others (Reference Carturan, Cazorzi and Dalla Fontana2009b), for example, suggested including the clear-sky radiation to better account for the spatial variability of ablation. However, a higher range of clear-sky radiation values would be needed, at the mass-balance points, to obtain statistically significant multiple regression parameters. This is not feasible in the southern part of La Mare Glacier due to its uniform exposure.
Based on the experience on La Mare Glacier, it looks advisable (1) to explore as much elevation range as possible during ablation measurements, to reduce the need for extrapolations to higher altitudes, and (2) to acquire sufficient information for mapping the snow cover in the immediate proximity of the dates of ablation measurements. Clearly, the method is only applicable to the ablation area. In the accumulation area it was assumed that the annual mass-balance pattern does not change from year to year. This assumption is based on the observation of the dominant role of topography in controlling the spatial distribution of mass balance, as already acknowledged for example by Erickson and others (Reference Erickson, Williams and Winstral2005), Helfricht and others (Reference Helfricht, Schöber, Schneider, Sailer and Kuhn2014) and Revuelto and others (Reference Revuelto, López-Moreno, Azorin-Molina and Vicente-Serrano2014), and is supported by the high similarity of the snow cover pattern in the observation period (Fig. 6). Years with extremely low AAR (2003 and 2012) provided evidence in support of this hypothesis, and were useful for mapping B a in areas with high net accumulation. Possible deviations from this assumption likely had small impacts in glacier-wide mass-balance calculations, due to the small extent of the accumulation area, but further investigations are required to validate this assumption.
Considering the different mean exposure of the two parts of La Mare Glacier (Fig. 1), the elevational mass-balance gradient measured in the southern part of the glacier was not directly transferable in the northern part. As suggested by Kuhn and others (Reference Kuhn, Abermann, Bacher and Olefs2009), a vertical shift was applied based on the difference in the median elevation of the two parts (D). However, mass-balance estimates obtained by the geodetic method suggest that replacing D with the mean difference in the transient snowline altitude (D s) is preferable. In the case of La Mare Glacier, the difference D between the median elevations may not be an adequate metric of the vertical shift of b(h) induced by the different climatic and topographic conditions in the two parts of the glacier. Because the northern part, which is steeper (23.3° on average) is adjusting its geometry faster than the southern part, which is less steep (17.5° on average), D increased from 160 m in 2003 to 196 m in 2013. Therefore, the current value of D expresses the combined effect of (1) the differences in micro-climatic and topographic conditions and (2) the different reaction of the two parts of the glacier, which likely have different response times (Haeberli and Hoelzle, Reference Haeberli and Hoelzle1995) and type of response, as demonstrated by the different behaviour of M ref (decreased by 2 m) and M u (increased by 34 m) from 2003 to 2013. The average difference in the transient snowline altitude between the two parts (D s = 72 m, as mapped on 13 different dates) likely better represents the actual vertical shift of b(h), and in addition it is intrinsically more stable over time.
The availability and comparison of three different methods for mass-balance determination, which are in good agreement, increases the confidence in estimates over the observation period. However the uncertainty of each method and the fact that each of them measures different components of the mass balance, have to be considered in comparisons. The discrepancy between the geodetic and the glaciological method is only 15 mm w.e. a−1, which is much lower than the lowest detectable bias working with a 90% confidence level (i.e. 265 mm w.e. a−1, quantified following Zemp and others, Reference Zemp2013). Differences in the survey dates and in the reference area are negligible. Similarly, internal and basal balances could not be quantified and have been assumed of minor importance in this temperate glacier (March and Trabant, Reference March and Trabant1997; Cogley and others, Reference Cogley2011; Zemp and others, Reference Zemp2013). Some authors reported significant local magnitude for internal accumulation (ranging from 120 to 650 mm w.e. a−1; Trabant and Mayo, Reference Trabant and Mayo1985; Reijmer and Hock, Reference Reijmer and Hock2008) or basal ablation (e.g. Haberkorn, Reference Haberkorn2011, at the tongue of Hintereisferner, Austria), but considering the small extent of the accumulation area and of the ablation tongue, these processes have only local significance on La Mare glacier and likely marginal impacts in glacier-wide calculations.
Similar considerations can be valid for the northern part of the glacier, where mass-balance extrapolations from the southern part likely introduce additional uncertainties in the glaciological method (Kuhn and others, Reference Kuhn, Abermann, Bacher and Olefs2009). Given the small uncertainty of the geodetic method (38 mm w.e. a−1), it can be reasonably assessed that the 105 mm w.e. a−1 less negative mean geodetic mass balance of the northern part actually describes conditions of smaller imbalance, compared with the southern part. This behaviour is better reflected by the use of D s in glaciological extrapolations, even if estimates using either D or D s are not statistically different from the geodetic estimate (Table 1).
The hydrological method provided mass-balance estimates in good agreement with the glaciological method, while comparisons cannot be done with the geodetic method given the different periods of observations. However, significant uncertainty affects the calculation of the hydrological mass balance. Additional investigations on precipitation gradients, evaporation rates and runoff measurement errors could help in reducing the uncertainty intrinsic in this method (Østrem and Brugman, Reference Østrem and Brugman1991; Kaser and others, Reference Kaser, Fountain and Jansson2003).
The results of the first 12 a of mass-balance monitoring show nearly unchanged mass loss rates compared with the calculations between 1983 and 2006 by Carturan and others (Reference Carturan2013b). Calculating the average geodetic mass-balance rates for 112 glaciers in the Ortles-Cevedale Group, the same authors highlighted a much higher spatial representativeness of La Mare Glacier, compared with the neighbouring Careser Glacier, whose mass-balance series dates back to 1967. Unchanged mass loss rates suggest sustained climatic forcing and lack of adjustment of the glacier, whose mass balance would otherwise tend to zero. Given the current extent of the accumulation area, the committed area change under stationary climatic conditions is close to −50%. The two parts will separate in the next few years. After that, the southern part will lose the ablation area below 3100 m a.s.l., which is already becoming stagnant (Fig. 3); steep and convex areas at high altitude will also deglaciate, due to low winter accumulation and lack of summer snowfall. The northern and steeper part of the glacier will likely continue its fast geometric adjustment, and fragmentation is likely to start soon owing to the low ice thickness.
These hypothesised morphological changes would drastically reduce the size of La Mare Glacier. As local topo-climatic effects are of increasing importance for the smaller ice bodies (e.g. DeBeer and Sharp, Reference DeBeer and Sharp2009), new assessments might be required in the future for checking the spatial representativeness of the glacier at the regional scale. Further climatic warming would ultimately cause the extinction of La Mare Glacier and of most glaciers in the Ortles-Cevedale and in the Eastern European Alps. In that case only small ice bodies would survive, highly dependent on local-scale controls such as topographic shading, debris cover and avalanches, and mostly decoupled from regional-scale temperature fluctuations (e.g. Kuhn, Reference Kuhn1995; DeBeer and Sharp, Reference DeBeer and Sharp2009; Carturan and others, Reference Carturan2013c). This circumstance would represent a serious issue for monitoring strategies of the climate system based on glacier mass balance in this geographic area.
6. CONCLUSIONS
This paper presents the methods and results of the first 12 a of mass-balance monitoring on La Mare Glacier, which was selected for a new series of measurements in 2003, to replace the rapidly vanishing long-term monitored Careser Glacier. The mass balance was negative from 2003 to 2012, close to zero in 2013 and positive in 2014, averaging −0.756 ± 0.260 m w.e. a−1. The glacier still preserves an accumulation area (average AAR = 0.28), which however is too small for the current glacier geometry. The present mass loss rate is comparable with previous estimates for the 1983 to 2006 period, indicating sustained climatic forcing and imbalanced conditions. Additional area loss of ~50% is required to re-establish equilibrium with unchanged climatic conditions.
The comparison of results from the glaciological, geodetic and hydrological methods revealed good agreement, with discrepancies that are not statistically significant. In particular, a good correspondence was found between decadal mass-balance rates from the glaciological and geodetic methods, revealing that calibration of glaciological results is not required in the investigated time span.
Two techniques for extrapolating point measurements over unsampled and inaccessible areas were tested. The first, which consists in the repeat mapping of the transient snowline during the ablation season and in the calculation of the cumulative mass-balance altitudinal gradient for points along the snowline, greatly facilitated the digitisation of mass-balance isolines and provided local estimates with a random error of 240 mm w.e. a−1. However, the method only works in the ablation area, and in the accumulation area it was assumed that the mass-balance pattern is stable from year to year.
The second, proposed by Kuhn and others (Reference Kuhn, Abermann, Bacher and Olefs2009), consists of the transfer of the vertical mass-balance profile from the measured southern branch of the glacier, to the unmeasured northern branch. The results suggest that the average difference between the transient snowline altitudes could be a valid alternative to the difference in the median elevation of the two parts of the glacier, in particular when they have different slope and different response time and during periods with imbalanced conditions and rapid morphological changes. Further tests on other glaciers are required for assessing if this could be an effective improvement of the method.
Future field work and analyses should be carried out (1) for checking assumptions of negligible internal and basal mass exchanges and stable mass-balance pattern in the accumulation area and (2) for reducing measurement and calculation errors, in particular for the glaciological and hydrological methods. In addition, future geodetic mass-balance measurements should be carried out not only for validating the glaciological results, but also for checking the spatial representativeness of the glacier at the regional scale, after its expected geometric adjustment.
ACKNOWLEDGEMENTS
This study was funded by the Italian MIUR Project (PRIN 2010-11): ‘Response of morphoclimatic system dynamics to global changes and related geomorphological hazards’ (local and national coordinators G. Dalla Fontana and C. Baroni). Special thanks go to Giancarlo Dalla Fontana and Federico Cazorzi. The author is grateful to Fabrizio De Blasi for his contribution in the collection and processing of the field and remotely-sensed data. Many thanks also to the numerous friends, colleagues, alpine guides and students who contributed to the collection of the field data. The Autonomous Province of Trento is acknowledged for providing the meteorological and topographic data. Suggestions by Jo Jacka, David Rippin and two anonymous reviewers have helped in a significant way to improve the manuscript.


 Open access