


1. INTRODUCTION
As sea-ice extent in polar regions decreases (e.g., Stroeve and others, Reference Stroeve2012), increasing open water fetches are generating larger waves (Thomson and others, Reference Thomson2016), which may propagate farther into the pack ice and potentially break it up (Asplin and others, Reference Asplin, Galley, Barber and Prinsenberg2012; Thomson and Rogers, Reference Thomson and Rogers2014). Failure likely occurs due to wave-induced bending of the ice cover, which induces cyclic compressional and tensional stresses in the ice. The stress amplitude of loading is proportional to the wave amplitude and therefore depends on the wave attenuation along the ray of wave propagation below the ice. Potentially destructive compressional stresses due to wave-induced bending are enhanced when wind pushes the ice perpendicular to a coastline (Tremblay and Hakakian, Reference Tremblay and Hakakian2006). These processes are more likely to operate in the late summer and early fall when the ice is warm and the fetch long.
The capacity of waves to penetrate into sea ice depends on the dissipation rate of the wave energy by the ice. Field observations of wave events in the Barents Sea have shown that wave damping is stronger in solid ice and reduced significantly when the ice is broken into floes by waves (Collins and others, Reference Collins, Rogers, Marchenko and Babanin2015). Marchenko and Cole (Reference Marchenko and Cole2017) found that when the saline ice permeability is >10−9 cm2, corresponding to a brine volume fraction of ~5% (Golden and others, Reference Golden2007), wave-energy dissipation is dominated by the migration of liquid brine through the ice, highlighting the important role of ice permeability on wave-energy dissipation.
Sea-ice permeability is known to exhibit a percolation threshold at a critical brine volume fraction of ~5% (Golden and others, Reference Golden, Ackley and Lytle1998; Golden and others, Reference Golden2007; Pringle and others, Reference Pringle, Miner, Eicken and Golden2009). For a typical bulk ice salinity of 5 ppt, this fraction corresponds to a critical temperature of ~−5 °C. Here we investigate another process that possibly impacts sea-ice permeability, namely inelastic deformation. Cracks are common in sea ice (Marko and Thomson, Reference Marko and Thomson1977; Kwok, Reference Kwok, Dempsey and Shen2001; Schulson, Reference Schulson2004) and likely form in response to wind- or wave-driven deformation (Richter-Menge and others, Reference Richter-Menge, McNutt, Overland and Kwok2002; Marchenko and Cole, Reference Marchenko and Cole2017). Above a critical crack density, cracks link together to create a continuous pathway for flow (Renshaw, Reference Renshaw1999; Renshaw and others, Reference Renshaw, Schulson and Sgward2017). We recently demonstrated that in ~150 mm cubes of fresh water columnar ice at −10 °C deformed uniaxially by loading across the columns at a strain rate of 10−5 s−1, inelastic deformation and the attendant creation of short cracks results in the formation of a connected flow pathway along the columns (i.e., the onset of percolation) at a strain of ε = 0.38 ± 0.01% (mean ± standard error), nearly coincident with peak stress and the peak rate of acoustic emissions (i.e., cracking) (Renshaw and others, Reference Renshaw, Schulson and Sgward2017). However, in sea ice deformed under confinement, such as during wave-induced bending and/or when ice is forced against a fixed obstacle such as a coastline or engineered structure, deformation might instead decrease ice permeability through the closure of both cracks and brine channels. Laboratory investigation of this process is difficult because typical spacing of brine drainage channels in natural sea ice can be several centimeters to several tens of centimeters (Freitag, Reference Freitag1999), necessitating the use of samples of dimensions up to a meter or more to capture a representative brine drainage channel network. For example, laboratory measurements of sea-ice permeability have been observed to be several orders of magnitude lower than permeabilities measured in the field (Freitag, Reference Freitag1999). The effect of a decrease of fracture permeability due to confining pressure is well known in rocks (Walsh, Reference Walsh1981).
Here we report the results of a first-of-its-kind large-scale field deformation experiment to investigate the impact of compressive loading on sea-ice permeability. Specifically, we performed a large-scale field indentation test while monitoring the permeability of the ice ahead of the indentor and observed spatially heterogeneous changes in permeability. We propose that the compression induced by the indentor is analogous to the compression induced by wave-induced bending or when ice is forced against a fixed obstacle. In our experiments, in some places, the permeability decreased by four orders of magnitude or more, while elsewhere, it increased by more than an order of magnitude. We analyze the stress field ahead of the indentor to predict the spatial distribution of deformation and show that the observed changes in permeability are consistent with expected changes in the mechanisms of deformation. To our knowledge, these are the first direct field observations of the impact of deformation on sea-ice permeability and suggest that deformation processes may need to be considered in analyzing how the increase in wave energy may affect both the coastal zones and the remaining ice pack.
2. METHODS
2.1. The ice
The field indentor experiment was performed on first-year sea ice formed in a protected cove within the Van Mijenfjorden fjord near Sveagruva in the Norwegian archipelago of Svalbard (77.8829N, 16.7755E, Fig. 1). Water in the cove is hydraulically connected to the ocean via a narrow channel that permits tidal fluctuations of the water level in the cove yet protects the ice in the cove from wave action. At the time of testing in mid-March 2017, the ice was intermittently covered with up to several tens of centimeters of snow, which was removed within the test area prior to testing. Thin sections of the ice revealed columnar grain structure with 2–3 cm diameter vertical columns extending through the full thickness of the ice. The temperature gradient within the undeformed ice was nearly linear, ranging from ~−15 to −12 °C at the ice/air interface to −2 °C at the bottom of the ice. Ice thickness within the test area was nearly uniform at ~59 cm, likely a result of the protective cove that may limit heterogeneity. Ice temperature approached −5 °C at a depth of 50 cm, which coincided with the percolation depth of the ice; boreholes drilled to shallower depths in undeformed ice remained dry while deeper boreholes filled with water.
Fig. 1. Location of test site near Sveagruva in the Norwegian archipelago of Svalbard.
2.2. Indentation test
In preparation for the field indentor experiment, a 1 m × 2 m through-going (i.e., open at the top and bottom surfaces of the ice) rectangular hole was sawn into the ice into which the field indentor was lowered (Fig. 2). The field indentor consisted of two hydraulic rams attached to 60 cm × 60 cm steel plates on either end. The hydraulic fluid pressure within the rams was manually adjusted to apply a ~750 ± ~50 kPa horizontal compressive stress along the short dimensions of the rectangular hole. We conducted two separate indentor tests; during the first test, the force applied by each ram was approximately equal. While the second test was intended to replicate the first, during the second test, the force applied by the upper ram was, unintentionally, as much as 50% greater than that of the lower ram. The applied loading was held constant during the permeability testing described below. The maximum displacement rate of the rams was of the order 10−3 m s−1, which normalized by the ice thickness or size of the loading plate gives a characteristic strain rate of order 10−4 s−1 during the initial loading of the sample. This strain rate is of the same order of magnitude as the ductile-to-brittle transitional strain rate of saline ice at −10 °C (Snyder and others, Reference Snyder, Schulson and Renshaw2016). Although the mode of failure at this strain rate is macroscopically ductile, at least in laboratory-scale samples of both fresh (Renshaw and others, Reference Renshaw, Schulson and Sgward2017) and saline ice (Snyder and others, Reference Snyder, Schulson and Renshaw2016), inelastic deformation at this strain rate is partially accommodated by closure of brine pockets and drainage channels and, beginning at about one-quarter to one-third of the peak strength, by the initiation of non-propagating microcracks. After the stress was applied, a series of 10 cm diameter vertical boreholes were drilled into the ice in front of the indentor to 50 cm depth (Fig. 3). The depth of the borehole was controlled by drilling to a depth marked on the drill bit and varied within ±1 cm. The rate at which the holes filled with water was recorded using a Sea•Bird® pressure sensor. The rate of filling was used to estimate the permeability of the ice, as described below. To determine the undeformed permeability of the ice before the indentor was activated, separate 50 cm deep boreholes were drilled at locations at least several meters away from the indentor and then tested. To ensure that the permeabilities of these remote locations were unaffected by the activating/loading of the indentor, a new remote borehole was drilled and tested after the loading. Two separate indentation tests were performed on separate days in separate locations. The total duration of the first set of indentation and permeability tests was ~20 min, while the second set of tests was completed in ~10 min.

Fig. 2. Field scale indentor lowered into the rectangular hole cut into the ice.

Fig. 3. Schematic of permeability borehole locations and coordinate system used in determining stress field.
2.3. Permeability test
The filling of the drilled hole in ice with water is similar to a groundwater ‘slug test’ where observation of the rate of water-level change in a well is used to determine the permeability, k, near the well (Freitag, Reference Freitag1999; Eicken and others, Reference Eicken, Krouse, Kadko and Perovich2002). Analyses of slug test data are generally based on analytical solutions for two- or three-dimensional flow to the well and are usually of the form
 $$k = F\displaystyle{\nu \over {\rho gt}}\ln \left( {\displaystyle{{h_o} \over h}} \right),$$
where ν and ρ are the fluid dynamic viscosity and density, respectively, g is gravitational acceleration, h is the hydraulic head, with h = h o at time t = 0, and F is a characteristic length shape factor that depends on the flow geometry (Hvorslev, Reference Hvorslev1951; Bouwer and Rice, Reference Bouwer and Rice1976; Freitag, Reference Freitag1999). Here the hydraulic head is the difference in height between open water surface elevation and the borehole water level. Defining the dimensionless time and hydraulic head as
 $$h_{\rm D} = \displaystyle{h \over {h_o}} \quad \quad \quad t_{\rm D} = \displaystyle{{k\rho g} \over {\nu L}}t,$$
where L is the distance between the bottom of the borehole and the bottom of the ice pack, the expected change in hydraulic head in the borehole over time can be written as
 $$h_{\rm D} = {\rm e}^{ - t_{\rm D}}. $$
Although the boreholes were not cased, water was observed to only enter from the bottom of the hole during the permeability tests; i.e., none was observed to enter from the sides. No water entered holes drilled to depths <50 cm. This is consistent with both the expected low permeability of the colder ice along the walls of the borehole and the strong anisotropy in the permeability of columnar ice, where, at least in laboratory-scale samples of fresh water ice, permeability along the columns is greater than across the columns (Renshaw and others, Reference Renshaw, Schulson and Sgward2017). Laboratory measurements of the permeability of Arctic summer sea ice indicate that the along-column permeability, k v, is up to two orders of magnitude higher than the across-column permeability, k h (Freitag, Reference Freitag1999).
The strong permeability anisotropy of columnar ice implies that flow below the borehole is likely nearly one dimensional in the vertical direction. In this case, the test is essentially equivalent to a falling head permeameter test (e.g., Fetter, Reference Fetter1988) where the shape factor F = L/ γ, where γ is a correction factor for lateral flow that depends on L and on the permeability ratio k h/k v. Freitag (Reference Freitag1999) determined γ by numerically simulating slug tests in a transversely isotropic medium. For a length L appropriate for our tests (0.09 m), Freitag (Reference Freitag1999) estimated γ = 3 for k h/k v = 1.0 and γ = 1.1 for k h/k v = 0.1. That is, Eqn (1) slightly overestimates the vertical permeability due to lateral flow. However, in contrast to our observations of no fluid flow in the colder ice above the bottom of the borehole, the analysis of Freitag (Reference Freitag1999) assumes the ice is permeable at depths above the bottom of the borehole. Figure 4 shows the results from a numerical analysis similar to that of Freitag (Reference Freitag1999) except that in this case the ice is assumed impermeable above the bottom of the borehole (i.e., at depths <50 cm). Lateral flow results in a more rapid filling of the borehole (more rapid decrease in hydraulic head) and thus an overestimation of vertical permeability by Eqn (1). For k h/k v = 1.0, Eqn (1) overestimates k v by a factor of ~5, decreasing to a factor of ~2 for k h/k v = 0.1 and to a factor of ~1.2 for k h/k v = 0.01. For k h/k v < 0.001, γ ~1. Additional uncertainty in the estimated permeability arises from variations in the borehole depth, which directly affects L. The uncertainty in borehole depth (±1 cm) corresponds to a 10% uncertainty in the estimated permeability. Thus, estimates of k v using Eqn (1) are correct to within an order of magnitude or better for k h/k v ⩽ 1.0 for the observed variations in borehole depth. To the extent that the ratio k h/k v is constant, the relative difference in k v between two boreholes as determined using Eqn (1) is accurate within ~10%.

Fig. 4. Rate of decrease in hydraulic head versus time for a slug test with L = 0.09 m and the indicated permeability ratio. For k h/k v < 0.001, the rate of decrease in hydraulic head is as predicted by Eqn (1) (solid line) with F = L (γ = 1).
3. RESULTS
Typical water level versus time results for the filling of a borehole in undeformed and deformed (i.e., remote from, and in front of, the indentor) ice are compared with the model solution (Eqn. 3) in Figure 5. Equally good matches between the model and observed changes in hydraulic heads occurred in all tests except those where either no water infiltrated into the borehole over 10 min or more, corresponding to a permeability <10−10 cm2, or, in one case, where the borehole entirely filled in the ~10 s required to remove the drill and place the pressure sensor, corresponding to a permeability >10−5 cm2.
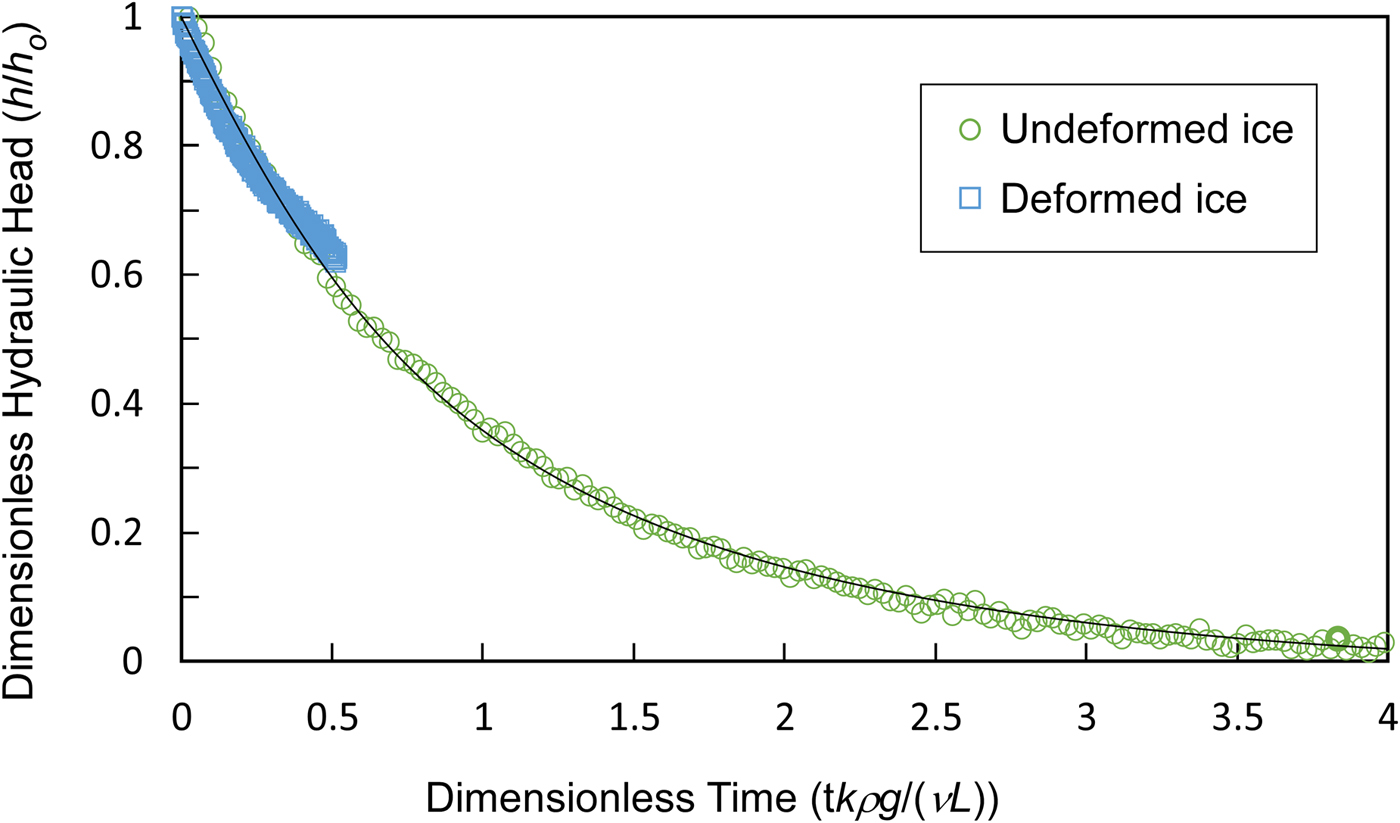
Fig. 5. Typical variation of hydraulic head in undeformed and deformed ice. Solid line is analytical solution (Eqn (3)).
The permeability of undeformed ice was remarkably consistent within the test area, only varying between 1 × 10⁻⁶ and 2 × 10⁻⁶ cm2 in two tests in remote locations, one before the indentor was loaded and one after (Fig. 6). The permeability of the undeformed ice is likely more heterogeneous than reflected in these tests, yet less so than typically observed in undeformed sea ice because of the protected nature of the cove. In contrast, in the deformed ice ahead of the indentor, the permeability ranged over many orders of magnitude, to more than four orders of magnitude lower than that of undeformed ice (the detection limit of our methodology) in holes 10 cm from the indentor, to, in one test, more than an order of magnitude higher than undeformed ice (the maximum measureable permeability) 30 cm away from the indentor. This variation in permeability is far greater than the uncertainty in the slug test analysis due to the unknown permeability ratio k h/k v and variations in borehole depth. While reductions in permeability were generally greatest nearer the indentor, changes in permeability at a given location relative to the loading plate were not consistent across the two indentation tests, likely at least partially due to differences in the deformation field ahead of the indentor due to unequal loading of the plate by the two hydraulic rams during the second test. Nonetheless, the tests demonstrate that inelastic deformation can decrease sea-ice permeability by orders of magnitude in some locations and possibly increase permeability elsewhere.
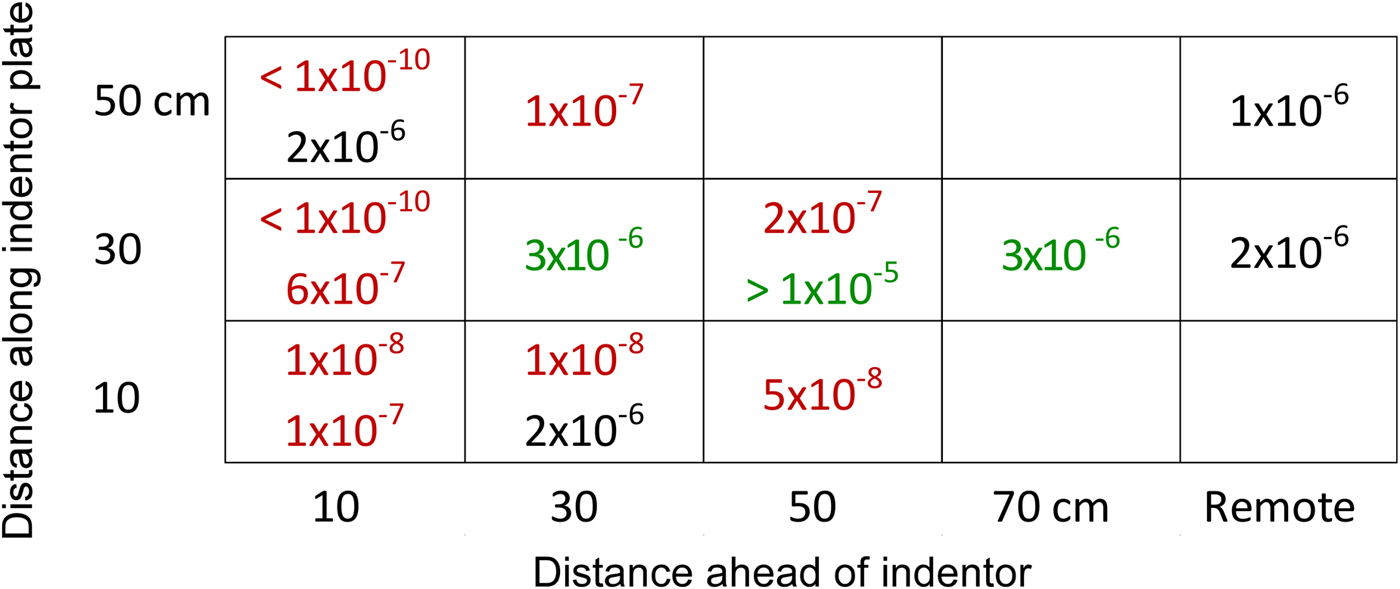
Fig. 6. Permeabilities (cm2) in front of 60 cm wide plate loading of ~750 kPa. Font color indicates decrease (red) or increase (green) in permeability relative to undeformed ice (black). Multiple numbers in single table cell indicate results from two different tests.
4. DISCUSSION
Increased compressive stress in fresh or saline ice can impact permeability both by changing the ice temperature (Marchenko and Lishman, Reference Marchenko and Lishman2017) and by deformation-induced changes in the ice microstructure. In our field experiments, temperature changes of up to several degrees were measured in the upper ~10 cm of ice with the onset of compression, but more muted changes (less than a degree) occurred at greater depths and likely only modestly impacted ice permeability there. Deformation impacts permeability via a variety of processes. Ice grain crushing and possibly recrystallization decrease grain size which, in porous granular materials, is correlated with a reduction in permeability (e.g., Shepherd, Reference Shepherd1989). However, as the applied compressive stress of ~0.75 MPa is less than the compressive strength of the ice (see below), it is likely that any grain refinement ahead of the indentor was limited/negligible and thus this process is likely not a significant contributor to permeability changes in our experiments. Changes in the permeability ahead of the indentor were most likely due to either the opening of new cracks, thereby increasing the permeability, and/or the closure of cracks and the conversion of brine channels to brine pockets (Marchenko and Lishman, Reference Marchenko and Lishman2017), thereby decreasing the permeability. For example, if the ratio of brine channel diameter to spacing were 0.1 (e.g., 1 cm diameter channels spaced 10 cm apart), it would take 103 s to close the brine channels at a strain rate of 10−4 s−1. This is similar to the duration of loading in our experiments.
The stress field induced by the indentor can be approximated by the solution for the stress in an elastic half space subject to a plate loading of pressure P (e.g., Terzaghi, Reference Terzaghi1946)
 $$\sigma _1 = \displaystyle{P \over \pi} \left( {\beta + \sin \beta} \right)\quad \quad \sigma _3 = \displaystyle{P \over \pi} \left( {\beta - \sin \beta} \right),$$
where σ 1 and σ 3 are the highest and lowest principal stresses, respectively (compressive stress is taken as a positive quantity), and β is the angle between two lines from the point of interest and either end of the plate (Fig. 3). Kim and others (Reference Kim, Golding, Schulson, Løset and Renshaw2012) showed that within the highly confined region ahead of an indentor, microcracking associated with frictional sliding is suppressed and the dominant mode of deformation is ductile. Frictional sliding is suppressed where the confinement ratio R = σ 3/σ 1 exceeds a critical value R c, which depends on the coefficient of friction, μ (Schulson and Duval, Reference Schulson and Duval2009).
 $$R_{\rm c} = \displaystyle{{\left( {1 + \mu} \right)^{1/2} - \mu} \over {\left( {1 + \mu} \right)^{1/2} + \mu}}. $$
The coefficient of friction of saline ice depends on both the temperature and sliding velocity (Schulson, Reference Schulson2015). For the conditions of the field indentation test (average temperature of ~−10 °C, sliding velocity of order 10−6 ms−1 where velocity was estimated from the product of grain size and strain rate), μ = 0.5 (Kennedy and others, Reference Kennedy, Schulson and Jones2000; Schulson and Fortt, Reference Schulson and Fortt2012), the corresponding critical confinement ratio is R c = 0.38. Using this critical value, the highly confined region ahead of the indentor where R > R c is shown by the red shading in Figure 7. Within this region, the permeability of the ice generally decreased, in many cases by orders of magnitude, likely indicating the closure of cracks and brine channels.
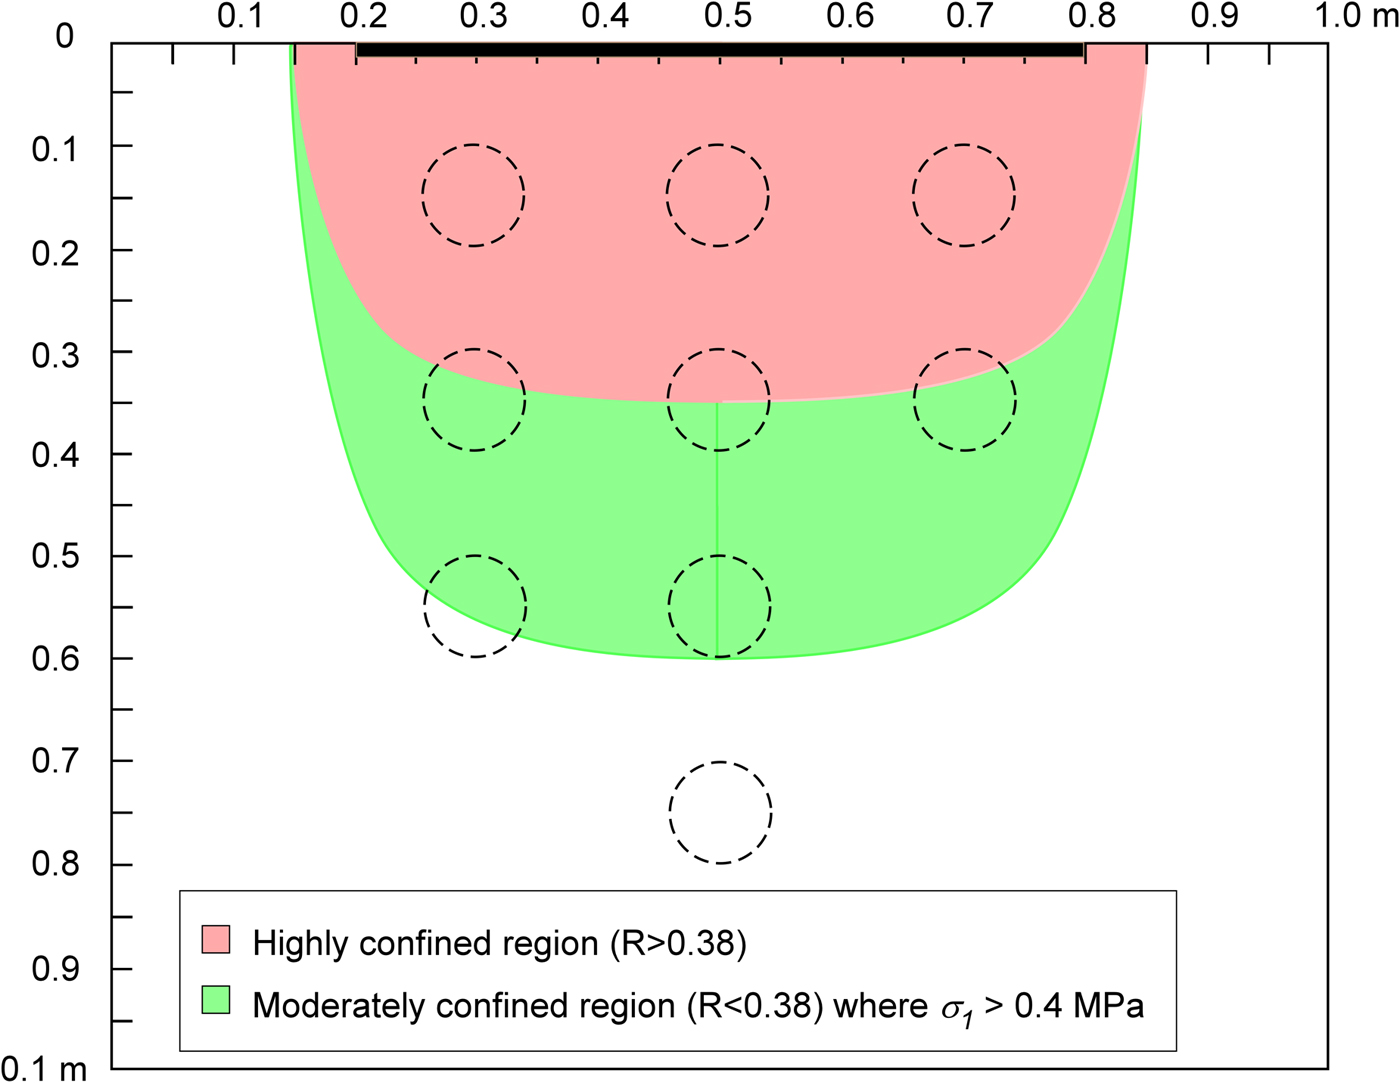
Fig. 7. Stress field in elastic half space subject to 60 cm wide plate (bold line) loading of 500 kPa. Crack closure and reduced permeability is expected in the shaded red region where the confinement R > 0.38, sufficient to inhibit frictional sliding for coefficients of friction μ > 0.5. Microcracking and enhanced permeability is expected in the shaded green region where R < 0.38 and σ 1 > 0.4 MPa. The dashed circles indicate permeability borehole locations.
Marchenko and Cole (Reference Marchenko and Cole2017) found that when saline ice permeability is >10−9 cm2, wave-energy dissipation is dominated by the migration of liquid brine through the ice. However, cyclic deformation of ice layers caused by wave-induced bending deformation induces compressive stresses within the ice. If the ice is confined and the compression sufficient (i.e., above some critical wave amplitude), the compressive stresses may decrease the permeability of the ice below 10−9 cm2 (such as occurred near the indentor), inhibiting brine migration and limiting wave-energy dissipation. Compression induced by smaller amplitude waves may not be sufficient to sufficiently decrease the permeability to inhibit brine migration. This suggests there may be a critical wave amplitude at which wave-energy dissipation by ice is significantly reduced; wave amplitudes above this critical value sufficiently decrease the permeability of the ice to inhibit brine migration, decreasing wave-energy dissipation.
Microcracking and attendant increases in permeabilty are expected to occur outside of the highly confined region if stress is sufficient for crack initiation. In laboratory studies of fresh and saline columnar ice at −10 °C, microcracking is inferred to initiate by the onset of acoustic emissions at a compressive stress of approximately one-quarter to one-third of the compressive strength, which for unconfined ice at −5 °C is a few MPa (Schulson and Duval, Reference Schulson and Duval2009; Renshaw and others, Reference Renshaw, Schulson and Sgward2017). For example, Renshaw and others (Reference Renshaw, Schulson and Sgward2017) observed the onset of acoustic emissions in laboratory-scale samples of fresh water ice compressed across the columns at a stress of 0.4 MPa. Using this as a representative value, the region where the confinement is sufficiently low for frictional sliding to occur (R < R c) and where the stress is sufficiently high to initiate microcracking is shown by the green shaded region in Figure 7. Increases in permeability generally occur within this region, although, with one notable exception, the increase in permeability is slight and perhaps not even significant given the expected heterogeneity of ice permeability.
Measured stresses in the sea-ice cover on the Arctic Ocean are generally a few tens up to about one hundred kPa (Richter-Menge and others, Reference Richter-Menge, McNutt, Overland and Kwok2002; Tremblay and Hakakian, Reference Tremblay and Hakakian2006) and wave-induced stresses in saline ice are generally a few hundred kPa or less for wavelengths >100 m (Marchenko and Cole, Reference Marchenko and Cole2017). These stresses are generally below that required to initiate microcracking in laboratory samples. This suggests that creep deformation is more likely to decrease ice permeability via the closure of both cracks and brine channels rather than to increase permeability via the initiation of new cracks. Within the high stress, high confinement region just ahead of the indentor, we observed decreases in permeability of several orders of magnitude (Fig. 6), with the decrease in permeability just ahead of the indentor sufficient for brine migration to no longer be the dominant mechanism of wave-energy dissipation (Marchenko and Cole, Reference Marchenko and Cole2017).
Deformation-induced changes in permeability within natural ice pack may not be as dramatic due to differences in the level of stress, confinement and strain rate. Nonetheless, our results demonstrate that dramatic changes in permeability due to deformation are possible. Given the possible impact of permeability changes on critical sea-ice processes, including wave-energy dissipation, especially in late summer and early fall when the ice is warm and the fetch long, our results suggest that further work is warranted to more fully understand the impact of ice deformation on sea-ice permeability, particularly as increasing open water fetches generate larger waves, which may propagate farther into the pack ice and potentially break it up. The potential for ice break-up may be enhanced if the amplitude of the larger waves exceeds the critical amplitude, above which wave-energy dissipation associated with brine migration is significantly reduced.
Acknowledgement
This work was partially supported by funding from the National Science Foundation (EAR – 1519706). Additional support for the fieldwork was provided by the Research Council of Norway (Sustainable Arctic Coastal and Marine Technology) and the Norwegian Centre for International Cooperation in Education (Safety of Industrial Development and Transportation Routes in the Arctic). All data from this work are available from the authors.


 Open access