


1. INTRODUCTION
Cumulative mass loss from glaciers and ice caps in Canada's Queen Elizabeth Islands (QEI, Fig. 1) from 2002/03 to 2014/15, has been estimated to be 762.6 Gt using data from the Gravity Recovery and Climate Experiment (GRACE) (Sharp and others, Reference Sharp2015). Glacier mass balances in the QEI, which contain 14% of Earth's glacier area outside the major ice sheets of Greenland and Antarctica (Arendt and others, Reference Arendt2012), have been consistently negative since measurements began in the late 1950s (Koerner, Reference Koerner2005; Sharp and others, Reference Sharp2011), and the rate of mass loss from the region nearly tripled between 2004–06 and 2007–09 (Gardner and others, Reference Gardner2011; Lenaerts and others, Reference Lenaerts2013; Millan and others, Reference Millan, Mouginot and Rignot2017). Changes in the elevation of a glacier surface are controlled by the basal-climatic mass balance of the glacier (the sum of the climatic and basal mass balances) and by ice dynamics. For a glacier in steady state, the climatic mass balance of a region of a glacier (the sum of the surface and internal mass balances) is balanced by the flux divergence (the difference between the vertically integrated mass fluxes into and out of the region) (Cogley and others, Reference Cogley2011). In the QEI, glacier mass change during the period 1991–2015 has been attributed primarily to changes in the surface mass balance, with ice dynamics accounting for only ~10% of the observed mass loss (Millan and others, Reference Millan, Mouginot and Rignot2017).

Fig. 1. Glaciated regions of the Queen Elizabeth Islands (QEI). Background image: MODIS, 4 July 2011. Inset: red polygon shows the location of QEI, Arctic Canada.
In a glacier's accumulation zone, warmer air and surface temperatures increase both the amount of melt and the depth of meltwater percolation into the firn layer, simultaneously raising the near-surface ice/firn temperature through latent heat release during freezing and increasing the rate of firn densification (Pfeffer and Humphrey, Reference Pfeffer and Humphrey1998; Zdanowicz and others, Reference Zdanowicz2012; Bezeau and others, Reference Bezeau, Sharp, Burgess and Gascon2013). These processes both result in lowering of the glacier's surface elevation, though meltwater that freezes within the firn is not lost from the glacier. In the glacier's ablation area, where bare glacier ice is exposed at the surface during the summer, higher summer air and surface temperatures result in increased melting and mass loss, and thus in glacier thinning. Changes in surface accumulation rates (via solid precipitation, wind redistribution of snow and/or avalanching) can also alter the elevation of the glacier surface. However, annual precipitation in the QEI is low (<400 mm w.e. a−1, Braithwaite, Reference Braithwaite2005) and interannual variability in precipitation is small compared with variability in melt rates. Interannual variability and longer-term trends in the annual mass balance of QEI glaciers are thus controlled primarily by variability in summer air temperatures and surface melt (Koerner, Reference Koerner2005).
Recent increases in summer melt rates, inferred from QEI summer land surface temperatures (LST) (which increased by nearly 1°C from 2000 to 2015; Mortimer and others (Reference Mortimer, Sharp and Wouters2016)), are therefore expected to have resulted in thinning of these ice masses unless there was a compensating reduction in rates of ice flow. Higher air and surface temperatures drive decreases in albedo (the ratio of outgoing to incoming solar radiation) that enhance surface warming and/or melt, leading to further decreases in the surface albedo (Warren and Wiscombe, Reference Warren and Wiscombe1980; Colbeck, Reference Colbeck1982). This positive ice-albedo feedback was observed over the majority of the QEI ice cover from 2001 to 2016, when the regional glacier mean summer black-sky shortwave broadband albedo (BSA) decreased by 0.046 (Mortimer and Sharp, Reference Mortimer and Sharp2018). This feedback is expected to have enhanced surface melt rates and glacier thinning.
Changes in ice flow, inferred from variations in ice surface velocity, alter the mass transfer into and/or out of a region of a glacier, resulting in localized thinning or thickening. Flow velocities of outlet glaciers in the QEI can be highly variable (e.g. Short and Gray, Reference Short and Gray2005; Burgess and Sharp, Reference Burgess and Sharp2008; Williamson and others, Reference Williamson, Sharp, Dowdeswell and Benham2008) and may result in changes in ice thickness that are largely independent of changes in climate. Surface velocities on QEI glaciers and ice caps were relatively stable over the period 1991–2015, except along outlet glaciers where large variations in velocity (>~20 m a−1) were common (van Wychen and others, Reference van Wychen2016; Reference van Wychen2017; Millan and others, Reference Millan, Mouginot and Rignot2017). Rapid changes in surface velocity in the eastern QEI during this period have been linked to changes in glacier thickness (van Wychen and others, Reference van Wychen2016). These comparisons were limited to only three glaciers (Dobbin, Parrish, and Trinity), however, and the extent to which recent changes in glacier surface elevation elsewhere in the QEI are linked to changes in ice dynamics is not well known.
Repeat airborne altimetry measurements made over ice caps in the QEI in 1995 and 2000 revealed overall thinning (generally <0.5 m a−1) during this 5-year period, although strong thinning at lower elevations was countered by thickening at higher elevations in the interior of most ice masses (Abdalati and others, Reference Abdalati2004). Using the flux imbalance method, Colgan and others (Reference Colgan, Davis and Sharp2008) inferred thickening (or no change in surface elevation) in the northwest sector of the Devon Ice Cap during this same time period and thinning in the southeast. It is not known whether these spatial patterns of glacier and ice cap surface elevation change have persisted to the present day. Repeat satellite laser altimetry revealed QEI-wide surface lowering (average dh/dt: −0.38 ± 0.04 m a−1) between 2003 and 2009 (Gardner and others, Reference Gardner2011; Reference Gardner2013), but the relative contributions of changes in climatic mass balance and ice dynamics to the rate of elevation change (dh/dt) were not examined.
Here, we investigate spatial and temporal patterns in rates of glacier surface elevation change (dh/dt) in the QEI over the period 1995–2014 using repeat-track airborne laser altimetry data collected using NASA's Airborne Topographic Mapper (ATM). Observed changes in remotely-sensed ice surface temperature, albedo and surface longitudinal strain rates are compared with measured changes in dh/dt to qualitatively assess the relative influences of changes in the climatic mass balance and ice dynamics on glacier and ice cap surface elevations between 2000 and 2014.
2. DATA AND METHODS
2.1. Repeat airborne altimetry measurements
Repeat-track measurements of glacier and ice cap surface elevations in the QEI were acquired by airborne laser altimetry in the springs of 1995, 2000, 2005, 2006, 2011, 2012, 2014 and 2015 using NASA's ATM conical laser scanning system(s) (Krabill, Reference Krabill2010; Reference Krabill2012). The conical laser scanner emits sequential pulses of energy towards the Earth's surface. The time taken for an emitted pulse to return to the receiver, known as the two-way travel time (TWTT), is recorded by the sensor (Martin and others, Reference Martin2012). Precise measurements of the aircraft positioning and attitude, obtained from inertial sensors (accelerometer and gyroscope) and GPS systems, are then used to compute surface elevations from the TWTT. The ATM T1 10° off-nadir scanner system, which has a 140 m wide swath, 1–3 m footprint, ground spacing of 2–5 m (depending on aircraft speed), and nominal vertical accuracy of <0.2 m, was used in 1995 (Krabill and others, Reference Krabill2002; Abdalati and others, Reference Abdalati2004). From 2000 to 2006 data were collected using the ATM T2 15° system (250 m swath width, 1 m footprint, ~2 m ground spacing (depending on aircraft speed), nominal vertical accuracy of <0.2 m; (Krabill and others, Reference Krabill2002; Abdalati and others, Reference Abdalati2004; Krabill, Reference Krabill2014a; Reference Krabill2014b)). Between 2011 and 2015, the ATM T4 30° system (230 m swath width, 0.5 m footprint, measurement density of 1 laser shot per <1 m2, nominal vertical accuracy <0.1 m) was used (Martin and others, Reference Martin2012; Krabill, Reference Krabill2014a; Reference Krabill2014b).
Comparison of the surface elevations of coincident points measured in different airborne altimetry surveys enables calculation of the rate of elevation change (dh/dt) between the two surveys at a specific location. NASA's Level 4 Surface Elevation Rate of Change, Version 1 product (IDHDT4; Krabill, Reference Krabill2014a) uses the ATM wide-scan Level 1B Qfit Elevation and Return Strength dataset to obtain estimates of surface elevation change. The IDHDT4 routine identifies locations where the track spacing of overlapping data from two different campaign years (referred to as the reference and test data) is <200 m. For each reference data point, all test data points within a 2.5 m search radius are identified. If the number of data pairs for a given reference data point is >500, the absolute surface elevation difference for each data pair is computed. Data pairs having an absolute elevation difference >300 m are removed and dh/dt for a given overlap location is computed by dividing the average elevation change of all remaining data pairs by the time-period between measurements (Krabill, Reference Krabill2014b). Outputs are provided as discrete points with a nominal spatial resolution of 250 m × 250 m, referenced to the WGS84 ellipsoid. IDHDT4 surface elevation change estimates do not account for crustal uplift, which for the QEI was estimated to be <7 mm a−1 from continuous dGPS measurements made between 2008 and 2014 at a station on bedrock adjacent to the Belcher Glacier, Devon Ice Cap (B. Danielson personal communication 2015). Elevation measurement accuracy from NASA's ATM instruments is <10 cm (Krabill and others, Reference Krabill2002) and <5.4 cm for the more recent scanner systems (Kwok and others, Reference Kwok, Cunningham, Manizade and Krabill2012; Martin and others, Reference Martin2012). Uncertainty assessments specific to the IDHDT4 product are not provided because the ILATM1B data, which are used as input, undergo extensive quality assessment. Instead, the RMS error (largely dependent on surface roughness) and the number of points used in each calculation are provided and can be combined with visual interpretation of graphical outputs to qualitatively interpret the accuracy of the data (Krabill, Reference Krabill2014b). Investigation of these parameters showed no clear relationships between rates of elevation change, RMS error, number of data points, and location, so no additional filtering beyond that described below was performed.
IDHDT4 data from the QEI for the 1995–2014 period were obtained from the National Snow and Ice Data Centre (http://nsidc.org/data/idhdt4, downloaded 6 July–22 August 2016). Data from 2015 were not included due to their limited spatial coverage and the failure of the wide-swath scanner (Krabill, Reference Krabill2014a, updated 2016). To ensure that only measurements over glaciated surfaces were retained, the IDHDT4 data were clipped to the Randolph Glacier Inventory (RGI) version 5.0 Arctic Canada North region 32 polygons (Arendt and others, Reference Arendt2012; Pfeffer and others, Reference Pfeffer2014). The RGI polygons are referenced to the 1999/2000 glacier extent and do not include all small rock outcrops within ice caps. Summer 2013 Landsat 7 ETM+ and 2014 Landsat 8 OLI images were used to manually identify and remove IDHDT4 data that were not located over ice (usually data collected over small rock outcrops and areas exposed by glacier retreat since 1999/2000). Such data, which typically showed very small elevation changes (~ ± 0.001 m a−1), accounted for ~1% of all IDHDT4 data falling within the RGI polygons.
Airborne altimetry surveys were conducted every ~5 years between 1995 and 2014, but coverage varies between surveys. Surveys were conducted over the Devon Ice Cap and the Prince of Wales Icefield in 2005; the remaining ice masses were surveyed in 2006 (Krabill, Reference Krabill2012). The northern portion of Prince of Wales Icefield (Ekblaw, Leffert and Stygge glaciers) was surveyed in both 2005 and 2006. Since these glaciers are known to exhibit large variations in surface velocity (Section 3.1), dh/dt in these regions may not be representative of changes across the entire Prince of Wales Icefield. Therefore, we did not attempt to adjust the 2005 surface elevations using the 2005/06 elevation difference and only the more comprehensive 2005 ATM data were used for the Prince of Wales Icefield. Coverage over the Manson Icefield and Sydkap Ice Cap is limited after 2006. Airborne altimetry surveys were conducted over most ice masses in both 2011 and 2012 (Krabill, Reference Krabill2010). The exception to this was northwest Ellesmere Island, where ice masses were surveyed in 2014, but not in 2011 or 2012. Mean 2011–12 dh/dt for areas surveyed in both 2011 and 2012 was −0.83 ± 0.60 m a−1 with little variation between ice masses. To avoid redundancy, only the more comprehensive 2012 data are presented here. To evaluate spatial and temporal patterns in dh/dt during the 1995–2012/14 period, data were aggregated into three epochs: 1995–2000, 2000–2005/06, 2005/06–2012/14. This approach is consistent with earlier work (e.g. Abdalati and others, Reference Abdalati2004; Arendt and others, Reference Arendt2006) which regards ~5 years as the optimal time interval between repeat ATM surveys to minimize the effects of interannual variability in melt and accumulation on the measured elevation change. Finally, dh/dt anomalies relative to the 1995–2012/14 period were computed for each epoch. For each epoch, the closest data point to the 1995–2012/14 dataset point within a search radius of 150 m was identified and the dh/dt anomaly for each data pair was computed.
2.2. MODIS data
Satellite-derived measurements of LST and surface albedo from the Moderate Resolution Imaging Spectroradiometer (MODIS), onboard the Terra (2000 to present) and Aqua (2002 to present) satellites (Barnes and others, Reference Barnes, Pagano and Salomonson1998), were used to examine the likely influence of changes in the climatic mass balance on observed changes in glacier surface elevation.
2.2.1. MOD11A2 LST
This study uses the QEI MODIS LST record presented by Mortimer and others (Reference Mortimer, Sharp and Wouters2016), which used daytime LST estimates from the 8-d L3 Global Land Surface Temperature and Emissivity (MOD11A2) Collection 05 data product. These data have been found to be a reasonable proxy for the duration and/or intensity of summer melting in the QEI (Sharp and others, Reference Sharp2011; Mortimer and others, Reference Mortimer, Sharp and Wouters2016). MOD11A2 daytime and night-time LST is computed from MODIS channels 31 (11 µm) and 32 (12 µm) using a split-window technique and all available daytime clear-sky scenes from the Terra satellite for sequential 8-d periods (Wan and others, Reference Wan, Zhang, Zhang and Li2002). A conservative cloud mask is used to remove observations when clouds are present (Ackerman and others, Reference Ackerman1998), however, variability in the number of clear-sky days within each observation period and from 1 year to the next did not introduce significant variability in the MODIS-derived LST relative to the true surface temperature in the QEI (see Mortimer and others, Reference Mortimer, Sharp and Wouters2016, and references therein). MOD11A2 has a spatial resolution of 1 km × 1 km and a nominal product accuracy of ±1°C (Wan and others, Reference Wan2008), but the accuracy can be as low as ± 2°C over snow and ice surfaces (Hall and others, Reference Hall2008a; Koenig and Hall, Reference Koenig and Hall2010). Pixels for which the average LST error (QC_Day LST error flag) exceeded 2°C were removed from the analysis and any remaining pixels having a temperature >0°C were assigned a temperature of 0°C (Mortimer and others, Reference Mortimer, Sharp and Wouters2016).
2.2.2. MCD43A3 albedo
Estimates of QEI surface albedo were obtained from Mortimer and Sharp (Reference Mortimer and Sharp2018) who used surface albedo estimates from the MODIS/Terra and Aqua BRDF/Albedo Daily L3 Global – 500 m Collection 06 product (MCD43A3, Schaaf and Wang (Reference Schaaf and Wang2015)). MDC43A3 albedos are estimated from the Level 2 surface reflectance products (MOD09 and MYD09) for seven visible and near-infrared bands (spanning 0.4–2.4 µm) and three broad bands (shortwave (0.3–5.0 µm), visible (0.3–0.7 µm) and near infrared (0.7–5.0 µm)) (Strahler and others, Reference Strahler1999; Schaaf and others, Reference Schaaf2002; Reference Schaaf, Liu, Gao, Strahler, Ramachandran, Justice and Abrams2011). A semi-empirical Bidirectional Reflectance Distribution Function (BRDF) model, which describes the surface scattering/reflectance of a target as a function of illumination, is used to estimate surface albedo from directional surface reflectance information recorded by the MODIS sensors (Schaaf and others, Reference Schaaf2002; Reference Schaaf, Liu, Gao, Strahler, Ramachandran, Justice and Abrams2011; Jin and others, Reference Jin2003; Salomon and others, Reference Salomon, Schaaf, Strahler, Gao and Jin2006). MCD43A3 white-sky (bihemispherical reflectance under isotropic conditions) and black-sky (directional hemispherical reflectance) albedos are calculated daily for local solar noon from atmospherically corrected surface reflectances collected from both the Terra and Aqua satellites over a 16-d period, centred on the 9th day of each moving window (https://www.umb.edu/spectralmass/terra_aqua_modis/v006). MODIS surface reflectance data have a stated accuracy of 0.05 for solar zenith angles <75° (Vermote and others, Reference Vermote, Kotchenova and Ray2011). High-quality full inversion albedos are computed from a semi-empirical RossThick LiSparse Reciprocal (RTSLR) kernel-driven BRDF model if sufficient (>7) multi-date cloud-free observations with good angular sampling are available during a given 16-d period (Wanner and others, Reference Wanner1997; Lucht and others, Reference Lucht, Schaaf and Strahler2000; Schaaf and others, Reference Schaaf2002; Salomon and others, Reference Salomon, Schaaf, Strahler, Gao and Jin2006). If insufficient observations (<7 or poor angular sampling) are available a lower quality magnitude inversion is run (Schaaf and others, Reference Schaaf2002; Jin and others, Reference Jin2003; Liu and others, Reference Liu2009). The MCD43A2 companion quality assessment data product indicates whether a full or magnitude inversion was used. To achieve the necessary spatial coverage to allow comparison of the surface albedo with repeat airborne ATM-derived dh/dt estimates, both full and magnitude inversion albedo data were used in this study. Consistent with previous work using MCD43A3 data (e.g. Alexander and others, Reference Alexander2014; Tedesco and others, Reference Tedesco2016; Mortimer and Sharp, Reference Mortimer and Sharp2018), only trends in the black-sky broadband shortwave albedo (BSA), which are fully consistent with the white-sky albedo (WSA), are presented here.
The MODIS sensors are operating well beyond their expected productive lifetimes (Barnes and others, Reference Barnes, Pagano and Salomonson1998) and the sensors are degrading (Xiong and others, Reference Xiong2001). Effects of sensor calibration drift are mostly confined to the Terra sensor, are largest in the blue bands (B3), and decrease with increasing wavelength (Xiong and Barnes, Reference Xiong and Barnes2006). Non-physical trends in MODIS Terra data products resulting from calibration drift are well documented (e.g. Xiong and others, Reference Xiong2001; Xiong and Barnes, Reference Xiong and Barnes2006; Franz and others, Reference Franz, Kwiatkowska, Meister and McClain2008; Kwiatkowska and others, Reference Kwiatkowska, Franz, Meister, McClain and Xiong2008; Wang and others, Reference Wang2012; Lyapustin and others, Reference Lyapustin2014; Sun and others, Reference Sun2014). To mitigate effects of on-orbit calibration drift, the C6 data (used in this study) includes an additional calibration approach using time-invariant desert sites (Toller and others, Reference Toller2013) which has improved radiance measurements compared with earlier MODIS Collections (Sun and others, Reference Sun2014). Important for the current study, recent analysis of surface albedo over the Greenland ice sheet, immediately to the east of the QEI, using C6 albedo data (including the MCD43 product used in this study) identified statistically significant albedo declines over the wet snow zone (Casey and others, Reference Casey, Polashenski, Chen and Tedesco2017) that exceeded the magnitude of the residual sensor calibration uncertainty (+/−0.01) (Vermote and others, Reference Vermote, Kotchenova and Ray2011; Mortimer and Sharp Reference Mortimer and Sharp2018). For the most part, these declines are thought to be physically real (Casey and others, Reference Casey, Polashenski, Chen and Tedesco2017), which gives us confidence in the albedo trends presented here and used to interpret patterns in dh/dt. No long-term, spatially-distributed in situ albedo records exist for the QEI ice caps, so a comparison of the MODIS C6 albedo data with ground observations is not possible (Mortimer and Sharp Reference Mortimer and Sharp2018).
Cloud contamination results in the absence of data when clouds are present, and the conservative MODIS cloud mask tends to detect more clouds that are, in fact, present over snow and ice (Ackerman and others, Reference Ackerman1998; Hall and others, Reference Hall, Williams, Luthcke and DiGirolamo2008b). The absence of data when clouds are present may introduce variability in the albedo record that is not representative of true physical change. The MCD43A3 C5 albedo product was found to provide a reasonable representation of the seasonal albedo cycle of the Greenland ice sheet (e.g. Stroeve and others, Reference Stroeve, Box, Wang, Schaaf and Barret2013), immediately adjacent to the QEI. In the absence of long-term ground measurements of surface albedo in the QEI, we made the assumption that this is also the case in this region.
2.2.3. Mean summer LST and BSA
Interannual variability in the annual mass balance of QEI glaciers and ice caps is dominated by variability in the summer mass balance which, in turn, is largely controlled by changes in summer air temperature (Koerner, Reference Koerner2005). Changes in LST and BSA were, therefore, computed for the summer months (June–August). All available MOD11A2 and MCD43A3 data and accompanying quality assessment information (MCD43A2) for MODIS tiles h16v00, h17v00, h16v01 and h15v01 were downloaded from the NASA/USGS Land Processes Distributed Active Archive Center (LP DAAC) (https://lpdaac.usgs.gov/ accessed September 2014–October 2015 and November 2016). Together, these data provide complete coverage of the QEI glacier cover. Data were re-projected to a North American Albers Equal Area projection, WGS84 datum, 1 km (LST) and 500 m (BSA) spatial resolution using the MODIS re-projection tool version 4.1 (https://lpdaac.usgs.gov/tools/modis_reprojection-tool). For each year, mean summer LST was computed for pixels having at least seven of a possible twelve 8-d LST observations between 1–2 June and 28–29 August (Mortimer and others, Reference Mortimer, Sharp and Wouters2016). The mean summer BSA was calculated for pixels having at least 10 daily BSA retrievals in each month and at least 45 observations during the 1–2 June to 30–31 August period (Mortimer and Sharp, Reference Mortimer and Sharp2018). Full descriptions of the LST and BSA data processing methods used here are provided in Mortimer and others (Reference Mortimer, Sharp and Wouters2016) and Mortimer and Sharp (Reference Mortimer and Sharp2018), respectively.
2.3. Comparison of dh/dt with LST, BSA and du/dx
To investigate the influences of changes in the glacier climatic mass balance and ice dynamics on the surface elevation changes of glaciers and ice caps, the airborne-derived measurements of dh/dt were compared with measured changes in MODIS-derived LST (Mortimer and others, Reference Mortimer, Sharp and Wouters2016), BSA (Mortimer and Sharp, Reference Mortimer and Sharp2018) and surface longitudinal strain rates.
2.3.1. Mass balance
During the period 2003/04–2014/15, the MODIS-derived mean summer QEI-wide LSTs were strongly correlated with annual mass change estimates of the QEI glacier cover derived from GRACE data (r = −0.82; p < 0.01) and these LST data have been used previously as a proxy for the intensity and/or duration of summer melt (Hall and others, Reference Hall, Williams, Casey, DiGirolamo and Wan2006; Sharp and others, Reference Sharp2011; Mortimer and others, Reference Mortimer, Sharp and Wouters2016). Variability in the net absorption of shortwave radiation, which is usually the largest source of melt energy in the QEI in the summer (Gascon and others, Reference Gascon, Sharp and Bush2013), is modulated by changes in the surface albedo (van den Broeke and others, Reference van den Broeke, Smeets and van de Wal2011; Tedesco and others, Reference Tedesco2016). Albedo decreases in summer enhance surface melt rates, resulting in increased runoff, higher rates of firn compaction and densification, and more rapid glacier thinning. Here, we use changes in these two variables to infer changes in the glacier climatic mass balance. The basal mass balance, which is typically small relative to the climatic mass balance (Cuffey and Paterson, Reference Cuffey and Paterson2010), is unknown and not included in our assessment. For each IDHDT4 data point, the corresponding LST and BSA changes were extracted. The signs (increase/decrease) of the changes in LST and BSA were then used to investigate the likely influences of changes in climatic mass balance on dh/dt (Section 3.1).
Since ATM measurements were always collected in the spring, they were compared with measurements of mean summer LST (2000 onward) and BSA (2001 onward) from the preceding summer. LST and BSA changes were computed for the period 2000/01–11, except for northwest Ellesmere Island where they were computed for the period 2000/01–13. Rates of change of LST and BSA were computed from linear regressions for pixels having mean summer LST and BSA observations in at least half the years of each time interval, following the methods of Mortimer and others (Reference Mortimer, Sharp and Wouters2016) and Mortimer and Sharp (Reference Mortimer and Sharp2018). Since the presence of clouds results in missing LST and BSA data, LST and BSA change measurements are not available for all IDHDT4 data points. Comparisons of the LST, BSA and dh/dt records were only conducted for IDHDT4 data points having corresponding BSA and LST observations; this constituted ~96% of possible IDHDT4 points.
2.3.2. Ice dynamics
To identify areas on QEI glaciers and ice caps where ice dynamics appear to be contributing significantly to rates of surface elevation change, measurements of dh/dt were compared with surface longitudinal strain rates (du/dx) computed from surface velocity fields published by van Wychen and others (Reference van Wychen2016; Reference van Wychen2017). Annual mean surface velocities (summer–summer) were derived from Landsat 7 ETM+ data for 1999–2010; winter (February) velocities were derived from RADARSAT-1 (2000, 2006–10) and RADARSAT-2 (2009–15) data (van Wychen and others, Reference van Wychen2016). The spatial resolution of these datasets is 100 m and the measurement uncertainties are 19 and 8.7 m a−1 for the Landsat-derived annual surface velocities and the RADARSAT-derived winter velocities, respectively (van Wychen and others, Reference van Wychen2016; Reference van Wychen2017). Winter velocities are, on average, ~14% lower than the annual velocities and this difference increases to 15–25% towards the termini of most glaciers (van Wychen and others, Reference van Wychen2016). The RADARSAT-derived surface velocities have broader spatial coverage than the Landsat-derived measurements, which are confined mainly to larger and faster flowing outlet glaciers. In most regions, calculations of du/dx were limited to 2000 and 2006–15 (RADARSAT data) and, in many locations, data were limited to the period after 2011. Because of this, du/dx measurements from 2013 to 2015 (the period following the most recent dh/dt measurements) were also included in the analysis to ensure sufficient data coverage along all ATM survey lines.
Surface velocities were extracted every 100 m along the ATM-flight lines and the average surface velocities of 1 km long segments were computed. Longitudinal strain rates (du/dx) were calculated from these discrete 1 km long segments, with a 100 m overlap between successive du/dx measurements (to reduce the effect on the results of the choice of start and end points). For consistency between regions, a 1 km averaging length was used throughout, even though this may have introduced additional noise to the data. Segments were then smoothed with a 1 km moving average filter to remove noise from the data. The ATM flight lines do not always follow glacier flowlines and they cut across the widest parts of the interior regions of the major ice masses, so longitudinal strain rates were not always computed for flow-parallel segments. In our analysis, du/dx was computed along the entire length of each ATM flight line and no correction was made for differences between the alignment of the flightline and the direction of ice flow.
Attempts were made to quantify the expected magnitude of surface elevation change along glacier flowlines using the flux imbalance method. However, our calculations of the flux divergence overestimated the observed dh/dt by nearly one order of magnitude – an amount much larger than can be explained by the omission of the surface mass balance. This discrepancy probably arises because our calculation of dh/dt from du/dx assumed 1-D flow and did not account for lateral spreading (compression) as ice exits (enters) a region where the flow is laterally constricted. In addition, as mentioned previously, the ATM-flight lines do not always follow the central flowline of the glacier, so the velocity extracted for a given cross profile may not always be the actual peak velocity. Therefore, we did not correct values of dh/dt using the measured du/dx. Instead, we used the relative magnitudes of du/dx to identify locations where ice dynamics were likely an important contributor to changes in surface elevation. Specifically, locations where du/dx was large and of opposite sign to dh/dt were taken to be areas where it was probable that glacier dynamics made an important contribution to dh/dt, and we were careful not to interpret patterns in dh/dt as a straightforward indicator of patterns of mass change.
3. RESULTS AND DISCUSSION
Between 1995 and 2012/14, widespread thinning (surface lowering) was observed over QEI glaciers and ice caps (Fig. 2). In this study, thinning (thickening) is assumed to occur wherever |dh/dt| ⩾ 0.02 m a−1 while intermediate values (|dh/dt| < 0.02 m a−1) are taken to imply no significant change in surface elevation (see Abdalati and others, Reference Abdalati2004). For the period 1995 to 2012/14, thinning was greatest (<−0.5 m a−1) at lower elevations along the margins of the major ice masses, and there is a general trend towards lower rates of thinning at higher elevations. Thickening was observed on the east-facing slopes of the southern Prince of Wales Icefield (between ~400 and 850 m a.s.l.) and on the Agassiz Ice Cap (above ~1500 m a.s.l.). High rates of surface elevation change (thinning <−0.5 m a−1 or thickening >0.2 m a−1) were observed along portions of six previously identified surge-type glaciers (Copland and others, Reference Copland, Sharp and Dowdeswell2003; van Wychen and others, Reference van Wychen2016) on northwest Ellesmere Island (Otto Glacier), and on the Mueller (Thompson Glacier) and Agassiz (Antoinette Glacier) Ice Caps and the Prince of Wales Icefield (Taggart Lake, Ekblaw, and Wykeham glaciers). Regions of many of these glaciers underwent significant (>~20 m a−1) changes in surface velocity between 1999 and 2015 (van Wychen and others, Reference van Wychen2016; Reference van Wychen2017; Millan and others, Reference Millan, Mouginot and Rignot2017).

Fig. 2. Rate of surface elevation change (m a−1) over glaciated regions in the QEI between 1995 and 2012/14 from repeat airborne altimetry data (IDHDT4), elevation contours from CDED DEM 1:50 k.
The first two epochs (1995–2000; 2000–2005/06) are dominated by positive dh/dt anomalies relative to the 1995–2012/14 period; negative anomalies (relative to the 1995–2012/14 period) dominated the final epoch (2005/06–2012/14) (Fig. 3). Negative dh/dt anomalies (relative to the 1995–2012/14 period) were observed for >99% (89% of northwest Ellesmere Island) of dh/dt data points during the final epoch, whereas only 7% and 9% (12% and 28% for northwest Ellesmere Island) of dh/dt data points had negative dh/dt anomalies during the first and second epochs, respectively. Further comparison of the rates of surface elevation change between epochs 1: 1995–2000 (Fig. S1), 2: 2000–2005/06 (Fig. S2) and 3: 2005/06–2012/14 (Fig. S3) shows considerable temporal variability in the rate of surface elevation change over the period 1995–2012/14 (Fig. 4, Supplementary material Figs S1–S3). For all regions, except northwest Ellesmere Island, rates of glacier thinning, aggregated into 50 m elevation bins according to the average ellipsoid heights in the two end-years of each campaign period (Fig. 4), were ~3 to 6.5 times larger during the final epoch than in the previous two. On northwest Ellesmere Island, dh/dt was only ~1–2 times larger in the most recent campaign period, likely due to lower summer air and surface temperatures in that region in 2013 and 2014 (Mortimer and others, Reference Mortimer, Sharp and Wouters2016) and positive glacier mass balances in 2013 (Sharp and others, Reference Sharp2015).

Fig. 3. dh/dt anomalies (m a−1) relative to the 1995–2012/14 mean for the 1995–2000, 2000–2005/06, and 2005/06–2012/14 periods.

Fig. 4. Mean dh/dt for 50 m elevation bins for glaciated regions in the QEI between 1995 and 2012/14.
Higher rates of thinning after 2005/06 are consistent with a period of strong positive anomalies (relative to the 2000/01–2015/16 period) in air and surface temperatures, and negative anomalies in surface albedo, across the QEI ice caps from 2005 to 2012 (Mortimer and others, Reference Mortimer, Sharp and Wouters2016; Mortimer and Sharp, Reference Mortimer and Sharp2018), as well as with increasingly negative glacier mass balances since the mid 2000s (Sharp and others, Reference Sharp2011; Gardner and others, Reference Gardner2013; Lenaerts and others, Reference Lenaerts2013; Millan and others, Reference Millan, Mouginot and Rignot2017). In detail, the annual mean in situ climatic mass balance, derived by averaging the annual balances measured at four sites in the Canadian Arctic, was ~3.5 times more negative between 2005/06 and 2012 than it was between 1995 and 2005/06 (computed from data presented in Sharp and others (Reference Sharp2015)), and the annual mass loss estimates for this region from GRACE data increased at a mean rate of 11.6 Gt a−1 between 2003/04 and 2011/12 (Mortimer and others, Reference Mortimer, Sharp and Wouters2016, updated from Gardner and others, Reference Gardner2011). Mean summer (JJA) air temperatures at 700 hPa geopotential height, obtained from the NCEP/NCAR R1 Reanalysis (Kalnay and others, Reference Kalnay1996) and centred over each of the major ice masses (see Sharp and others, Reference Sharp2011; Mortimer and others, Reference Mortimer, Sharp and Wouters2016), were between 0.8°C and 1.4°C higher during 2007–12 compared with 1995–2012 mean. Summer mean near-surface (2 m) air temperatures at Eureka and Resolute Bay from 2007–12 were 1.2°C and 1.5°C higher, respectively, than the 1995–2012 means (http://climate.weather.gc.ca), and mean summer LSTs for this period (2007–12; available since 2000) were 0.63°C to 1.08°C higher than the 2000–15 mean (Mortimer and others, Reference Mortimer, Sharp and Wouters2016).
3.1. Comparison of dh/dt with LST, BSA and ice dynamics for 2000–2012/14
The relative influences of changes in the glacier climatic mass balance and ice dynamics on observed changes in glacier and ice cap surface elevation are assessed for the period 2000–2012/14 (Section 2.3). This period (rather than 1995–2012/14) is used because the remote sensing derived LST, albedo and surface velocity measurements are only available beginning in 2000 (Section 2.3). For this time period (2000–2012/14), either thickening or no change in surface elevation (dh/dt ⩾−0.02 m a−1) was observed at higher elevations in the interior regions of most ice masses (Fig. 5a), similar to the 1995–2012/14 period. Local thickening > + 0.2 m a−1 was observed at lower elevations on southern Prince of Wales Icefield (between ~380 and 700 m a.s.l.) and along sections of the Wykeham, Ekblaw and Antoinette glaciers, as well as on the eastern Devon Ice Cap where the north-south running ATM survey line crosses the Southeast 1 and 2 glacier drainage basins.

Fig. 5. Comparison of surface elevation change, longitudinal strain rates, temperature and albedo change for the 2000–2012/14 period. (a) dh/dt (m a−1) for 2000–2012/14, (b) mean du/dx (a−1) from available velocity data between 2000 and 2015, (c) comparison of dh/dt with mean summer LST and BSA change.
Changes in the elevation of a glacier surface are controlled by the basal-climatic mass balance of the glacier and by ice dynamics. Annual precipitation in the QEI is low (<400 mm w.e. a−1, Braithwaite (Reference Braithwaite2005)) and temporal variability in the annual glacier mass balance is dominated by changes in summer melt (Koerner, Reference Koerner2005). As discussed in Section 2.3.1, the basal mass balance is typically small relative to the climatic mass balance (Cuffey and Paterson, Reference Cuffey and Paterson2010) and is not included in our assessment. Changes in the mean summer LST and BSA are therefore used to infer the likely sign of the glacier climatic mass balance (Section 2.3.1). Specifically, an increase (decrease) in LST, together with a decrease (increase) in BSA, is taken to imply a high probability of a negative (positive) climatic mass balance. Under this scenario, if the LST change is positive and BSA change is negative, thinning is expected unless there was a compensating reduction in surface longitudinal velocity gradients.
During the 2000–2012/14 period, wherever surface velocities were low (<~20 m a−1, see van Wychen and others, Reference van Wychen2016), as in the interior regions of the ice masses, there was generally good agreement between the trends in LST and BSA (Fig. 5c) and the sign of dh/dt (Fig. 5a). There were, however, some exceptions, namely on southern Prince of Wales Icefield (between ~380 and 700 m a.s.l.), and at high elevations on northwest Ellesmere Island (>~1750 m a.s.l.), and on the Agassiz (>~1670 m a.s.l.) and Devon (~1900 m a.s.l.) ice caps (Section 3.1.1). In contrast, where surface velocities were high (>~75 m a−1), for example along many outlet glaciers (see van Wychen and others, Reference van Wychen2016; Reference van Wychen2017; Millan and others, Reference Millan, Mouginot and Rignot2017), the sign of dh/dt was often the opposite of what would have been expected from the observed changes in LST and BSA; suggesting that, in addition to changes in the glacier climatic mass balance, evolving ice dynamics had a significant influence on rates of surface elevation change along fast-flowing outlet glaciers.
To assess the relative influence of changing ice flow on observed changes in glacier and ice cap surface elevation, |du/dx| (Fig. 5b) was compared with dh/dt (Fig. 5a) for the period 2000–2012/14. We find that, in general, |du/dx | was at least one order of magnitude larger along outlet glaciers (where |dh/dt| can exceed 1 m a−1) than elsewhere (where |dh/dt| is typically <0.5 m a−1). The large and distinct difference in the relative magnitude of |du/dx| between regions with large and spatially variable dh/dt and regions where dh/dt is smaller and more spatially uniform, provides a means of differentiating between areas where ice dynamics (in addition to changes in glacier mass balance) are likely to have significantly influenced dh/dt and areas where changes in the glacier mass balance are likely to have been the primary driver of changes in dh/dt.
3.1.1. Low longitudinal strain rates
Where |du/dx | is consistently low, ice dynamics are expected to play only a minor role in the observed short-term (<20 years) changes in surface elevation (Cuffey and Paterson, Reference Cuffey and Paterson2010). Instead, thinning and/or thickening are likely to have been controlled primarily by the climatic mass balance of the glacier. Between 2000/01 and 2011/13, QEI-wide mean summer LST increased by 0.17 ± 0.07°C a−1 and the mean summer BSA decreased at a rate of 0.0074 ± 0.0053 a−1. During this time (2000–2012/14), thinning corresponded with an increase in LST for 86% of dh/dt data points and with a decrease in BSA for 80% of dh/dt data points. Combined analysis of the sign of dh/dt with the sign of both the LST, BSA change (Fig. 5d) shows that, in most instances where |du/dx | was small (<0.003 a−1, Fig. 5b), thinning coincided with both an increase in LST and a decrease in BSA. There were, however, some exceptions.
(1) At high elevation locations on the Agassiz Ice Cap (>~1670 m a.s.l.) a positive dh/dt coincided with an increase in LST and a decrease in BSA. dh/dt in this region was mostly within −0.02 to + 0.02 m a−1, which was taken to imply no significant change in surface elevation (Section 2.3; Abdalati and others, Reference Abdalati2004), so the apparent inconsistency between dh/dt and changes in LST and BSA, is likely a result of the binary classification method used in our analysis (Section 2.3).
(2) Along a portion of the southernmost transect across Prince of Wales Icefield (between ~380 and 700 m a.s.l.), thickening between 2000 and 2012 (rather than the expected thinning) coincided with an increase in LST and a decrease in BSA (Fig. 5c). The central portion of this transect cuts across Glacier 9's accumulation zone. Millan and others (Reference Millan, Mouginot and Rignot2017) identified a possible surge of this glacier with maximum ice discharge occurring in 2006, followed by a slowdown after 2009. However, because Glacier 9 runs perpendicular to the flight line and the bulk of our velocity measurements at this location were from 2000 and 2011–15 (Section 2.3.2), which both correspond to periods of lower ice discharge, variations in du/dx associated with this possible surge event were not captured.
(3) On Grant Ice Cap, northwest Ellesmere Island, thinning coincided with a decrease in LST and either an increase or a decrease in BSA (Fig. 5c). The apparent inconsistency between the signs of the LST and BSA changes and dh/dt is likely due to the time period used to compute LST change in this region. ATM measurements for northern Ellesmere Island were collected in 2014, instead of 2012 as was the case elsewhere in the QEI, so LST and BSA change were computed for the period 2000/01–13 (instead of 2000/01–11) (Section 2.3.1). QEI-wide mean summer LST increased (+0.17 ± 0.07°C a−1) during the 2000–11 period but no measurable change (+0.02 ± 0.03°C a−1) was observed in the QEI-wide mean summer LST during the 2000–13 period owing to anomalously low mean summer LSTs in 2013 (when regionally-averaged mean summer LSTs in northern Ellesmere Island were >4°C lower than in 2011; Table 1 in Mortimer and others (Reference Mortimer, Sharp and Wouters2016)). The occurrence of this single cold year (2013), however, did not alter the sign of dh/dt.
Table 1. Spatial variability of surface longitudinal strain rate (du/dx, 2000–15) and rate of surface elevation change (dh/dt, 2000–2012/14a) for select glaciers in the QEI (Section 2.3)

a 2005–12 for SE 1 glacier.
b Approximate distance (km) from the glacier terminus.

In the ablation area, where surface lowering coincided with an increase in LST (and |du/dx| was small), thinning probably implies a loss of glacier mass. However, in the accumulation areas of most ice masses, enhanced rates of firn densification and the formation of ice bodies within the firn layer likely contribute to surface lowering. Field observations from the Devon and Penny Ice Caps have found an increase in both the density and temperature of the firn (which increases the rate of firn densification) since the early-mid 2000s (Zdanowicz and others, Reference Zdanowicz2012; Bezeau and others, Reference Bezeau, Sharp, Burgess and Gascon2013) and identified the growth of large ice bodies within the firn layer on the Devon Ice Cap since ~2005 (Gascon and others, Reference Gascon, Sharp and Bush2013). Where this is the case, thinning and an increase in LST might reflect more rapid densification of firn rather than a loss of glacier mass.
3.1.2. Large longitudinal strain rates
Areas of high |du/dx | (>0.01 a−1) were confined mainly to outlet glaciers (Fig. 5b). In these regions, dh/dt was also large (<−1 m a−1; > + 0.2 m a−1) and highly variable (Fig. 5a). During the 2000–15 period, longitudinal strain rates in excess of ± 0.05 a−1 were observed along the Otto, Ekblaw, Wykeham and Antoinette glaciers (Fig. 5b). Localized thinning and/or thickening rates in excess of ±1 m a−1 were observed on the Otto, Antoinette, Leffert and Thompson glaciers between 2000 and 2012/14 (Fig. 5a). To further investigate the potential influence of ice dynamics on dh/dt, the relationships between du/dx and dh/dt at locations identified from Figure 5b as having |du/dx| > 0.01 a−1 were examined in greater detail. Where data allowed, the sign of dh/dt was compared with the sign of du/dx to determine whether areas of thinning (thickening) corresponded with locations of longitudinally extensional (compressive) flow (Fig. 6). Negative (positive) du/dx indicates longitudinally compressive (extensional) flow. Comparisons for the Otto, Antoinette, Ekblaw, Wykeham and SE 1 glaciers are presented in Figure 6 and summarized in Table 1.
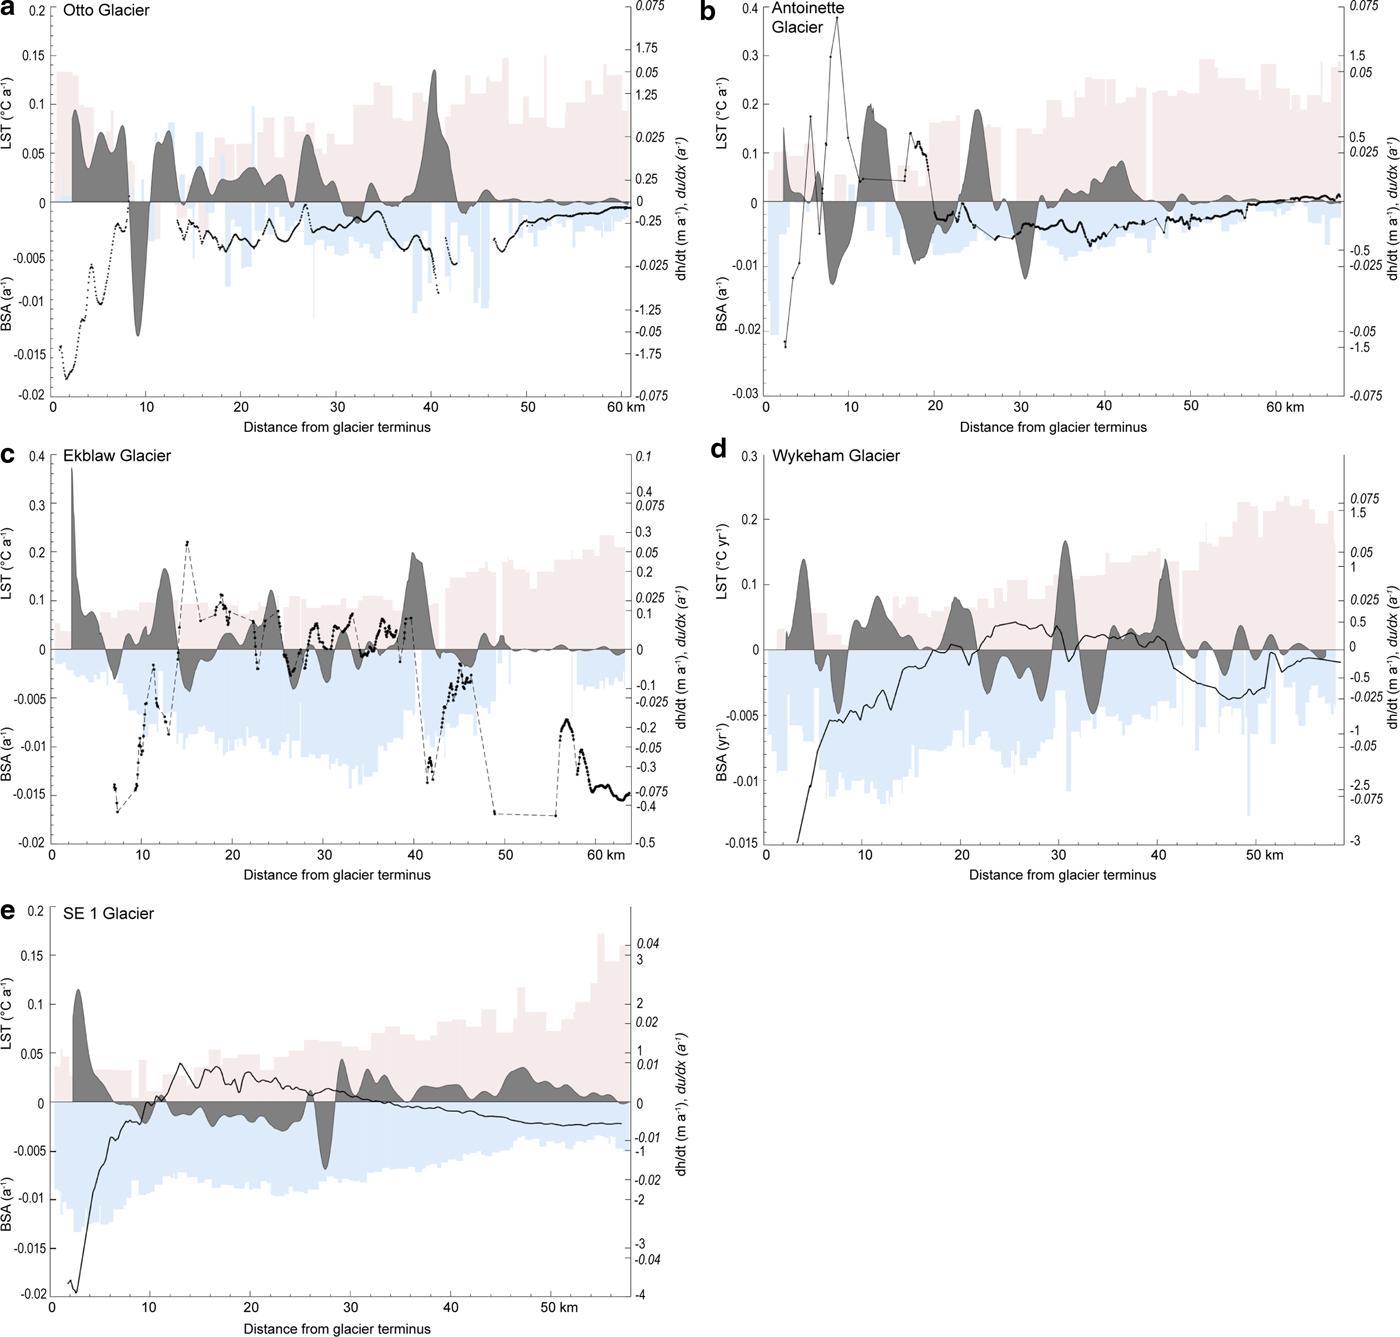
Fig. 6. Comparison of dh/dt and du/dx for specific glaciers identified as having large longitudinal strain rates and large and highly variable dh/dt in Figure 5b. Right-hand axis: mean du/dx (a−1, solid grey) computed from available annual and velocity data between 1999/2000 and 2015 (italic text). Black line indicates rate of surface elevation change (dh/dt m a−1, solid text) for 2000–2012/14 (2005–2012 for SE 1). Left-hand axis: pink and blue bar graphs indicate rate of LST (°C a−1; upper left-hand axis) and BSA (a−1; lower left-hand axis) change.
Along the glaciers examined, regions of positive (negative) dh/dt generally coincided with a negative (positive) du/dx (Fig. 6; Table 1). Thickening tended to correspond with longitudinal compression and not with an increase in BSA and a decrease in LST (as was observed in areas of low |du/dx|, Section 3.1.1). For example, along SE 1 glacier, longitudinal compression between 7 and 29 km from the glacier terminus coincided with an increase in LST (~0.05°C a−1) and a decrease in BSA (~−0.008 a−1) and thickening of up to 0.79 m a−1 was observed (Fig. 6). Along Antoinette glacier, alternating zones of longitudinal compression (~−0.03 and ~−0.0225 a−1 at 6–12 km and 16–23 km from the glacier terminus, respectively) and extension (~0.025 and ~0.0375 a−1 0–6 km and 23–28 km from the glacier terminus, respectively) corresponded with thickening (> 1.5 m a−1 (6–12 km), 0.5 m a−1 (16–23 km)) and thinning (<1 m a−1 (0–6 km) and ~0.25 m a−1 (23–28 km)), respectively (Table 1). There were no large along-glacier variations in rates of LST and/or BSA change that could account for the observed along-glacier variability in dh/dt. This pattern of alternating zones of coincident compression and thickening with coincident extension and thinning was prominent on all other glaciers examined (Fig. 6). The generally good correspondence between regions of extension (compression) and thinning (thickening), suggests that, where |du/dx| is large, ice dynamics are an important influence on patterns of dh/dt in the QEI. This inference is further supported by the apparent inconsistency between the sign of dh/dt and the signs of LST and BSA change (Figs 5c, d) in regions where |du/dx | is large (Fig. 5b).
The influence of ice dynamics on patterns of dh/dt observed in our data has important implications for the estimation of rates of glacier mass change from estimates of glacier surface elevation derived from repeat airborne altimetry measurements. For glaciers and ice caps, the relation between dh/dt and elevation is often parameterized and used to extrapolate from point measurements to estimate dh/dt for a larger region. This relation is then used to produce estimates of volume and mass change for un-surveyed areas (e.g Arendt and others, Reference Arendt, Echelmeyer, Harrison, Lingle and Valentine2002; Abdalati and others, Reference Abdalati2004; Bamber and others, Reference Bamber, Krabill, Raper, Dowdeswell and Oerlemans2005; Gardner and others, Reference Gardner2011). Previous studies (e.g. Abdalati and others, Reference Abdalati2004; Arendt and others, Reference Arendt2006; Gardner and others, Reference Gardner, Moholdt, Arendt and Wouters2012) noted large uncertainties in extrapolating dh/dt measurements derived from repeat airborne altimetry surveys to obtain regional estimates of volume change, but did not address the potential influence of ice dynamics on the relationship between dh/dt and elevation because these studies were published prior to the production of annual QEI-wide surface velocity fields (e.g. van Wychen and others, Reference van Wychen2016; Reference van Wychen2017; Millan and others, Reference Millan, Mouginot and Rignot2017). Additionally, the initial airborne altimetry surveys of 1995 and 2000 were designed to cover the widest parts of the QEI ice masses and, where possible, to traverse significant outlet glaciers (Abdalati and others, Reference Abdalati2004) so the resulting dh/dt measurements are unevenly distributed across the QEI and tend to be biased towards large outlet glaciers where evolving ice dynamics may influence patterns of dh/dt.
Examining the relationship between dh/dt and elevation in our dataset, we find that above ~1000 m a.s.l. there is a near-linear decrease in the rate of thinning with increasing elevation, except on northwest Ellesmere Island where increased rates of thinning are observed between ~750 and 1500 m a.s.l. (Fig. 7). In contrast, below ~ 800 m a.s.l. there is a large amount of scatter in dh/dt. Separating these low-elevation data by location, we find that dh/dt data points not situated along major outlet glaciers show a steady decrease in rates of thinning with increasing elevation as would be expected from a melt-driven system. In contrast, along large outlet glaciers (below ~ 800 m a.s.l.), there is generally no consistent relationship between dh/dt and elevation.
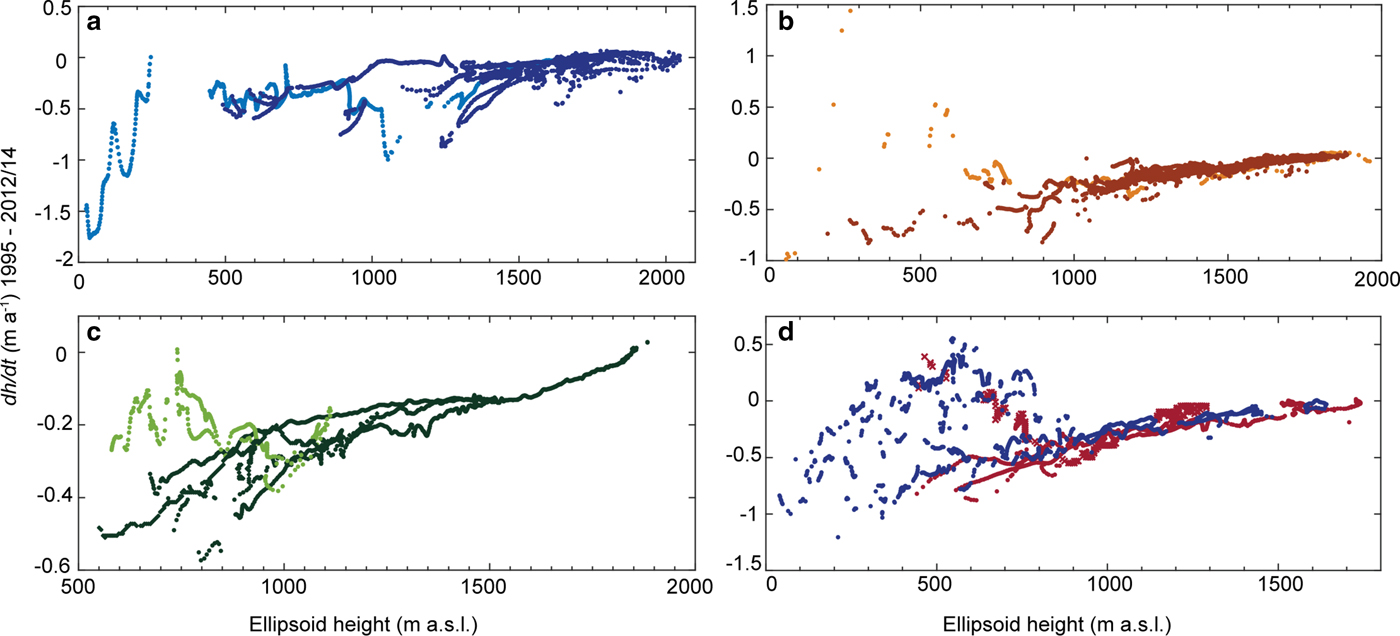
Fig. 7. dh/dt (m a−1) vs surface elevation (ellipsoid height, m a.s.l.) over glaciated regions in the QEI between 1995 and 2012/14 shown in Figure 2. (a) northern Ellesmere Island, Otto Glacier shown in light blue. (b) Agassiz Ice Cap, Antoinette Glacier centerline shown in light orange. (c) Devon Ice Cap, data from Belcher and East 6 Glaciers shown in light green. (d) Prince of Wales Icefield divided into eastern (blue) and western (red) portions, data for Taggart Lake Glacier indicated by red crosses.
A large amount of scatter and a high standard deviation was also observed in dh/dt measurements for 2003–09 from the Ice, Cloud and Land Elevation Satellite (ICESat) for elevation bins below ~700/800 m a.s.l. (Gardner and others, Reference Gardner2011, Supplementary Fig. S5). Gardner and others (Reference Gardner2011) used a third order polynomial to describe the relationship between the ICESat-derived dh/dt and elevation. This relationship was then applied to the entire QEI ice cover and used to obtain an estimate of QEI glacier mass change. Although Gardner and others (Reference Gardner2013) found good agreement between the mass change estimates obtained by mass budget modelling, repeat laser altimetry (ICESat), and repeat gravimetry data from the GRACE satellites, consideration of the possible effects of variations in ice dynamics on dh/dt may help to reduce some of the differences they obtained using the three different methods. However, we recognize that Gardner and others (Reference Gardner2011; Reference Gardner2013) could not have assessed the influence of ice dynamics on dh/dt because QEI-wide surface velocity fields for the period 2003–09 were not available.
4. CONCLUSIONS
Repeat airborne laser altimetry measurements show widespread thinning of QEI glaciers and ice caps between 1995 and 2012/14. The bulk of this thinning occurred during the 2005/06–2012/14 period when rates of thinning were >3 times larger than during the previous two pentads (1995–2000, and 2000–2005/06). Changes in the surface elevation of the QEI ice caps between 2000 and 2012/14 are attributable to the combined effects of ice dynamics and the glacier climatic mass balance. Over a majority of the QEI's ice masses, longitudinal gradients in glacier surface velocity are negligible, suggesting that ice dynamics are probably not a major influence on observed patterns of surface elevation change. In these regions, thinning generally coincided with an increase in LST and a decrease in BSA, implying that, in areas where |du/dx| was small, dh/dt was controlled primarily by the glacier climatic mass balance. Along large, fast-flowing outlet glaciers (e.g. Otto, Ekblaw, Wykeham and Antoinette glaciers) |du/dx| was at least an order of magnitude larger than in the interior regions of the ice masses. In these regions, thinning (thickening) generally coincided with locations of persistent extensional (compressive) flow, suggesting that, in addition to the glacier climatic mass balance, ice dynamics also influenced spatial patterns of dh/dt and their changes over time.
SUPPLEMENTARY MATERIAL
The supplementary material for this article can be found at https://doi.org/10.1017/jog.2018.37
ACKNOWLEDGEMENTS
We acknowledge funding from NSERC Canada (Discovery Grants to MS, Vanier Canada Graduate Scholarship to CM, Canada Graduate Scholarship to WVW), Alberta Innovates Technology Futures, the Faculty of Science, University of Alberta and the Ontario Graduate Scholarship to WVW. The NASA Airborne Topographic Mapping program (pre-Icebridge and Operation Icebridge) for conducting altimetry flights over the QEI. All NASA ATM data were downloaded from the National Snow and Ice Data Center http://nsidc.org/data/idhdt4). We thank David Burgess (Natural Resources Canada) for providing WVW with RADARSAT-2 through the Natural Resources Canada RADARSAT-2 data allocation, and two anonymous reviewers for their comments.


 Open access