


1. Introduction
As a mix of air and ice, snow exhibits unique thermophysical and optical properties, which include: (1) its high shortwave albedo and high-thermal emissivity; (2) its high-thermal insulation capacity and (3) its capacity to store and release water and energy as latent heat (Warren, Reference Warren1982; Pomeroy and Brun, Reference Pomeroy, Brun, Jones, Pomeroy, Walker and Hoham2001). The seasonal snowpack therefore has critical effects on the whole polar geosystem through many complex feedback mechanisms on aspects such as climate, permafrost, hydrology and plant ecology (Callaghan and others, Reference Callaghan2011; Park and others, Reference Park, Fedorov, Zheleznyak, Konstantinov and Walsh2015) and these effects are potentially strongest at the highest latitudes and in particular in polar deserts (Young and others, Reference Young, Brown and Labine2018), where snow covers the ground-surface for up to 10 months of the year.
Polar deserts are characterized by low winter precipitation, unevenly redistributed across the landscape during and after snowfalls by strong winds, and the predominance of non-vegetated mineral soils. These conditions make polar deserts fundamentally different from Arctic tundra regions in terms of climatic and environmental conditions (soil composition, vegetation and surface hydrology) with direct consequences on the snowpack. This recently motivated Royer and others (Reference Royer2021) to rethink the well-accepted classification of seasonal polar snowpack of Sturm and others (Reference Sturm, Holmgren and Liston1995) by creating a specific category for the polar desert snow. In particular, the polar desert snowpack stands out from that of the Arctic tundra by its lower height (~20 vs 40 cm, respectively) and higher density (~409 vs 315 kg m−3, respectively) (Royer and others, Reference Royer2021). As a thermodynamically unstable medium, snow on the ground undergoes a constant evolution through the winter following metamorphic processes (Sommerfeld and Lachapelle, Reference Sommerfeld and LaChapelle1970; Colbeck, Reference Colbeck1982). In polar deserts, the snowpack is generally comprised of two main layer types: a thin basal depth hoar layer, typically <10 cm, topped by a wind slab (Domine and others, Reference Domine2018b; Royer and others, Reference Royer2021). Depth hoar (hereinafter DH) crystals are large poorly connected hollow-faceted crystals forming layers of low-density and low-thermal conductivity, while wind slabs have opposite properties. DH formation is related to a strong vertical temperature gradient (>20°C m−1) within the early season snowpack which induces a water vapor pressure gradient. It results in an intense upward water vapor flux by diffusion from the warmer to the cooler layers of the snowpack leading to kinetic grain growth by recrystallization (Sturm and Benson, Reference Sturm and Benson1997). These upward heat and mass transfers can be enhanced by convection (Trabant and Benson, Reference Trabant and Benson1972; Sturm and Benson, Reference Sturm and Benson1997) and wind-induced air advection (wind-pumping; Cunningham and Waddington, Reference Cunningham and Waddington1993; Albert and others, Reference Albert, Grannas, Bottenheim, Shepson and Perron2002).
The formation of DH has attracted renewed scientific interest over the last decade since it causes drastic changes in the snowpack properties and has strong interactions and feedbacks with the ground-surface. Indeed, the DH layer contributes most to the snowpack thermal insulation. Its thickness and thermal conductivity are critical since they deeply influence the winter ground-surface temperature and hence the permafrost thermal regime (Sturm and Johnson, Reference Sturm and Johnson1992; Zhang and others, Reference Zhang, Osterkamp and Stamnes1996; Sturm and others, Reference Sturm, Perovich and Holmgren2002; Domine and others, Reference Domine, Barrere and Sarrazin2016b; Gouttevin and others, Reference Gouttevin2018). DH also affects the polar ecosystem, especially the vegetation (Domine and others, Reference Domine, Barrere and Morin2016a) and the subnivean life (Domine and others, Reference Domine2018a; Poirier and others, Reference Poirier, Gauthier and Domine2019) as well as soil microbial processes (Schimel and others, Reference Schimel, Bilbrough and Welker2004) by providing protection from cold temperature. Given the present and future exacerbation of climate warming in the highest latitudes, any changes in conditions required to form DH would alter the snowpack properties and would have cascading effects on permafrost and ecosystems and would change its feedback on climate. Knowledge of the processes governing DH formation in the polar snowpack and its spatio-temporal evolution is therefore essential to improve our understanding of the polar snow and its far-reaching implications on the whole polar desert geosystem. Up to now, field observations regarding DH are scarce in polar desert regions and currently snow physics models are not capable of simulating Arctic snowpack properties and in particular DH formation (Domine and others, Reference Domine, Barrere and Sarrazin2016b; Barrere and others, Reference Barrere2017; Domine and others, Reference Domine2019).
Although the DH layer is considered ubiquitous on the Arctic tundra, it is generally thinner and highly heterogeneous in the polar desert regions (Royer and others, Reference Royer2021). However, the paucity of snow studies in polar desert environments considerably limits our understanding of the spatio-temporal evolution of DH. Recently, Domine and others (Reference Domine2018b) have observed that in the polar desert of Ward Hunt Island (Canadian High Arctic), DH was totally absent at the end of winter 2015/16 in most places. In contrast, data analysis in 2017 concluded to the presence of DH at that site. That study thus highlighted that the formation of DH is not systematic in polar deserts and Domine and others (Reference Domine2018b) argued that it mainly depends on soil moisture and wind conditions. The authors hypothesized that low soil moisture allowed rapid soil freezing with little or no zero-curtain period, during which the freezing of the soil releases latent heat that maintains the temperature at 0°C (Cook, Reference Cook1955; van Everdingen, Reference van Everdingen1998). A fast soil cooling prevented the establishment of the strong temperature gradient required for DH formation. High wind speeds, combined with the low Arctic precipitation, delayed the establishment of a continuous snow cover, further hastening soil cooling. High wind speeds in the near-surface boundary layer also favor the formation of dense hard wind slabs, whose transformation into DH requires prolonged intense temperature gradients (Marbouty, Reference Marbouty1980; Domine and others, Reference Domine, Barrere and Sarrazin2016b). The hypothesis of a critical effect of soil moisture and wind conditions on the development of DH in polar desert context deserves further detailed and quantitative investigation which motivated this study.
Those previous findings demonstrated the importance of considering meteorology and soil moisture to better understand DH formation in polar deserts. Here, we explore how soil moisture, microtopography and meteorology control the spatio-temporal variability of DH formation in two polar desert sites in the Canadian High Arctic: a main site which was Ward Hunt Island (83° N) and where extensive atmospheric and soil-monitoring data are available and a secondary one, Resolute Bay (75° N), where atmospheric data are available. More specifically, this study explores whether DH is better developed over humid areas than over well-drained dry mineral soils due to the moist conditions which are expected to enhance kinetic grain growth. We also investigate whether the year-to-year variability in the thickness and properties of DH can be explained by the variability in snow and meteorological conditions, particularly regarding the snow onset date, snowpack erodability and wind conditions. To address these questions, we (1) evaluate the interannual variability in DH formation by comparing the results of Domine and others (Reference Domine2018b) in 2016 and 2017 with our observations in 2019 and analyzed their differences as a function of meteorological and soil (temperature and moisture, monitored at specific sites and inferred from vegetation and topography at others); and (2) investigate the small-scale variability of the DH layer and its link to soil moisture.
2. Study sites
Most field investigations were conducted at Ward Hunt Island (hereinafter: WHI) (83°05′ N, 74°06′ W) which is located at the northern tip of the Canadian Arctic Archipelago (Fig. 1a) (Vincent and others, Reference Vincent2011). WHI is characterized by an extreme cold and dry climate. Meteorological variables have been measured at the SILA weather station (operated by the Center for Northern Studies, CEN) located at 5 m a.s.l. on the north shore of the island (Fig. 1a). The mean annual air temperature (MAAT) has been −17.1°C for the period 2005–19 with a monthly mean ranging between −31.6°C in February and 1.7°C in July. No long-term precipitation data are available for WHI, but it is likely similar to the average of 185 mm a−1 (w.e.) measured at Alert, located 170 km to the southeast (Fig. 1a), where ~90% of the total precipitation falls as snow (Environment Canada, 2020). The prevailing and strongest winds are from the southwest to west with maximum wind speeds up to 20 m s−1.

Fig. 1. (a) Location of the study sites within the Canadian Arctic Archipelago. (b and c) Maps showing the location of snow pits and the trench as well as the instrumented sites at Resolute Bay (RB) and Ward Hunt Island (WHI). (d) Close-up of site 1 of WHI located in the downslope margin of a perennial ice patch. The red lines delimit the humid soils which are mostly associated with solifluction lobes. Background image for (b): Worldview-2 taken on 26 July 2019 (source: Esri, DigitalGlobe, GeoEye, i-cubed, USDA FSA, USGS, AEX, Getmapping, Aerogrid, IGN, IGP, swisstopo and the GIS User Community); for (c) Worldview-3 taken on 14 August 2019 and for (d): high-resolution orthomosaic derived from UAV images taken on 18 July 2019.
The island is a polar desert (vascular plant cover <5% and low lichen and bryophyte cover) but many humid zones are scattered across the landscape. Outside the hyporheic zones of Ward Hunt Lake (WHL), notable sources of water include the summer melting of the seasonal and perennial snow/ice patches, and the melting of ground ice formed in the active layer of permafrost (Paquette and others, Reference Paquette, Fortier and Vincent2017). These humid soils shelter an abundant diversity of cyanobacteria, bryophytes, lichens and plants in comparison with the adjacent dry zones dominated by well-drained coarse-grained sediments (Vincent and others, Reference Vincent2011; Comte and others, Reference Comte, Culley, Lovejoy and Vincent2018). Underneath the surface, the continuous permafrost has a mean annual temperature of −13.5°C at 3 m depth (2005–19 period) and its active layer thickness varies from 20 to 80 cm depending on the soil composition and moisture (Vincent and others, Reference Vincent2011; Paquette and others, Reference Paquette, Fortier and Vincent2017).
The other study site is located near Resolute Bay (a.k.a. Qausuittuq; hereinafter: RB) (74°45′ N, 94°50′ W) on Cornwallis Island, 1060 km to the south of WHI (Fig. 1a). Despite the distance, the region presents strong similarities with the polar desert of WHI. The permafrost is continuous and most of the land surface is largely vegetation-free (gravelly material), except in lowland patchy wetlands that support tundra vegetation (Braun and others, Reference Braun, Hardy, Bradley and Retelle2000; Woo and Young, Reference Woo and Young2006). The climate is warmer than that at WHI. The MAAT was −14.2°C for the period 2005–19 with a monthly mean ranging between −31.3°C in February and 5.1°C in July. The mean annual precipitation was 145 mm, 70% of which fell as snow, for the same period. The prevailing winds are from north to east (Environment Canada, 2020). No data of soil temperature and moisture are available for this site. The total annual precipitations measured at Alert and RB were probably underestimated due to systematic errors of gage-measured solid precipitation under snowdrift conditions (Woo and others, Reference Woo, Heron, Marsh and Steer1983).
3. Methods
We observed snow stratigraphy in numerous snow pits, made snow physical measurements and analyzed these data in light of soil properties (moisture, temperature, substrate and vegetation cover) and meteorological variables.
3.1 Snow studies
3.1.1 Snow physics
A total of 34 snow pits were dug during field campaigns in spring (late May and early June) 2019 at WHI and RB (Figs 1b, c, Fig. 2). The most comprehensive work was undertaken at WHI because numerous environmental variables are monitored (see Section 3.2). The choice of snow pit location was previously guided by the analysis of late-summer high-resolution satellite images to target both humid and dry areas (Fig. 1b). Site selection was validated in the field during snow pit excavations: dry sites had a bare gravelly surface and humid sites had a vegetation cover, a high fraction of fine-grained sediments and an organic crust (Fig. 2) that ensures greater soil moisture-holding capacity. We have considered here that humid soils define all soils that are characterized by a high liquid water content throughout the summer. Metadata information on the snow pits is provided in Table S1 in the Supplementary material.

Fig. 2. Example of snow pit excavations made at Ward Hunt Island in early June 2019 on a humid site (a: snow pit no. 2) and a dry site (b: snow pit no. 4).
Snow pit work consisted of detailed observation of stratigraphy and measurements of vertical profiles of physical properties: density, visual grain size and shape, specific surface area (SSA), thermal conductivity and temperature. Snow density ρ s (kg m–3) was obtained by weighing snow samples extracted with a vertical resolution of ~3 cm from the snowpack using a 100 cm3 metal box cutter 3 cm high. The visual grain size E (mm) and shape were determined using a millimeter-gridded plate and an 8× magnifying glass. The grain type identification and the graphical representation of snow pits used the classification of Fierz and others (Reference Fierz2009). The SSA of the snow, which is an interesting indicator of metamorphism and snow microstructure (Calonne and others, Reference Calonne2012), was determined from the snow reflectance at 1310 nm using an integrating sphere (DUFISSS instrument; Gallet and others, Reference Gallet, Domine, Zender and Picard2009), from which SSA was derived. Finally, the snow thermal conductivity was measured with a heated needle probe (TP02 model from Hukseflux; accuracy ±3% + 0.02 W m−1 K−1 at 20°C) connected to a CR1000 datalogger (Campbell Scientific) (Domine and others, Reference Domine, Bock, Morin and Giraud2011). Finally, at WHI, a 13 m long snow trench (WH-T) covering humid soil in a solifluction lobe and the adjacent dry zones was excavated to investigate the transition between both zones. The DH thickness and density were measured at 50 cm intervals along the trench.
3.1.2 Snow mapping
The spatial distribution of the snowpack over site 1 at WHI (Fig. 1d) was measured based on unmanned aerial vehicle (UAV) photogrammetry survey conducted in late spring 2019. We use a quadcopter drone (DJI Phantom 4 pro) equipped with a consumer-grade Red-Green-Blue (RGB) camera. We carried out two surveys, one on 12 June at peak accumulation and before any melt event and the second one on 18 July under snow-free conditions. The set of images collected were then processed in Pix4D mapper software (Pix4D™) which relies on structure from motion technology to generate dense 3-D point clouds of the study area. We performed low elevation flights (~30–40 m above the ground-surface) with front and side overlaps of ~75% so that ground-sampling distance is <0.5 cm. Each point cloud was accurately georeferenced using ten targets 30 cm in diameter distributed across the study areas to serve as photo-identifiable ground control points (GCPs). The targets were installed on topographic highs (e.g. ridge of solifluction lobes) that were snow-free. The coordinates of all GCPs were measured using a VX spatial station survey linked to a geodesic landmark recorded using a Global Navigation Satellite System (R8 GNSS; Trimble®, precision x − y ±8 mm and z ±15 mm). The point clouds were then gridded into high-precision digital surface models (DSMs) with a resolution of 2 cm. The method for measuring snow height consists of calculating the distance (in mm) between the snow surface cover cloud from the snow-free cloud (Nolan and others, Reference Nolan, Larsen and Sturm2015; Lendzioch and others, Reference Lendzioch, Langhammer and Jenicek2019) using the Multiscale Model to Model Cloud Comparison (M3C2) plug-in included in CloudCompare V2.11 open-source software (CloudCompare, 2020). The accuracy of the final map of snow height (in cm) was then evaluated (RMSE) using 21 hand-probe snow height measurements made across the study area. The DSM of the snow-free surface was used to calculate microtopography parameters using the topographic position index (TPI) based on the algorithm developed by Weiss (Reference Weiss2001) which allows detecting the topographic lows and highs. The TPI was calculated in ArcGIS 10.5.1 using the ArcGeomorphometry extension (Rigol-Sanchez and others, Reference Rigol-Sanchez, Stuart and Pulido-Bosch2015).
3.2 Environmental monitoring
The snow pits were interpreted based on the environmental observations, including meteorological variables and soil surface conditions (temperature and moisture) available at WHI and RB. All data were considered for the period from 15 August 2018 to 31 May 2019, hereafter called snow season 2018/19.
3.2.1 Meteorological variables
At WHI, the meteorological data were provided by the SILA automatic weather station (Fig. 1c; CEN, 2020) which recorded air temperature (150 cm above the ground level; a.g.l.) and soil surface temperature (0 cm) (44033, YSI; accuracy ±0.1°C from 0 to 70°C), wind speed and direction at 10 m a.g.l. (05103-10, RM Young; accuracy ±0.3 m s−1/±3°) as well as snow height (Sonic SR50, Campbell Scientific; accuracy ±1 cm; installed 2 m a.g.l.) (Fig. 3). All data were sampled every minute and then hourly-averaged by a CR10X datalogger (Campbell Scientific). The snow gage is located in a slight topographic break-of-slope produced by a raised-beach ridge which leads to a local snow height greater than the surrounding areas. For this reason, the raw snow height data were corrected based on the reading of a snow stake installed outside the snowdrift from daily time-lapse photographs taken by a camera installed on the SILA tower (Fig. 3 and Fig. S1). The snow height, air and soil surface temperature were used to estimate the temperature gradient (ΔT in K m−1) through the snowpack over the snow season 2018/19 based on Eqn (1):

where T soil and T snow are the temperatures at the soil and snow surfaces, respectively. The latter has not been measured directly but is considered to be equal to the air temperature measured at the SILA station during the freezing period. Since the snow surface temperature is almost always lower than the air temperature due to radiative cooling, the gradient calculated here is in fact a lower limit of the actual gradient. For RB, only hourly air temperature, wind conditions (speed and direction) and snow height were available, provided by the weather station operated by Environment and Climate Change Canada (Environment Canada, 2020).

Fig. 3. (a) View of the SILA weather station on 11 July 2016 at Ward Hunt Island. Note the remaining snowdrift at the forefront where the Sonic SR50 is installed. (b) View of site 5 on 6 July 2017, looking toward Ward Hunt Lake. The surface runoff in water tracks is clearly visible.
3.2.2 Soil surface moisture and temperature
At WHI, near-surface soil temperature and volumetric liquid water content (VWC) were recorded at SILA weather station by a thermistor (44033, YSI) and a water content reflectometer (CS-616, Campbell Scientific; accuracy ±2.5% VWC) respectively installed 5 cm depth below the soil surface. The soil surface near the station mainly consists of well-drained sand and gravel with sparse patches of vegetation (Fig. 3). We also used soil VWC and temperature data measured at a second instrumented site located in a humid zone near the shore of WHL (site 5, Fig. 1c). The site is characterized by a low-gradient slope with a series of sub-parallel water tracks mainly fed by meltwater from upslope snow patches. The soil is composed of gravel mixed with a sandy/muddy matrix with organic matter and black organic crust on the surface. It is water-saturated during most of the summer (Paquette and others, Reference Paquette, Fortier and Vincent2017; Fig. 3). The soil VWC and temperature are measured at 5 cm depth in a water track and an adjacent drier intertrack. Data are recorded by Decagon 5™ probes (accuracy ±3% WVC and ±1°C) connected to an EM50 data logger (Meter Devices). We also used the near-surface temperature for the period from August 2015 to July 2019 provided by the upper thermistor (2 cm below the soil surface) of a cable installed in a borehole of 3 m depth located 20 m north of site 5 in the same humid zone. Finally, we relied on a dataset of near-surface temperature recorded by a series of 7 data loggers Trix-8 (LogTag; resolution 0.1°C, accuracy of 0.5°C) – named LT1 to LT7 – installed in the downslope margin of a perennial ice patch (site 1; Fig. 1d). Three sensors (LT2, 4 and 5) are installed in various humid zones formed by solifluction lobes fed by meltwater while the other four (LT1, 3, 6 and 7) are installed in adjacent dry sandy-gravelly zones. The sensors are protected from humidity and ice by airtight plastic boxes and are placed ~5 cm below the soil surface to avoid any effect of direct solar radiation. To estimate the magnitude of metamorphic processes between humid and dry zones in site 1, the average temperature gradient through the snowpack was calculated using Eqn (1). The soil surface temperature was estimated from the temperature recorded by using the Trix-8 sensors and the air temperature as well as the snow height recorded at SILA station was used.
3.2.3 Snow conditions
Information on the snowpack formation at WHI, especially its onset date and the erosion events, was derived from time-lapse photographs provided by two automatic cameras (photographs every 4 h). The first one, installed on the SILA tower since 2015, takes pictures of the instrumented sites and the second one, installed since 2017, of the downslope margin of the ice patch at site 1 (Fig. 1d; Fortier and Davesne, Reference Fortier and Davesne2021).
4. Results
4.1 Small-scale variability of the snow height
Figure 4 presents the UAV-based map of snow height distribution over site 1 on 12 June 2019 (Fig. 4a) along with the TPI map showing the microtopography of this site (Fig. 4b). On average, the snow height over the study area was 34.5 ± 14.8 cm. The topographic highs, which most often correspond to the frontal lobes and lateral ridges of solifluction lobes (Verpaelst and others, Reference Verpaelst, Fortier, Kanevskiy, Paquette and Shur2017) were almost free of snow, while depressions accumulated up to 95 cm of snow for the deepest ones. The close relationship between the snow height observed at site 1 and the microtopography is also highlighted in Figures 4c, d, e.

Fig. 4. (a) Map of small-scale distribution of the snowpack on 12 June 2019 over site 1 at Ward Hunt Island obtained by UAV surveys. (b) Map of the microtopographic features based on the TPI computation. The black dots represent the 21 manual snow height measurement points. The black line delimits the humid soils which are mostly associated with solifluction lobes. Snow height (cm) and TPI along the profiles 1 (c) and 2 (d) identified by red lines in (b), and (e) shows the relationship between the snow height and the TPI for both profiles 1 and 2 with the best-fitting regression curve.
The comparison between the UAV-derived snow heights and the 21 manual measurement points over site 1 shows a strong statistical agreement (R 2 = 0.91, std dev. of 3.26 cm and RMSE of 4.1 cm; Fig. S2). Part of the offset between UAV and manual measurements can also be attributed to the bias associated with the snow probing which can overestimate by a few centimeters when the probe penetrates the ground, especially on gravel surfaces or organic soils (Stuefer and others, Reference Stuefer, Kane and Dean2020).
4.2 Snow physics
4.2.1 Depth hoar fraction
Based on the 18 snow pits excavated at WHI (WH-SP), we found a DH layer at the base of the snowpack of at least 5 cm thick at all sites except at sites 2 and 4 where it was only 1 and 4 cm thick, respectively. On average, basal DH thickness was higher in humid sites (19.1 ± 3.9 cm) than that in dry sites (13.4 ± 8.1 cm), giving a DH thickness-to-total snow height fraction (DHfraction) of 0.57 ± 0.19 and 0.38 ± 0.25, respectively (Fig. 5a).

Fig. 5. (a) Boxplots of the depth hoar fraction (DHfraction) measured in snow pits excavated at Ward Hunt Island (WH-SP) and Resolute Bay (RB-SP) in humid and dry sites, and measured along the trench dug in site 1 at Ward Hunt Island (WH-T). The red line is the median, the black cross is the mean, the blue box delineates the interquartile range and whiskers extend to the highest and lowest values. (b) Histograms showing the relative contribution (%) of the main encountered snow grain types in both humid and dry sites.
This difference is, however, not statistically significant at the 95% level according to an unpaired t-test (p = 0.129) which is likely due to the large std dev. in dry sites. The variability of the DH thickness along the trench WH-T that crossed the central tread of a solifluction lobe supporting a humid zone is illustrated in Figure 6. We observed that the DH layer was laterally continuous but was the thinnest (~5 cm) on the lateral ridge of the solifluction lobe that delimits the humid zone from the adjacent dry zone. Humid zones had a higher DHfraction (0.66 ± 0.07) than dry surfaces composed of coarse gravels (0.52 ± 0.06) (Fig. 5a; difference significant at 95% level, p < 0.0001). Measurements conducted on the 16 snow pits at RB showed results similar to those of WHI (Fig. 5a). The DHfraction was 0.45 ± 0.22 in humid zones and 0.28 ± 0.16 in dry zones (difference significant at 95% level, p = 0.04).

Fig. 6. (a) Schematic representation of the DH layer and soil surface observed along the trench WH-T that crossed a solifluction lobe in site 1 at Ward Hunt Island in early June 2019. (b) High-resolution UAV orthomosaic showing the soil surface at the trench location on 16 July 2019. (c) Spatial evolution of the DHfraction along the trench.
Regarding the proportion of snow grain types observed in snow pits made at WHI, a clear difference between humid and dry sites was found (Fig. 5b). In humid sites, DH crystals were dominant since they represent ~55% of the observed snow type. Conversely, faceted crystals dominated (38%) in dry sites, followed by DH (35%). Measurements of snow grain size demonstrated that DH crystals tend to be coarser (~4 mm) on humid sites than those on dry sites (~2.4 mm).
4.2.2 Snow physical properties
The vertical profiles of density, SSA and thermal conductivity measured in snow pits made at WHI and RB in 2019 are presented in Figure 7 and the average values of DH properties for each site are presented in Figure 8. At WHI, the density of the lowest 15 cm in snow pits, where the proportion of DH is variable, ranged from 200 to 400 kg m–3 in dry sites. The variability was smaller in humid sites with values varying between 250 and 300 kg m–3. On average, the density of DH layers found at the bottom of the snowpack was significantly lower in humid sites (237 ± 10 kg m−3) than that in dry sites (310 ± 69 kg m–3) (difference significant at 95% level, p = 0.007; Fig. 8a). At RB, the average density of the DH layers also showed a clear difference between both environments, being 231 ± 16 kg m–3 for humid zones and 255 ± 16 kg m–3 for dry zones (difference significant at 95% level, p = 0.0021).

Fig. 7. Vertical profiles of density, SSA and thermal conductivity for snow pits dug in dry and humid zones at Ward Hunt Island and Resolute Bay (only density) in early June 2019. The high-thermal conductivity values of WH_2#1 (0.55 W m−1 K−1) and WH_3#1 (0.38 W m−1 K−1) are due to the presence of a dense melt–freeze layer. The site RB_3 at Resolute Bay does not appear because only one density measurement was done.

Fig. 8. (a) Boxplot of basal DH density (ρ s) values in humid and dry zones at Ward Hunt Island and Resolute Bay and (b) the same as (a) but for the thermal conductivity (K eff) and only for WHI.
The thermal conductivity of basal layers in snow pits at WHI also showed lower variability in humid sites, where it varied between 0.04 and 0.07 W m−1 K−1, than in dry sites, where it varied between 0.03 and 0.17 W m−1 K−1. The average conductivity of DH in humid areas was 0.05 ± 0.02 W m−1 K−1 in dry areas was 0.07 ± 0.03 W m−1 K−1 (difference not significant at the 95% level, p = 0.08; Fig. 8b). Finally, SSA values were similar between the two environments with values close to 11 m2 kg−1. The one high SSA value, close to 80 m2 kg−1 for surface snow on 4 June 2019 on a humid zone, reflects a measurement carried out shortly after a snowfall.
4.3 Monitoring data
4.3.1 Snow season 2018/19 at Ward Hunt Island
Figure 9 presents the time series of snow height and wind data as well as the temperature gradient in the snowpack for the snow season 2018/19. The snowpack was established permanently on the ground at the SILA site on 24 August following a major storm (Fig. 9a and Fig. S3). This early snowfall deposited 30 cm of snow at temperatures very close to the melting point. The surface conditions before and after this event are shown in photos (e) and (f) in Figure 9 at SILA and in photos (a) and (b) in Figure S4 at site 1. The snowpack was continuous at both sites and no signs of snowdrift were visible although the snowfall was associated with strong wind episodes in excess of 10 m s−1. The 4 weeks following the snow onset were relatively calm with little wind which kept the snow height very stable. Windier conditions then occurred and strongly reworked and sculpted the snow surface as shown in Figures 9g, h taken on 21 September and 22 October, respectively, where ripple marks, barchans and sastrugi are clearly visible (Figs S4c and d). The strongest winds of the winter were recorded at the end of September with a peak at 22 m s−1. Five strong wind episodes (>15 m s−1) were recorded from the snow onset to 1 December and a total of 22 throughout the entire snow season 2018/19 (Fig. 9b).

Fig. 9. Environmental monitoring at the SILA station on Ward Hunt Island during the snow season 2018/19. (a) Snow height measurements by the snow gage and normalized with the readings of the snow stakes visible on the time-lapse photos. (b) Hourly maximum wind speed according to their direction (north/east/south/west) and averaged daily maximum wind speed. (c) Hourly temperature records at the soil surface (0 cm) and of the air. (d) Hourly temperature gradient in the snowpack calculated using Eqn (1). Photographs on the right side were taken by the automatic time-lapse camera of the SILA tower, showing the snow surface evolution in the early cold season. Their dates are represented by red crosses in graph of (a): (e) 22 August; (f) 1 September; (g) 21 September and (h) 22 October. A close-up of the 5 weeks after snow onset is presented in Fig. S3.
Episodes of snowdrifts raised temporarily the snow height up to 45 cm but the high winds generally eroded this new snow within hours or days after its deposition, always reducing the thickness to ~35 cm at the SILA station. This value is well representative of the average snow height measured by UAV over site 1 (34.5 ± 14.8 cm) and those measured at the snow pits (33.7 ± 10.9 cm) at the end of snow season 2018/19. After the snow onset, the air temperature remained close to 0°C until 1 September, fluctuating between +2 and −3°C. After this date, the first cold spells arrived (Fig. 9c and Fig. S3b). After 11 October, the air temperature dropped durably below −10°C and reached −30°C on 27 October. The temperature reached to −40°C for the first time on 2 December.
The soil surface temperature dropped below 0°C after the snow onset on 24 August and gradually decreased without being affected by short-term fluctuations in air temperatures due to the low-thermal conductivity of the snowpack (Fig. 9c and Fig. S3b). The cooling was quite rapid in September as the soil surface reached −8°C on the 24th. During that period, the temperature gradient in the snowpack thus remained weak, generally <20 K m−1 except between 15 and 20 September when a cold spell produced gradients up to 40 K m−1 (Fig. 9d and Fig. S3c). Subsequently, the soil cooling slowed down from early October while the air temperature continued to drop (Fig. 9d and Fig. S3b). It resulted in the establishment of a moderate to strong temperature gradient during much of the snow season. The strongest gradient occurred on 2 December with values up to 82 K m−1 (Fig. 9d).
The spatial variability of the soil moisture between dry and humid sites at WHI during the snow season 2018/19 is presented in Figure 10. Figure 10a shows the difference in near-surface soil moisture (−5 cm) between the SILA and Site 5. At SILA, as expected, the soil moisture was very low, varying from 0.15 to 0.05 m3 m−3 at the beginning of the winter period. Conversely, at humid site 5, the moisture varied from 0.6 m3 m−3 in the water track to 0.4 m3 m−3 in the intertrack before freeze-up.

Fig. 10. Spatial variability of the moisture and temperature conditions at Ward Hunt Island during the 2018/19 snow season. (a and b) Time series of near-surface (−5 cm) VWC (m3 m−3) and temperature at the SILA site and site 5 in intertrack (IT), water track (WT) and upper thermistor of the borehole. (c) Time series of average near-surface temperature (−5 cm) recorded by Trix-8 sensors in humid zones and dry zones in site 1. The shaded bands delimit the maximum and minimum values. (d) Average calculated temperature gradient (daily and monthly averages) based on (1) between sensors in humid and dry monitoring sites (site 1; site 5 and SILA site) during the snow season 2018/19.
This difference in soil moisture had direct consequences on the surface thermal regime during the early snow season, as demonstrated by near-surface temperature evolution recorded at SILA and site 5 (Figs 10a, b) and by the sensors installed in site 1 (Fig. 10c). A summary of thermal conditions between dry and humid monitoring sites (site 1; site 5 and SILA site) is given in Table S2. On average, the zero curtain period lasted 27.1 ± 4.9 d in humid sites, starting on 23 August with the onset of the snow on the ground which coincided with the beginning of freeze-up, while it was only 7.8 ± 2.9 d in the dry areas. As a result, the temperature difference between the near-surface and the air temperatures as well as the temperature gradient through the snowpack during the first month after the snow onset were much greater in humid sites (6.6 ± 0.1°C, 21.4 ± 0.7 K m−1 on average) than that in dry sites (2.2 ± 0.8°C, 6.6 ± 3.4 K m−1 on average). At the scale of the snow season (Fig. 10d), the difference in the temperature gradient remained significant until April, when the temperature gradient became negative because of atmospheric spring warming.
4.3.2 Winter 2018–19 at Resolute Bay
The time series of snow height, wind data and the air temperature for winter 2018–19 are shown in Figure S5. Unfortunately, the temperature gradient could not be calculated because no soil surface temperature data were available. Continuous snow cover started on 7 September and reached 20 cm at the beginning of October after several events of accumulation and erosion. The snow height was stable until the beginning of December when a new wind event occurred and quickly eroded most of the new snow accumulations. During the rest of the winter, the snow height remained close to 20 cm at the snow gage. The average snow height measured at snow pits at RB was 31.3 ± 7.9 cm. The air temperature decreased gradually at the beginning of winter to reach −20°C on 25 October 25. As at WH, high winds were recurrent with six episodes of wind above 15 m s−1 recorded from the snow onset to 1 December.
5. Discussion
5.1 Mechanism of depth hoar formation
A pioneering study by Yosida (Reference Yosida1955) established that DH is formed by water vapor diffusion induced by a temperature gradient in the snowpack. They hypothesized that water vapor transfers from one snow crystal to another, in a 'hand-to-hand’ delivery mechanism. This and subsequent studies (e.g. Marbouty, Reference Marbouty1980) proposed that diffusive vapor fluxes (F) at the macroscale could be calculated from Eqn (2):

where D eff is the effective diffusion coefficient for water vapor in the snow. The minimum temperature gradient required to induce DH formation was proposed from experiments to be 20 K m−1 (Marbouty, Reference Marbouty1980) and also required low to moderate-density snow (<350 kg m‒3). However, field investigations as early as 1972 (Trabant and Benson, Reference Trabant and Benson1972; Benson and Trabant, Reference Benson and Trabant1973) pointed out that the high rates of metamorphism observed in the subarctic snowpack cannot be explained solely by diffusion. They proposed that strong temperature gradients also initiate convective processes, leading to efficient transfers of heat and vapor through the snow porosity. The convection in the subarctic snowpack was later confirmed in dedicated studies by Sturm and Johnson (Reference Sturm and Johnson1991) and Sturm and Benson (Reference Sturm and Benson1997) who estimated that layer-to-layer vapor fluxes by air movements in the pore spaces were ten times higher than by water vapor diffusion. The ability of the snow to allow the air the circulate through it, defined as permeability (noted K), is therefore a critical parameter in the activation of convection. The snow permeability depends on the snow density and the SSA as expressed by Eqn (3) (Calonne and others, Reference Calonne2012):

where r es is the equivalent sphere radius given by Eqn (4) and ρs is the snow density:

where SSA is the specific surface area of snow (Legagneux and others, Reference Legagneux, Cabanes and Domine2002) and ρ i is the ice density. The studies of Sturm and Johnson (Reference Sturm and Johnson1991) and Sturm and Benson (Reference Sturm and Benson1997) were performed in the subarctic snowpack in the boreal forest where the wind is weak, leading to the accumulation of uncompacted snow with a density typically ~200 kg m−3 (Sturm and others, Reference Sturm, Holmgren and Liston1995; Domine and others, Reference Domine2008). Such snow has a high permeability ranging from 50 to 100 × 10−10 m2 (Domine and others, Reference Domine, Morin, Brun, Lafaysse and Carmagnola2013) which facilitates the development of convection through the pore spaces. This enhances DH growth that further decreases the density and increases permeability. DH growth thus results in important positive feedback between the permeability and the magnitude of vapor transfers. In an advanced stage of metamorphism, a well-developed DH layer can feature permeability as high as 650 × 10−10 m2 (Domine and others, Reference Domine, Morin, Brun, Lafaysse and Carmagnola2013).
A key question is whether convection processes can be active in the polar desert snowpack, where frequent strong wind episodes often remobilize the snow and compact it into hard wind slabs of very high density, typically ranging from 350 to 500 kg m−3 (Domine and others, Reference Domine, Cabanes and Legagneux2002, Reference Domine, Gallet, Bock and Morin2012, Reference Domine2018b). Investigations in the Arctic tundra snowpack observed that hard DH (‘indurated’) can form in some basal wind slabs (Derksen and others, Reference Derksen2009; Domine and others, Reference Domine, Gallet, Bock and Morin2012) subjected to elevated temperature gradients in the fall. This suggests that layers of moderate permeability may be subject to convection. Other layers in Arctic snow never transform into DH and alternations between DH and wind slabs have been observed in Arctic snowpacks (Domine and others, Reference Domine, Cabanes and Legagneux2002; Sturm and Benson, Reference Sturm and Benson2004), suggesting that there may be a permeability threshold below which convection cannot be initiated (Domine and others, Reference Domine2018b). At present, the value of this threshold, which probably depends on the value of the temperature gradient, has not been established.
In light of these previous studies, we will interpret our observations for the polar desert snow within the simplified framework that DH formation requires a temperature gradient in the snowpack higher than 20 K m−1 and a sufficiently high snow permeability to allow convection.
5.2 Characteristics of the snow season 2018/19
At WHI, fall 2018 was characterized by a snowpack that formed very early in the season and remained stable throughout winter 2018/19. The massive snowfall on 24 August brought ~80% of the late-winter snow height recorded at the SILA site (Fig. 9). This snowfall occurred under mild conditions producing wet and sticky snow, perhaps even with some melting, which was less affected by the strong winds. Thus, the redistribution processes were reduced, as demonstrated by the homogeneous snowpack and its little-reworked surface (Fig. 9f and Fig. S4b), and the snow likely accumulated with a density <300–350 kg m–3 since wind-induced sintering and compaction were limited. If we assume a snow SSA of at least 30 m2 kg−1 for recent wet snow (Legagneux and others, Reference Legagneux, Cabanes and Domine2002), the permeability of this snow was then likely higher than 40–70 × 10−10 m2 according to Eqn (3). The 3 weeks following snow onset were characterized by calm weather with few cold spells which allowed the snowpack to sinter and thus stabilize durably. For all these reasons, the first snow of the season 2018/19 resembled more alpine snow than polar snow (Royer and others, Reference Royer2021). The snow dynamic in fall 2018 was therefore completely different from that observed in fall 2015 during which the snowpack remained discontinuous until November due to extreme wind conditions (Domine and others, Reference Domine2018b). In RB, the snow onset in fall 2018 occurred 2 weeks later than in WHI, but the snowpack also quickly became stable at the snow gage site, reaching 90% of its late winter height at the end of September (Fig. S5a).
The onset of a stable snowpack is known to be a critical factor for the soil surface thermal regime (Ling and Zhang, Reference Ling and Zhang2003), and hence for the temperature gradient into the snowpack. An early snow onset, as it occurred at WHI and RB in the fall of 2018, prevents rapid cooling of the soil because it is partially disconnected from atmospheric conditions (Ishikawa, Reference Ishikawa2003; Davesne and others, Reference Davesne, Fortier, Domine and Gray2017). However, data from WHI show that the soil surface temperature cooled quite rapidly despite the presence of the snowpack (Figs 9a, c and Figs S3a, b). We explain this by rapid upward freezing and cooling of the shallow active layer by the low temperature of the permafrost (~−13°C) (Woo and others, Reference Woo, Arain, Mollinga and Yi2004). Paquette and others (Reference Paquette, Fortier, Lafrenière and Vincent2020a, Reference Paquette, Fortier and Lamoureuxb) suggested such a process to explain the ground ice aggradation in the active layer during freeze-back at RB. This phenomenon, combined with the fact that the air temperature remained ~0°C until early September, resulted in a weak temperature gradient in the snowpack for over a week. Subsequently, cold spells produced temperature gradients quite variable in magnitude, but which exceeded 20 K m−1 for 9 d in September, 8 d in October and 25 d in November, and even reached 82 K m−1 on 2 December (Fig. 9d and Fig. S3c). These periods with elevated gradients combined with the high permeability of the snow were conducive to the development of strong upward vapor fluxes by diffusion and convection mechanisms. It thus resulted in the transformation of at least part of the snowpack established on 24 August into a continuous DH layer. Elevated temperature gradients persisted until 23 April which was the last occurrence of gradient >20 K m−1, so that DH could keep developing in the basal layer during most of the snow season. Furthermore, the temperature gradient shown in Figure 9d and Fig. S3c is the average gradient in the whole snowpack. Given that the thermal conductivity of the lower layer, made of DH, is in general lower than that in layers above, the gradient was in fact greater in this lower layer, further favoring DH development there.
The presence of a DH layer in all snow pits dug in spring 2019, both at WHI and RB, indicates that favorable conditions for DH development as observed at the SILA station were widespread and allowed DH formation everywhere. However, some spatial variabilities in the height and physical properties of DH were observed (Figs 5, 7).
5.3 Small-scale variability of depth hoar
A comparison of the stratigraphy and snow properties between humid and dry areas in the polar desert of WHI and RB revealed noteworthy differences in the thermo-physical properties and thickness of DH layers. The greatest difference is in DH density and visual grain size (Figs 7, 8). Both these variables are of particular interest because they are indicative of the history of snow metamorphism throughout the winter. Our measurements demonstrated that humid sites exhibited significantly lower DH density values than dry sites both at WHI and RB. At WHI, the thermal conductivity measurements also tended to be lower in humid sites than that in dry sites. This result was expected considering the strong dependency of thermal conductivity on snow density (Sturm and others, Reference Sturm, Holmgren, König and Morris1997; Domine and others, Reference Domine, Bock, Morin and Giraud2011). The SSA, in contrast, exhibited similar values between both environments, showing that it was not affected by variables such as soil moisture. This is consistent with the finding of Taillandier and others (Reference Taillandier, Domine, Simpson, Sturm and Douglas2007) and Domine and others (Reference Domine, Barrere and Sarrazin2016b) who observed that the SSA of DH typically stops decreasing when it reaches ~10 m2 kg−1, and is uncorrelated with visual grain size, as SSA does not decrease when DH crystals keep growing.
The lower density and larger visual grain size found in humid zones is a consequence of the thermodynamic effects of the soil moisture (details are given in Section 5.4) and subsequent positive feedback mechanisms in which kinetic metamorphism is enhanced over humid zones. Indeed, the formation of DH leads to a decrease in density and thermal conductivity, thereby increasing the insulation effect of the snow and the temperature gradient through it (Zhang and others, Reference Zhang, Osterkamp and Stamnes1996). This triggers greater water vapor fluxes by diffusion and hence greater mass transfer from the basal to the top layers. Furthermore, the DH layer has a greater permeability that further enhances the vapor flux by convection and amplifies the feedback, greatly favoring DH development in humid zones. The snowpack in humid zones and the one in dry areas therefore have a different history of metamorphism, initially determined in part by soil moisture. At the scale of the snow season, this leads to significant small-scale variability in the snow properties, which reflects the mosaic of microenvironments that partitions the polar desert landscape (Woo and Young, Reference Woo and Young2003).
5.4 Factors controlling depth hoar spatial variability in 2018/19
The spatial variability in DH height and its physical properties in a polar desert context can be attributed to two main variables: microtopography and soil moisture.
5.4.1 Effect of the microtopography
The geomorphology of polar deserts consists of a complex assemblage of landforms, such as solifluction lobes, patterned ground, raised beach ridges and nivation hollows (Fig. 4; Woo and Young, Reference Woo and Young2003; Vincent and others, Reference Vincent2011; Verpaelst and others, Reference Verpaelst, Fortier, Kanevskiy, Paquette and Shur2017; Paquette and others, Reference Paquette, Fortier, Lafrenière and Vincent2020a, Reference Paquette, Fortier and Lamoureuxb). The snow redistribution by the wind is in part a function of the surface roughness created by this microtopography. The spatial pattern of the first snow accumulation at the beginning of the season is particularly important since it will later constitute the basal layers of the snowpack that may transform into DH. In typical years, in the polar desert where snowdrift and wind erosion events are frequent, the areas sheltered from the wind (e.g. depression and leeward side of obstacles) are logically those where the snowpack builds up more quickly in the early season and where the snow is deepest and has the lowest density and highest permeability. Consequently, these areas are most likely to form a thick layer of well-developed DH. Inversely, on topographic highs, the snowpack remained thin and discontinuous, and the snow has a shorter residence time (Fig. 4) (Sturm and Benson, Reference Sturm and Benson2004). DH is therefore less likely to develop there (Fig. 6). The fall 2018 was however atypical because the homogeneous and stable snowpack that formed on 24 August 2018 (Fig. 9f and Fig. S4b) allowed the development of a continuous layer of DH subjected to a lower influence of the microtopography. Although the observations from the trench WH-T show a certain tendency for the DH layer to be thinner on the ridges, the effect of microtopography is not detectable through the relationship between the end-of-season snow height and the DH thickness at the snow pits as shown in Figure S6. This strengthens our suggestion that microtopography had a minimal effect on DH development in fall 2018 because conditions were more alpine-like than polar desert-like. Later in the snow season, however, multiple episodes of snowdrift and erosion redistributed subsequent snowfalls, explaining the high-spatial heterogeneity of the late-winter snowpack (Fig. 4). Figure 4a therefore may be a representative example of the interaction between wind, microtopography and snow height under ‘normal’ polar desert conditions with a strong wind effect, despite the atypical fall conditions. This clear relationship between the microtopography and snow height is well illustrated in Figure 4e. During most years, this correlation between topography and snow height is visible in fall, and an example of normal snow conditions for the polar desert is shown in Figure S4e taken on 2 October 2017, where eroded highs and lows with accumulation are clearly visible.
5.4.2 Effects of soil moisture and temperature
In polar deserts, soil moisture mainly depends on the geomorphological context which controls the spatial distribution of water sources on slopes, as well as how this water is transferred and where it accumulates in the system of catchments (Woo and Young, Reference Woo and Young2003; Langford and others, Reference Langford, Gooseff and Lampkin2015; Paquette and others, Reference Paquette, Fortier, Lafrenière and Vincent2020a, Reference Paquette, Fortier and Lamoureuxb). Dry, well-drained soils largely dominate in polar deserts, but locally, humid zones can develop, giving rise to great heterogeneity in moisture conditions at the landscape scale (e.g. site 1, Fig. 1). At WHI as at RB, most humid zones lie downslope from semi-permanent and perennial ice patches, whose melting ensures a steady supply of meltwater to the slopes throughout most of the summer (Woo and Young, Reference Woo and Young2003; Paquette and others, Reference Paquette, Fortier, Lafrenière and Vincent2020a, Reference Paquette, Fortier and Lamoureuxb). Multiple years of hydrological studies at WHI have revealed a high degree of consistency in the spatial and temporal dynamics of surface and subsurface water transfers and annual humid zone development, although minor variations may occur from year to year due to micrometeorological conditions (Paquette and others, Reference Paquette, Fortier and Vincent2018). In the context of climate change, however, the decline of perennial ice patches threatens the sustainability of many humid areas in polar deserts. At RB, most of the perennial ice patches have already turned into semi-permanent over the past decade leading to greater interannual variability in soil moisture (Woo and Young, Reference Woo and Young2014). With the projected continuation of temperature warming, we can expect a rapid transition from ice patches to seasonal snow patches across the polar desert, resulting in frequent drying of humid soils before the end of the summer.
The soil moisture can influence DH formation in different ways. First, the water content of a soil modulates the rapidity at which it will freeze and cool down in the fall. Given the latent heat of freezing of water, humid areas required more time to freeze-back than drier areas. As shown in Figure 10, the longer zero curtain period in the humid sites implied that soil cooling below 0°C was delayed, which ensured that the temperature gradient between the soil at 0°C and the cold atmosphere was greater than at dry sites where the soil rapidly dropped below 0°C. Also, the zero curtain effect maintains the basal layers of the snowpack at temperatures close to 0°C in humid zones, which means a higher vapor concentration in the pore spaces and hence higher vapor fluxes. This confirms the hypothesis proposed by Domine and others (Reference Domine2018b) concerning the effect of soil moisture on vapor gradients and DH growth in the polar desert snowpack. Second, the temperature gradient between the soil and the basal layers of the snowpack can also lead to mass transfer from the soil to the snow. This process is difficult to quantify but some studies, such as Woo (Reference Woo1982), Smith and Burn (Reference Smith and Burn1987), Sturm and Benson (Reference Sturm and Benson1997) and Domine and others (Reference Domine, Barrere and Sarrazin2016b) have demonstrated that the upward vapor fluxes by both diffusion and convection from humid soil enhance the development of DH at the bottom of the Arctic snowpack. However, Woo (Reference Woo1982) suggests that this process is likely less effective in polar desert environments than in tundra areas because of the soil coldness.
In summary, the unusually windless conditions at the beginning of the 2018/19 snow season produced a snow layer of fairly constant thickness over the whole landscape, making that year an ideal one to capture the role of soil moisture without being distorted by the effect of microtopography. We were thus able to clearly identify the soil moisture effects on DH height, density and grain size. Under normal conditions, wind erodes topographic highs (usually drier) and accumulates snow in topographic lows (usually more humid), so that microtopography has an additional effect on the DH development and height. This would make observations dependent on two factors, moisture and snow height, making the role of moisture more difficult to discern.
5.5 The inter-annual variability in the depth hoar development
Comparison of the 2018/19 snow season at WH with the 2015/16 and 2016/17 seasons presented in Domine and others (Reference Domine2018b) highlights the strong inter-annual variability in the development of DH in the polar desert. The snow conditions in 2015/16 were drastically different than those in 2018/19 because DH was near-absent at most sites, including humid areas. Less information is available for 2016/17 but Domine and others (Reference Domine2018b) deduced from the monitoring of snow thermal conductivity, temperature and meteorological variables that a well-developed DH layer was present at the SILA site, meaning that snow conditions were closer to those of 2018/19.
The detailed analysis of the meteorological dataset recorded by the SILA station allows identifying the wind conditions as the main variable that strongly varied from one year to another. The wind frequency with speed above 6 m s−1 – a reasonable threshold for snowdrift (Sturm and others, Reference Sturm, Liston, Benson and Holmgren2001; Royer and others, Reference Royer2021) – during the 60 d after snow onset (Fig. 11a) demonstrated the largest differences between the 3 years concern the strongest winds (>10 m s−1). The calculation of the wind index (WI) for the winds above 6 m s−1 (the sum of speed values of hourly winds >6 m s−1; Sturm and others, Reference Sturm, Liston, Benson and Holmgren2001) clearly shows that the windier conditions occurred in 2015/16, especially within the 30 d after the snow onset since the WI (3100) was twice as high as in 2016/17 and 2018/19 (1500) (Fig. 11b). The frequent strong wind events associated with few calm periods (<6 m s−1), such as in 2015/16, generated two combined effects.
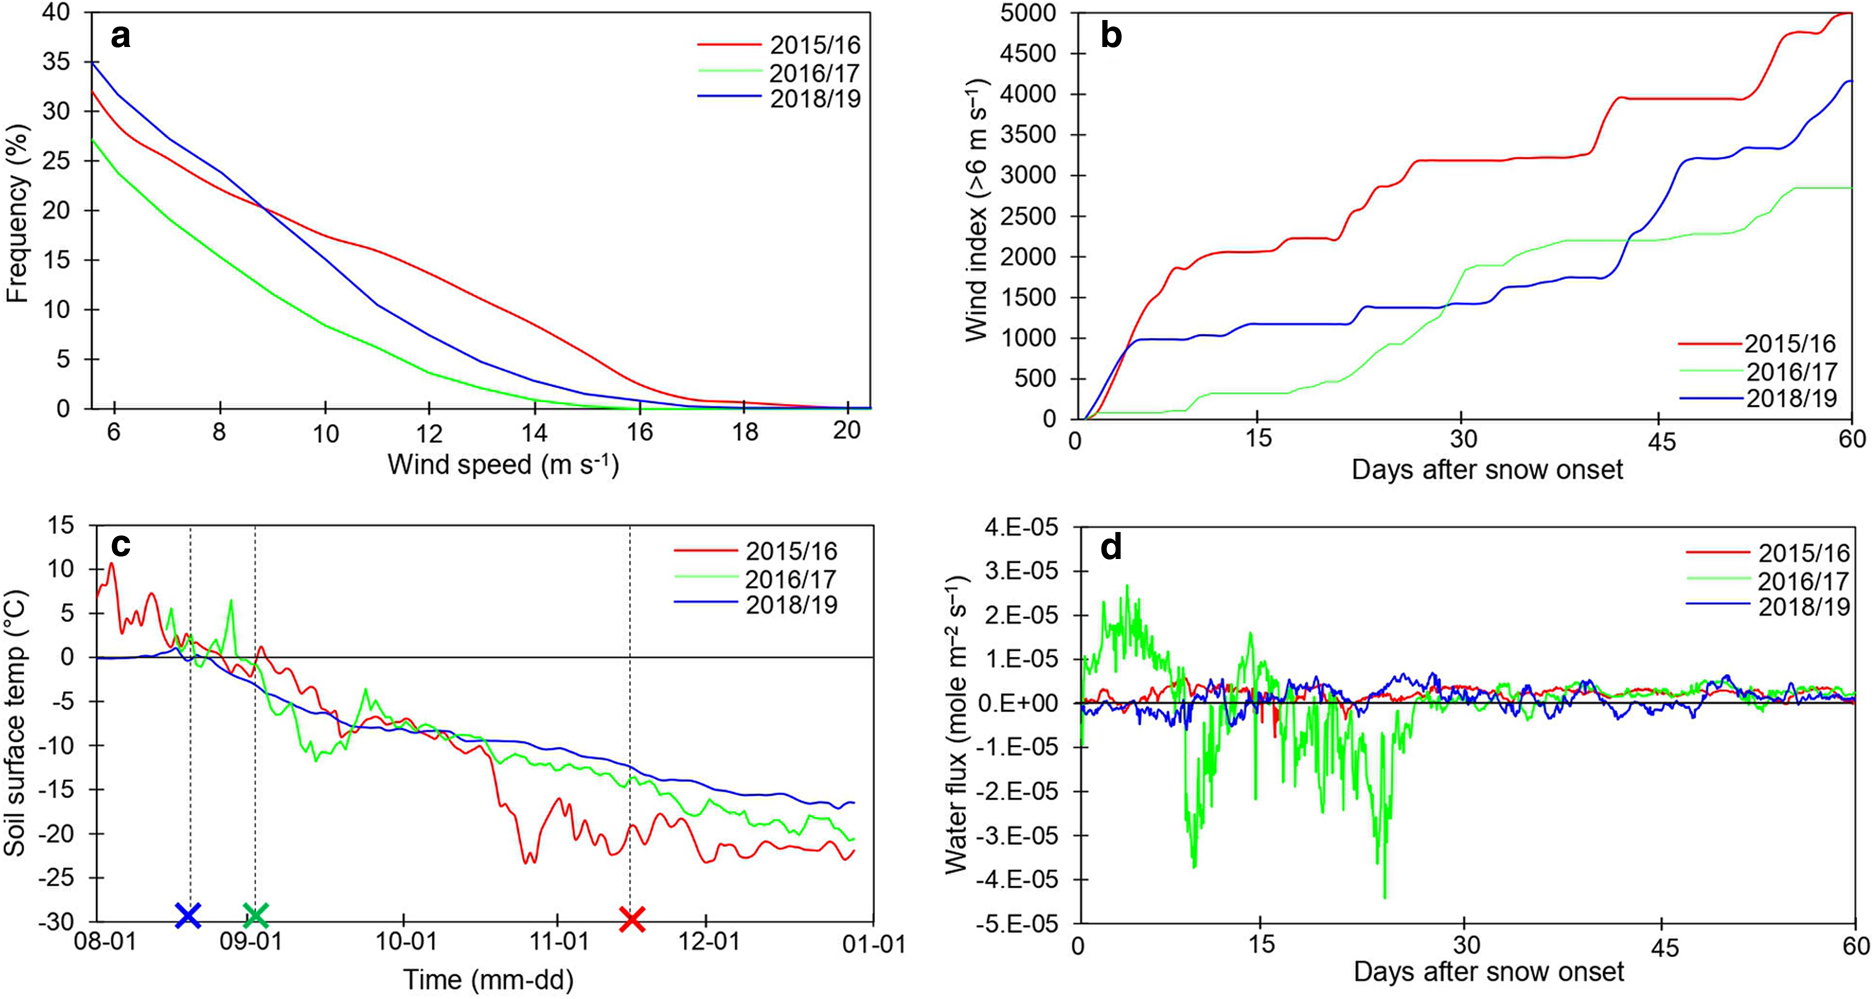
Fig. 11. Comparison between thermal and wind conditions at the SILA station on Ward Hunt Island between falls 2015, 2016 and 2018. (a) Wind speed distribution of hourly maximum above 6 m s−1 for 60 d after the snow onset. (b) Wind Index (WI) for wind speed over 6 m s−1 for the 60 d following the snow onset. (c) Soil surface temperature for the August–December period, the crosses marked the snow onset date for each date. (d) Diffusive water vapor fluxes through the snowpack calculated from Eqn (2) for the 60 d following the snow onset.
First, it resulted in the development of very hard dense wind slabs with high-thermal conductivity and low permeability. Dense wind slabs formed under conditions as windy as in 2015 produce snow with a density typically exceeding 400 kg m−3 and have SSAs of at least 30 m2 kg−1 (Domine and others, Reference Domine, Gallet, Bock and Morin2012, Reference Domine2018b). This gives a permeability of ~20 × 10−10 m2 according to Eqn (3), suggesting that the snow permeability in fall 2015 likely was too low to allow convection (Domine and others, Reference Domine, Morin, Brun, Lafaysse and Carmagnola2013). On the contrary, periods of calm weather in falls 2016 and 2018 resulted in snow with lower density and hence higher permeability.
Second, the multiple episodes of erosion/accumulation under wind action led to a regular renewal of the shallow snowpack, including basal layers. During severe windstorms, the snow is swept away from most of the surface (Fig. S4e). Due to this short residence time, the snow has no time to undergo advanced metamorphism. Furthermore, when the first half of the snow seasons were marked by recurrent erosion events, the date of onset of a continuous snowpack occurred very late. In fall 2015, the snow onset occurred more than 70 d later than in fall 2016 and 80 d later than in fall 2018 (Domine and others, Reference Domine2018b). Consequently, the zero curtain period that marked the freeze-back period in site 5 did not affect the snowpack and the soil surface was already ~−20°C in mid-November 2015 in both dry (SILA site) and humid zones (site 5) when the snow started to accumulate (Fig. 11c and Fig. S7a). Such low soil temperature limited the temperature gradient into the snowpack. Furthermore, the snow accumulated under an air temperature between −20 and −30°C (Fig. S7a). Considering the exponential increase of water vapor pressure with temperature, the vapor pressure at −30°C was only ~50 Pa in pore space, which was eight times lower than that at −5°C (~400 Pa). Consequently, the diffusive and convective vapor fluxes in the snowpack were weak (Fig. 11d) giving rise to additional unfavorable conditions for efficient kinetic metamorphism. In fall 2016, in contrast, the earlier snow onset (5 September) allowed the soil surface and the snow to be warmer, being close to 0°C at site 5 and −5°C at SILA. It resulted in stronger vapor fluxes within 10 d after snow onset (Fig. 11d and Fig. S7b) that brought particularly favorable conditions for rapid DH growth. In fall 2018, surprisingly, diffusive vapor fluxes remained weak at the SILA site, being of the same order of magnitude as in 2015 (Fig. 11d), despite an earlier snow onset and much warmer soil and snow temperatures in the weeks following it. We attribute this to a thicker snowpack and to the fact that snow onset occurred early in fall 2018, limited the temperature difference between the soil surface and the air. In site 5, however, the long zero curtain period after the snow onset probably favored a stronger temperature gradient during the first half of September (Fig. S7c). The fact that DH was nevertheless found in dry areas such as at SILA in 2019 suggests that convection played a key role in the mechanism of water vapor transport due to the low-density and coarse-grained nature of the snow that accumulated in early snow season 2018/19 which ensured a high permeability of the snowpack.
Due to the close link between wind conditions and the degree of metamorphism in a polar desert environment, we would expect a strong interannual variability in the presence of DH that would be correlated with the yearly variations in wind climatology. The wind statistics for the first half of the winters (September/October/November) over the period 2007–19 at WHI demonstrate that wind conditions have been highly variable from one year to the next with a regular alternation between windy and calmer falls giving a sawtooth pattern to the curve. As shown in Figure S8, the WI for speeds above 6 m s−1 for September/October/November period varied from 4500 to 8500 in 2012 and 2015, respectively. This variability is similar for extreme winds above 10 m s−1. These data suggest a biannual pattern in wind conditions in which windy years alternated with calmer years. We preliminarily propose, based on these 11 years of meteorological data, that the snowpack in the polar desert of WHI is discontinuous, thin and with little or no DH every 2 years and that, conversely, it is more characteristic of the Arctic tundra snowpack in the other years. These results suggest that potential changes in wind regimes due to climate change could thus have a major impact on future snow conditions in polar deserts.
6. Conclusion
Our study provides new insights into DH development and its spatio-temporal variability at WHI, the main site, and RB, the secondary site, which are both representative of polar desert environments in terms of landscape and climate conditions. From our results, we conclude that wind is the most critical factor in the development of DH in the polar desert. When fall periods were windy and cold (e.g. 2015), the conditions prevented DH development whereas it was favored when winds were calmer and air temperature milder (e.g. 2018). Strong winds lead to alternating episodes of erosion and accumulation that form dense slabs of high density and low permeability. This snow prevents vapor transfers by convection and vapor diffusion is limited by the low temperature gradients in the snowpack, therefore reducing the possibility of transforming windslabs into DH. Calm weather during early snowfalls and in the weeks that follow or/and snow that falls under mild temperature allowed snow to accumulate and remain on the ground with a moderate density and high permeability, which favored convection processes, intense snow metamorphism and growth of well-developed DH.
Soil moisture is a second-order environmental factor that modulates snow metamorphism and DH dynamics. We demonstrated that DH development is stronger in humid soils than in dryer, better drained, soils and that DH thickness and properties change according to the periglacial landscape microtopography. The difference between humid and dry areas in the degree of metamorphism is initially induced by soil moisture which delays freeze-back of the active layer in humid areas. It therefore promotes strong temperature gradients for longer periods, leading to greater water vapor fluxes, and hence greater mass transfer from the basal to the top layers. Metamorphism in humid areas is subsequently enhanced by the structure of the snow itself (lower density, lower thermal conductivity and higher permeability) which brings an additional warming effect to the soil which positively feeds back on DH formation. This close link between soil moisture and DH formation leads to significant small-scale variability in snow properties, which reflects the mosaic of environments that structure the landscape of the polar desert. Under polar desert conditions, frequent snowdrift and erosion episodes redistribute the early snowpack according to microtopography and hence bring an additional factor of small-scale variation in DH thickness.
This study also highlighted that the conclusion drawn from our main site appears to apply as well to our secondary site, located over 1000 km away and over 8° of latitude to the south. We can therefore anticipate that our findings are transferable to other regions of the High Arctic polar desert that exhibit similar patchy humid zones whose distribution is tightly linked to the presence of long-lying and perennial snow/ice patches and where the wind is a key element of the climate. In light of this study, we propose that the high-interannual variability and the high-spatial variability in DH formation is one of the most distinctive features of the polar desert snowpack from that on Arctic tundra where DH is usually ubiquitous. Given the great importance of the presence and amounts of DH for snowpack properties, its formation in polar deserts deserves further research in additional locations to confirm the transferability of our findings to other polar desert sites. These data would help to better understand and model the effects of the seasonal snowpack on the ground thermal regime and ecosystem functioning, as well as the future evolution of polar desert snow in response to climate change.
Supplementary material
The supplementary material for this article can be found at https://doi.org/10.1017/jog.2021.105.
Acknowledgements
This research was conducted with financial support of the Natural Sciences and Engineering Research Council of Canada (NSERC), including the Discovery Frontiers project Arctic Development and Adaptation to Permafrost in Transition (ADAPT); the Networks of Centres of Excellence program ArcticNet; the Canada Research Chair program; the Northern Scientific Training Program; the Canadian Foundation for Innovation: Canadian Northern Studies Trust; Centre d'études Nordiques (CEN) and Fond de Recherche du Québec-Nature et Technologie (FRQNT). FD was supported in part by the French Polar Institute (IPEV). Logistical support was provided by the Polar Continental Shelf Program (PCSP) which also granted us the use of their facility at RB. The authors thank Parks Canada and the communities of Resolute Bay (Qausuittuq) for permission to work in the different study sites. The authors thank Karine Rioux for her field assistance and Denis Sarrazin (CEN) for the installation and maintenance of the SILA weather station. Finally, we are also grateful to the two anonymous reviewers and the editor for their insightful comments and advice on the manuscript.
Author contributions
FD and GD designed research and performed the field measurements at WH and RB. FD, GD and DF obtained funding. GD analyzed the data and wrote the paper with inputs from FD and DF.


 Open access