


Introduction
The East Antarctic Ice Sheet (EAIS) is the single largest potential contributor to future global mean sea level rise, containing the equivalent of 54 m (Morlighem and others, Reference Morlighem, Rignot and Binder2020). Despite its importance, however, individual studies of its mass balance range from + 61 ± 73 Gt a−1 (from 2008 to 2015: (Gardner and others, Reference Gardner2018) to − 51 ± 13 Gt a−1 (from 1979 to 2017: Rignot and others, Reference Rignot2019), with the latest reconciled estimate given as 5 ± 46 Gt a−1 (from 1992 to 2017: Shepherd and others, Reference Shepherd2018). Notwithstanding these uncertainties in the overall mass balance of the EAIS, some regions appear to be losing mass, particularly Wilkes Land, which sits over the Aurora Subglacial Basin (Li and others, Reference Li, Rignot, Mouginot and Scheuchl2016; Rignot and others, Reference Rignot2019; Velicogna and others, Reference Velicogna2020). Another major marine basin is the Wilkes Subglacial Basin (WSB; Fig. 1a) that contains ice equivalent to 3–4 m of global mean sea level rise equivalent (Morlighem and others, Reference Morlighem, Rignot and Binder2020). It currently appears to be in balance (Rignot and others, Reference Rignot2019), but it has been identified as having clear potential for future mass loss, primarily via Cook Glacier (Mengel and Levermann, Reference Mengel and Levermann2014; Stocker, Reference Stocker2014), which currently discharges 40.7 Gt a−1 of ice (Rignot and others, Reference Rignot2019). Indeed, Mengel and Levermann (Reference Mengel and Levermann2014) suggested that the grounded ice is currently held back by an ‘ice plug’ that, were it to be removed by future ice retreat or thinning, would accelerate the flow of grounded ice and increase Cook Glacier's contribution to future sea level rise.

Fig. 1. (a) BedMachine (Morlighem and others, Reference Morlighem, Rignot and Binder2020) bed elevation of the Wilkes Subglacial Basin, (b) Landsat-8 image of Cook West and East glaciers from February 2017, overlain with MeASUREs 2017 ice velocities (Mouginot and others, Reference Mouginot, Rignot and Scheuchl2019) and grounding line (Depoorter and others, Reference Depoorter2013), (c) time series of ice speed over the grounding line for Cook West and (d) Cook East (Miles and others, Reference Miles, Stokes and Jamieson2018).
Cook Glacier has two main branches that feed into an ice shelf (Fig. 1b) and which are referred to as Cook West and Cook East (Miles and others, Reference Miles, Stokes and Jamieson2018), with each section being responsible for approximately half the total annual ice discharge. Cook East feeds an ice shelf that stretches ~50 km from the grounding line to the calving front and has been steadily advancing at a rate of 750 m a−1 following its last major calving event in the late 1960s or early 1970s (Miles and others, Reference Miles, Stokes and Jamieson2018). In the 1940s, Cook West's ice-shelf extent was comparable in extent to Cook East (Frezzotti and others, Reference Frezzotti, Cimbelli and Ferrigno1998; Miles and others, Reference Miles, Stokes and Jamieson2018). However, Cook West underwent a major calving event during the 1970s (Miles and others, Reference Miles, Stokes and Jamieson2018) and the calving front is now located within 2–3 km of the grounding line (Fig. 1b), i.e. the ice shelf has not regrown. Over the last few decades, the region immediately inland of Cook Glacier has experienced ice surface lowering (Pritchard and others, Reference Pritchard, Arthern, Vaughan and Edwards2009; McMillan and others, Reference McMillan2014; Schröder and others, Reference Schröder2019), but the grounding-line position appears to have remained constant during the period 2010–16 (Konrad and others, Reference Konrad2018).
Recent study (Miles and others, Reference Miles, Stokes and Jamieson2018) has also shown that both Cook West and Cook East have accelerated over the last few decades (Fig. 1c, d). Following the calving event in the late 1960s or early 1970s (Miles and others, Reference Miles, Stokes and Jamieson2018), the ice speed over the grounding line at Cook West approximately doubled from 700 m a−1 in 1973 to its present-day (2021) speed of 1400 m a−1. Note that there are greater uncertainty around the 1973 observations as a result of the sparsity of available data during this time period and the coarser resolution of the imagery when compared to more recent observations The acceleration in ice speed at Cook East is less than that at Cook West, but it has increased by ~100 m a−1 (~20%) across the grounding line since the 1990s (Fig. 1d). Miles and others (Reference Miles, Stokes and Jamieson2018) hypothesised that the acceleration of Cook West was the result of a loss of buttressing following the collapse of its ice shelf in the 1970s, while the acceleration of Cook East was potentially a result of changes in ice-shelf thickness driven by enhanced ocean-induced basal melting. Our aim is to test these hypotheses using a numerical ice-flow model to simulate the effects of observed changes at the terminus of Cook Glacier on its instantaneous ice velocity. We then explore the sensitivity of both Cook West and Cook East to future scenarios for grounding-line position and ice-shelf geometry, respectively, again focusing on the instantaneous response.
Methods
Numerical ice-flow model
We conduct experiments using the finite-element, ice dynamics model Úa (Gudmundsson and others, Reference Gudmundsson, Krug, Durand, Favier and Gagliardini2012), which has previously been used to investigate, for example, rift propagation on the Brunt Ice Shelf (De Rydt and others, Reference De Rydt, Gudmundsson, Nagler, Wuite and King2018), the effect of ice-shelf thinning in Antarctica (Reese and others, Reference Reese, Gudmundsson, Levermann and Winkelmann2018) and the velocity response of Petermann Glacier to calving events (Hill and others, Reference Hill, Gudmundsson, Carr and Stokes2018). It is therefore particularly well suited to investigating the response of marine-terminating glaciers to changing ice geometry. Úa solves the shallow-shelf approximation (SSA) of ice flow (MacAyeal, Reference MacAyeal1989) using a Glen's Flow Law rheology for ice. Observational properties of ice geometry, bed elevation (Morlighem and others, Reference Morlighem, Rignot and Binder2020) and ice velocity (Mouginot and others, Reference Mouginot, Rignot and Scheuchl2019) are linearly interpolated onto the model grid. Note that the model domain has been deliberately chosen to encompass the entire ‘Rignot D-Dp’ drainage basin from the IMBIE project (http://imbie.org/imbie-2016/drainage-basins/) containing Cook Glacier. Note that, to aid model computation, ice velocities on model nodes along the grounded ice boundary have been set to zero, differing only slightly from their zero or near zero observed values. This model domain encompassing the WSB is shown in Figure 2a. Mesh resolution varies from 15 km inland to 0.25–1 km in the high resolution area (shown in red in Fig. 2a) near the floating ice shelf and grounding line of Cook Glacier. To maintain exactly the same nodal positions for each ice-shelf configuration we do not regenerate the mesh between runs but instead deactivate floating nodes that fall beyond the calving-front extent. This is achieved by seeding the mesh with the position of the calving-front extents in 1973 (furthest observed extent of Cook West before its most recent calving event), 1989 (smallest extent of Cook East after its most recent calving event) and 2017 (the most recent position of the Cook calving front used in this study). When generating the model mesh, we effectively define an internal boundary for the mesh using nodal positions from observed points along the historical boundaries. This guarantees the placement of these nodes along the past calving fronts regardless of the specified mesh resolution in the surrounding area. Note that this ‘internal boundary’ does not in any way effect the ice velocity or have any characteristics within the model simulation, it is simply a means to force finite-element nodes to be located in certain fixed positions. The result is that, as ice-shelf terminus change is applied, the exact geometry of these observed ice fronts will be reproduced within the numerical ice model. The relative positions of these calving fronts, in addition to a schematic representation of the model mesh, are shown in Figure 2b.

Fig. 2. (a) Model domain (black outline), with a model resolution of 15 km for the majority of the domain, with a higher resolution of 0.25–1 km section (shown in red) encompassing Cook Glacier. (b) Grounding line (magenta), 2017 (red), 1989 (green) and 1973 (blue) calving-front positions for the Cook Ice Shelf which are included as predefined boundaries within the model mesh (note that as the mesh is too fine for illustrative purposes we show a coarser version here). (c) L curve used to determine the optimum value of the Tikhonov regularisation multiplier (red) that minimises misfit for the n = 3, m = 3 case. (d) The effect of varying stress factor, n, and sliding law exponent, m, on Cook grounding-line flux when the calving front is set to the positions shown in (b). n and m are varied independently of each other, with m = 3 while varying n and n = 3 while varying m.
Our methodology can be broken down into two steps. The first step is to use present-day observations of ice velocity and geometry to invert for bed and ice properties for the model domain. The second step is to use these properties while perturbing aspects of ice geometry (namely, extent, ice-shelf thickness and grounding-line position) to quantify their effect upon modelled ice-flow velocity. This methodology is the same as that used by Miles and others (Reference Miles2021) to investigate the recent acceleration of Denman Glacier by perturbing ice-shelf geometry and grounding line-position and Gudmundsson and others (Reference Gudmundsson, Paolo, Adusumilli and Fricker2019) to investigate the instantaneous response of Antarctic ice velocity to ice-shelf thinning. We justify the use of diagnostic, non-transient simulations here over forward transient simulations because the past observational record of Cook Glacier is both temporally and spatially incomplete. As such our perturbation experiments are not trying to match a smooth, continuous series of observations but rather individual snap-shots of past conditions. This allows us to isolate the glacier response to known perturbations at the terminus and test hypotheses regarding the drivers of recent changes. Similarly, our simulations of future conditions are not intended to provide exact quantitative predictions of future events but instead to highlight the sensitivity of Cook Glacier to imposed future changes in ice geometry.
Úa (Gudmundsson and others, Reference Gudmundsson, Krug, Durand, Favier and Gagliardini2012) is used to solve the equations of the shallow-ice stream or ‘shelfy-stream’ approximation (SSA, Cuffey and Paterson, Reference Cuffey and Paterson2010). This can be expressed for one horizontal dimension as:
where A is the ice-rate factor with its corresponding stress factor n, h is the ice thickness, G is a grounding/flotation mask (1 for grounded ice, 0 for floating ice), C is the basal slipperiness with its corresponding stress exponent, m, ρ is the density of ice, g is the acceleration due to gravity and s is the vertical position of the ice surface. Although the momentum equation above is shown in one horizontal dimension only, the ice-flow model solves for the 3-D SSA stress field. Further details of the Úa ice model can be found in Gudmundsson and others (Reference Gudmundsson, Krug, Durand, Favier and Gagliardini2012). In accordance with the BedMachine dataset (Morlighem and others, Reference Morlighem, Rignot and Binder2020) we have assumed a constant ice density of 917 kg m−3.
Model inversion
As direct observations of the basal slipperiness, C, and ice-rate factor, A, are extremely limited and difficult to obtain we are forced to rely on indirect estimates, in this case via numerically inverting surface velocity measurements to obtain the corresponding values of A and C. As past observations of ice velocity and geometry are spatially and temporally limited, we are forced to assume that basal slipperiness and the ice-rate factor remain constant through time. This is not a problem unique to our model setup: it is inherent when using numerical ice modelling to simulate past or future time periods which lack observational records. We acknowledge changes in basal slipperiness or ice rheology could cause an acceleration in ice velocity. In the particular case of our modelling framework, however, we would argue that if changes in ice geometry are not sufficient to explain past observations, then changes in rheological rate factor or basal slipperiness would be the next most likely candidate for the acceleration. They are also a potential factor for smaller discrepancies between observed and modelled results, even if they are not the dominant cause.
The inversion process was performed for a range of values of m and n by minimising the cost function of a misfit and regularisation term. Úa uses the adjoint method to calculate the gradients of the cost function with respect to both A and C in a computationally efficient way. We impose regularisation on A and C using Tikhonov regularisation (Tikhonov, Reference Tikhonov1963) of both the amplitude and spatial gradients of the A and C fields. The prior estimated/characteristic basal shear traction of A before inversion is 1.15 × 10⁻⁸ a−1 kPa−3, approximately representative of ice at − 10°C. The prior values of C are determined from the observational velocities using the relationship S Ob/τm, S Ob is the observed ice speed and τ the basal shear traction, in this case equal to 80 kPa. We tested a series of regularisation parameter values and selected final values based on an L-curve analysis that minimises the misfit without imposing over regularisation (Fig. 2c).
To test the impact of our assumed value for m, model inversions were carried out for m = 1 to m = 8 with a constant value of n = 3. Similarly, to test the impact of our assumed value for n model inversions were carried out for n = 1 to n = 8 with a constant value of m = 3. All inversions were performed with the 2017 ice-shelf extent. The resulting A and C fields are then used to calculate total ice discharge for Cook Glacier with the calving front in its 2017, 1989 and 1973 positions (Fig. 2d). Note that we are only interested in the model response to different forcings rather than accurately trying to reproduce past ice-shelf conditions. As such we only change the calving-front positions, with ice thickness and grounding-line position remaining constant. As expected, 2017 ice discharge shows the least variation, as 2017 ice velocities were used in the inversion process. Although there is a notable difference in response with changing values of m and n there is a qualitative similarity in that the 1989 ice discharge is greater than 1973 ice discharge, which is in turn greater than the 2017 ice discharge. For the sake of simplicity, therefore, we have chosen to use a flow exponent n = 3 and a non-linear Weertman-type sliding law with sliding exponent m = 3 throughout the rest of this study. We acknowledge that this may introduce a quantitative bias to our results (Fig. 2d), but the qualitative nature of our results is unaffected by our choice of the value for m and n. As all parameter choices show an acceleration of Cook West following the calving-front retreat, albeit with a range of values, we are confident that no other processes are needed to produce acceleration at Cook West. This is not the same thing as saying no other processes did occur or contributed to the observed acceleration.
The results for the model inversion (using n = 3 and m = 3) performed to estimate the properties of Cook Glacier that minimise the misfit between observed and modelled surface velocities are shown in Figure 3. We use BedMachine bed elevation and ice thickness (Morlighem and others, Reference Morlighem, Rignot and Binder2020) along with MeASUREs ice velocity for 2017 (Mouginot and others, Reference Mouginot, Rignot and Scheuchl2019). As there is a slight temporal discrepancy in these two datasets, with BedMachine ice extent being composed of data from 1993 to 2016 and the MeASUREs coverage being from 2017, we extend the ice shelf using nearest neighbour extrapolation of ice thickness. The difference in observed and modelled (Fig. 3a) ice velocity shows a good level of agreement. After 1000 iterations of the inversion process the mean difference between modelled and observed velocities was 8.2 m a−1, with the simulated results slightly under estimating velocities. Calculated values for the ice-rate factor, A (Fig. 3c), show spatial variation, particularly across the floating component of the ice shelf as well as upstream of Cook West's grounding line. The eastern half of Cook East has noticeably higher values of A, potentially a result of shear margin deformation or a lateral pinning point located in the eastern boundary of the ice shelf. Calculated values of basal slipperiness, C (Fig. 3d), also have a high amount of spatial variation, with higher values indicating more slippery basal conditions. These areas of high basal slipperiness correspond to the high near grounding-line velocities seen in the observed (Fig. 3a) and modelled (Fig. 3b) ice velocities. Note that C is not directly calculated by the model inversion for the bed under floating ice, as until the ice is in contact with the bed the basal slipperiness has no impact upon ice velocity.
Fig. 3. (a) Modelled ice speed using inverted properties minus observed MeASUREs ice speed (Mouginot and others, Reference Mouginot, Rignot and Scheuchl2019) plotted on model grid, (b) ice-rate factor, A, obtained from the inversion process and (c) basal slipperiness, C, obtained from the inversion process. Note that the standard Antarctic Polar Stereographic coordinates (EPSG:3031 WGS 84) are used.
Experimental design
To investigate the dynamics of Cook Glacier we combine the properties derived from the model inversion with different perturbations of the ice geometry representing past and possible future configurations of the ice shelf and compare these diagnostic simulations to a baseline case close to present-day conditions (2017). In all simulations, unless otherwise noted, ice thickness is kept constant at BedMachine values (Morlighem and others, Reference Morlighem, Rignot and Binder2020) with the grounding-line position calculated using the flotation criterion of ice by Úa. This results in the same grounding-line position as the BedMachine dataset and equivalent to that of the InSAR-derived grounding line of Depoorter and others (Reference Depoorter2013). Where there are no values for ice thickness, such as when the calving front is located beyond the BedMachine extent, we use the nearest-neighbour non-zero ice-thickness unless otherwise noted. We perform the following experiments to test various hypotheses of Cook Glaciers’ recent dynamics.
• CW-Past-CF: To investigate the cause of Cook West's past acceleration we compare present-day modelled ice velocity with that arising from a prescribed change in the calving front to the observed 1973 position (Fig. 2b). As there are no past records of ice-shelf thickness, we set the 1973 ice-front thickness of Cook West to be equal to present-day Cook East's, and increase ice thickness linearly from the calving front until it matches up with the current geometry. Note, this is different to the nearest neighbour interpolation used to account for the discrepancies between BedMachine ice thickness and the 2017 calving-front position. Using such an approach for the 1973 configuration of Cook West would lead to a large overestimation of ice thickness as the only available observations of ice thickness are located close to the grounding line. The ice-rate factor, A, of this newly introduced ice was set to the mean value of floating ice in the domain.
• CW-Past-GL: Here, we perform a simulation to determine if Cook West's acceleration was a result of grounding-line retreat in addition to the change in calving-front position. Starting from the model setup described in CW-Past-CF we simulate a more advanced grounding line by raising the bedrock to be in contact with the bottom of the ice shelf within a region next to the main ice inflow of Cook West extending up to a maximum distance of 5 km from the unperturbed grounding line. This has the effect of simulating a 1973 grounding line that is 5 km in advance of its present-day position, albeit localised to the immediate vicinity of the main ice flow over the grounding line. As values for the basal slipperiness, C, are not generated for this newly grounded area in our model inversion, we therefore prescribe nearest-neighbour values to those at the grounding line from the model inversion.
• CE-Past-CF: We perform a simulation to investigate the impact of the more advanced calving-front position in 2017 at Cook East compared to 1989. In the same way as for the investigation for Cook West, we compare the present-day modelled ice velocity to that arising from a change in calving-front position to its observed 1989 position (Miles and others, Reference Miles, Stokes and Jamieson2018). Although the position of the calving-front changes, the ice thickness is held constant, with all ice downstream of the 1989 calving front having its thickness set to 0 m by deactivating the corresponding elements of the model mesh.
• CE-Past-DH: In this experiment, we seek to determine if ice-shelf thinning in addition to the change in calving-front position could be responsible for the acceleration of Cook East. To do this, starting from the setup described for CE-Past-CF, we apply a uniform thickening to 1989 extent of the ice shelf using the rate of ice-shelf thickness change observed between 1994 and 2012 (Paolo and others, Reference Paolo, Fricker and Padman2015). This observed thinning rate has a very coarse resolution in the Cook area. This leads to an ice shelf up to 7 m thicker in 1989 than that in 2017 when scaled to represent the 28 years between 1989 and 2017. This imposed thickness change can potentially ground some previously floating nodes and, as such, we slightly reduce the magnitude of the thickness change applied to these nodes so as to maintain the same grounding-line position before and after the thickness change was applied. This has the effect of isolating the effect of thickness change upon ice velocity from that imposed by a change in grounding-line position.
• CE-Past-GL: Here, we perform a simulation to determine if Cook East's acceleration was a result of grounding-line retreat in addition to the change in calving-front position and ice-shelf thinning. Starting from the model setup described in CE-Past-DH we simulate a more advanced grounding line by raising the bedrock to be in contact with the bottom of the ice shelf within a region next to the main ice inflow of Cook East extending up to a maximum distance of 5 km from the unperturbed grounding line. This has the effect of simulating a 1989 grounding line that is 5 km in advance of its present-day position, albeit localised to the immediate vicinity of the main ice flow over the grounding line. Our method for imposing a grounding-line perturbation will lead to the imposition of a retrograde slope as it effectively follows the gradient of the underside of the ice shelf. However, in this particular case, Cook East already lies on a retrograde slope and as such we would hope the effect on dynamics is limited. As values for the basal slipperiness, C, are not generated for this newly grounded area in our model inversion, we therefore prescribe nearest-neighbour values to those at the grounding line from the model inversion.
• CW-Future: To determine the future sensitivity of Cook West to grounding-line retreat we simulate a potential retreat from its present-day location by lowering the bedrock in contact with the underside of the ice shelf downstream from a perturbed grounding-line position in a box extending up to 15 km from the present-day grounding line in increments of 2.5 km at a time. Initial experiments were performed with the perturbation following contours of bed elevation, with the grounding line ungrounded to a certain depth each time. This did not significantly change the pattern of results when compared to ungrounding to a certain distance from the grounding line (the ‘box geometry’ used in the final perturbation experiments). This has the effect of ungrounding the ice while maintaining the same thickness over the newly ungrounded area. It should be noted that simulating an instantaneous perturbation in grounding-line position can be modelled in two fashions, either by directly changing the ice thickness or the position of the bedrock in contact with the ice over the desired area of ungrounding. In the first case, there are two sources of imposed velocity change, namely velocity change due to changing the area of bedrock in contact with the underside of the ice shelf and velocity change imposed via flux conservation when the ice thickness at a location is modified. However, if the bedrock position itself is modified, then the imposed velocity change from flux conservation can be avoided. It is this second approach that we have used throughout this study, in the same fashion as that used by Miles and others (Reference Miles2021) to examine the effect of grounding-line perturbation on instantaneous ice velocity for Denman Glacier.
• CE-Future: Finally, we also investigate the sensitivity of Cook East to calving-front retreat. To simulate this we remove ice from Cook East's ice shelf by deactivating model nodes in increments relative to a reference line parallel to the calving front and calculate the resulting change in grounding-line flux. We only remove floating ice and do not allow any previously grounded ice to unground, except for the small pinning point on the eastern boundary which is allowed to unground.
Note that, due to the complete collapse of Cook West ice shelf following its 1973 calving event, it was decided not to perform a separate simulation investigating the effect of ice-shelf thinning at Cook West.
Results
The past acceleration of Cook West (CW-Past)
The following two experiments were performed to determine the probable causes of the observed acceleration of 700 m a−1 in ice speed over the grounding line at Cook East since 1973 (Fig. 1c).
The CW-Past-CF perturbation experiment was designed to show whether the observed acceleration can be explained by the change in calving-front position. When the modelled ice velocity for Cook West for 1973 (Fig. 4a) is compared to the modelled 2017 velocities (Fig. 4b) a similar overall spatial pattern is seen, with the highest velocities in both cases occurring on the western boundary of the ice shelf. A direct comparison between the two (Fig. 4c) shows an increase of 300 m a−1 in ice velocity at the grounding line by the western boundary for the 2017 case when compared to the 1973 case. This is lower than the observed increase in velocity of 600 ± 450 ma−1 although well within the range of observational error. Although there is also a reduction in ice velocity over the eastern half of Cook West in 2017, this occurs in the along grounding-line direction rather than directly across the grounding line. This area is also much shallower than the western boundary, which slopes down from the grounding line to a depth of 1500 m below sea level 15 km upstream of the grounding line (Fig. 4d), making it of less importance than the western boundary when considering the total ice discharge of Cook West. Thus, we find that the instantaneous response of Cook West to a retreat from its 1973 calving-front position is to accelerate, albeit with the magnitude of acceleration less than observations..
Fig. 4. Simulated impact of retreated calving-front position between 1973 and 2017 (CW-PAST). (a) Cook West modelled ice speed (colours) and velocity (arrows) for 1973 calving-front position. Cook West modelled ice speed (colours) and velocity (arrows) for (b) 2017 calving-front position. (c) Difference between modelled 2017 and 1973 ice velocities (positive values indicate faster flowing ice in 2017). (d) Model bed elevation. Note that the standard Antarctic Polar Stereographic coordinates (EPSG:3031 WGS 84) are used.
The CW-Past-GL perturbation shows the effect of combining the previous calving-front perturbation with an imposed grounding-line perturbation up to 5 km in advance of its 2017 position (Fig. 5a). A comparison between the 1973 (Fig. 5b) and 2017 (Fig. 5c) modelled ice velocities shows the previously highest velocities along the western boundary have been slowed down by the more advanced grounding-line position. A direct comparison between the 1989 and 2017 ice velocities (Fig. 5d) shows that the 2017 ice velocities are the same or greater than the 1989 velocities over the entire ice shelf, including the area that was simulated to decelerate with just the calving-front perturbation. Simulated 1973 velocities in the western boundary show a 600 ma−1 acceleration when compared to the 2017 observations. Thus, we find that the instantaneous response of Cook West to an imposed grounding-line perturbation in combination with a calving-front perturbation is an increased acceleration when compared to the calving-front perturbation on its own.
Fig. 5. Simulated impact of retreated calving-front position combined with grounding-line retreat between 1973 and 2017 (CW-Past-GL). (a) The original (black) and modified (red) grounding line where the 1973 grounding-line position is advanced from its 2017 location. (b) Cook West modelled ice speed (colours) and velocity (arrows) for simulated 1973 calving-front position and grounding-line position. (c) Cook West modelled ice speed (colours) and velocity (arrows) 2017 calving-front position. (d) Difference between modelled 2017 and 1973 ice velocities (positive values indicate faster flowing ice in 2017). Note that the standard Antarctic Polar Stereographic coordinates (EPSG:3031 WGS 84) are used.
The past acceleration of Cook East (CE-Past)
The following three experiments were performed to determine the probable causes of the observed acceleration of 100 m a−1 in ice speed just upstream of the grounding line at Cook East since 1989 (Fig. 1d).
The CE-Past-CF perturbation tests the effect of varying calving-front position upon ice velocity. The modelled 1989 velocities (Fig. 6a) share a superficially similar spatial pattern with the 2017 ice velocities (Fig. 6b), both having velocities increasing with distance from the grounding line towards the calving front. The 1989 velocities are noticeably higher than the 2017 velocities, with a direct comparison (Fig. 6c) showing velocities 100 m a−1 lower just downstream of the grounding line and 400 m a−1 lower by the calving front in 2017. There are some slight increases in 2017 velocity compared to 1989 velocity over the western side of Cook East, primarily in the along grounding-line direction rather than the across grounding-line direction. This velocity increase happens in a relatively shallower location (Fig. 6d, bed elevation of − 500 m) than the primary area of ice outflow from Cook East (Fig. 6d, bed elevation of − 1000 m) and as such is of less importance when considering the total ice discharge from Cook East. Thus, we find that the recent acceleration of Cook East was not caused by the advancing calving-front position since 1989 because the sensitivity of the ice shelf is to reduce ice velocity in response to a more advanced calving-front position.
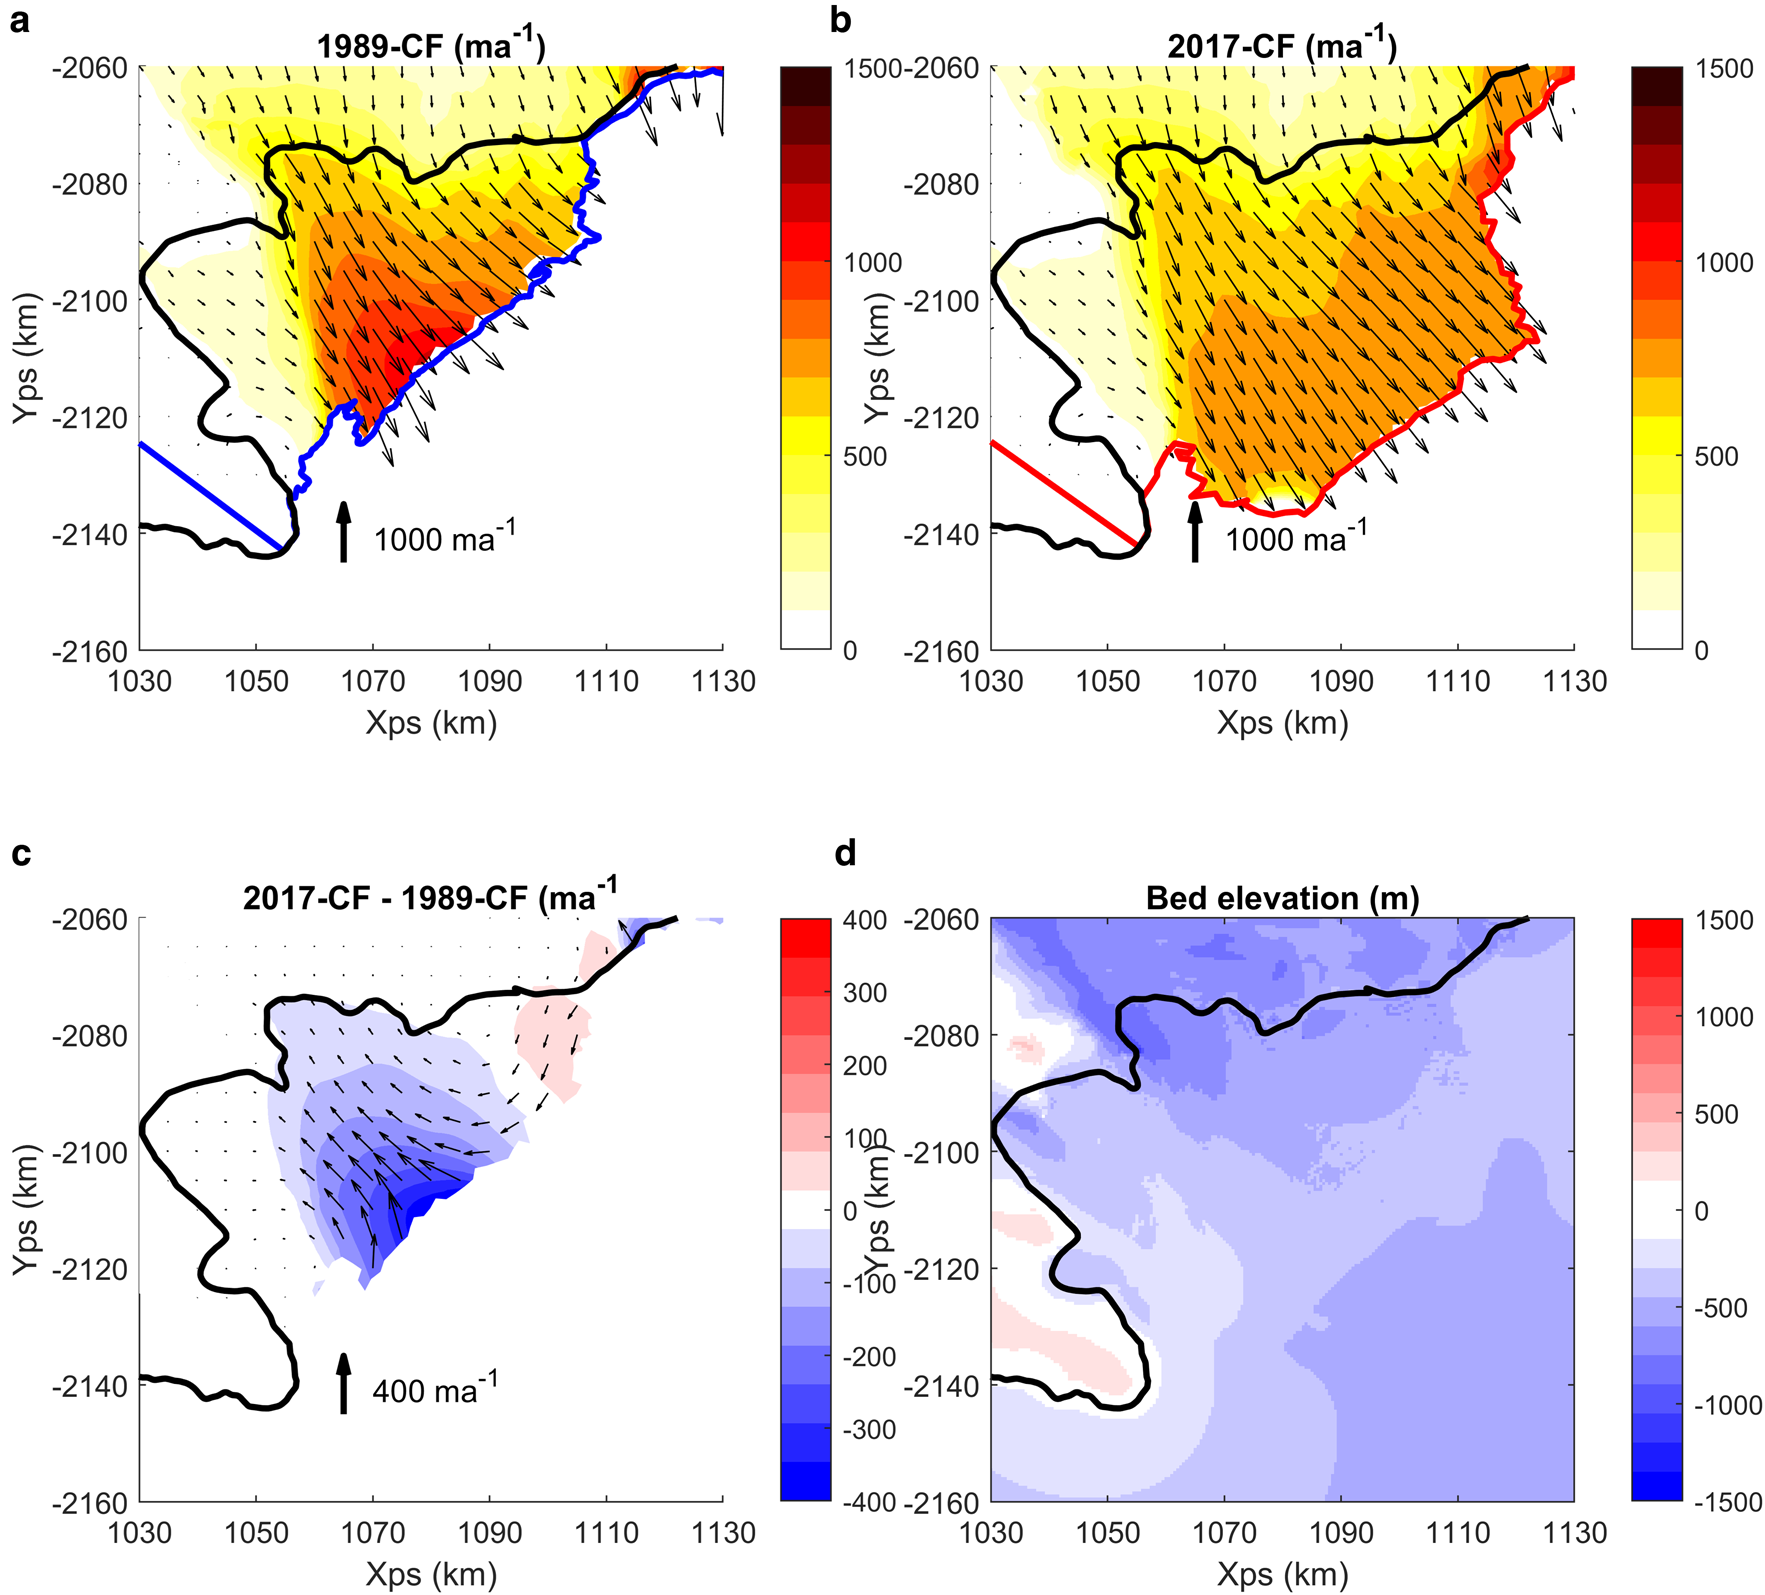
Fig. 6. Simulated impact of retreated calving-front position between 1989 and 2017 (CE-Past-CF). (a) Cook East modelled ice speed (colours) and velocity (arrows) for 1989 calving-front position. (b) Cook East modelled ice speed (colours) and velocity (arrows) for 2017 calving-front position. (c) Difference between modelled 2017 and 1989 ice velocities (positive values indicate faster flowing ice in 2017). (d) Model bed elevation. Note that the standard Antarctic Polar Stereographic coordinates (EPSG:3031 WGS 84) are used.
The CE-Past-DH perturbation shows the effect of combining the previous calving-front perturbation with an imposed thickness change designed to simulate an ice shelf that was thicker in 1989 than in 2017. The sparse observations of ice-shelf thinning (Paolo and others, Reference Paolo, Fricker and Padman2015) over Cook East are shown interpolated onto the model grid in Figure 7a, where a uniform change of 7 m was used in the model simulation (see ‘Methods’ section). A comparison between modelled 1989 (Fig. 7b) and modelled 2017 (Fig. 7c) ice velocities again shows a similar general spatial pattern, with velocities increasing from the grounding line towards the calving front. A direct comparison between 1989 and 2017 velocities (Fig. 7d) shows slower velocities in 2017 from the middle of the ice shelf towards the calving front, with velocities up to 400 m a−1 slower at the calving front in 2017 than in 1989. There is a small increase of up to 50 m a−1 in 2017 ice velocity in the area just downstream of the grounding line when compared to the 1989 velocities that is in addition to the increase in velocity in the along grounding-line direction seen on the western side of Cook East. This shows that ice-shelf thinning can explain the observed acceleration in the immediate vicinity of the grounding line but not in the area downstream of the grounding line towards the calving front.
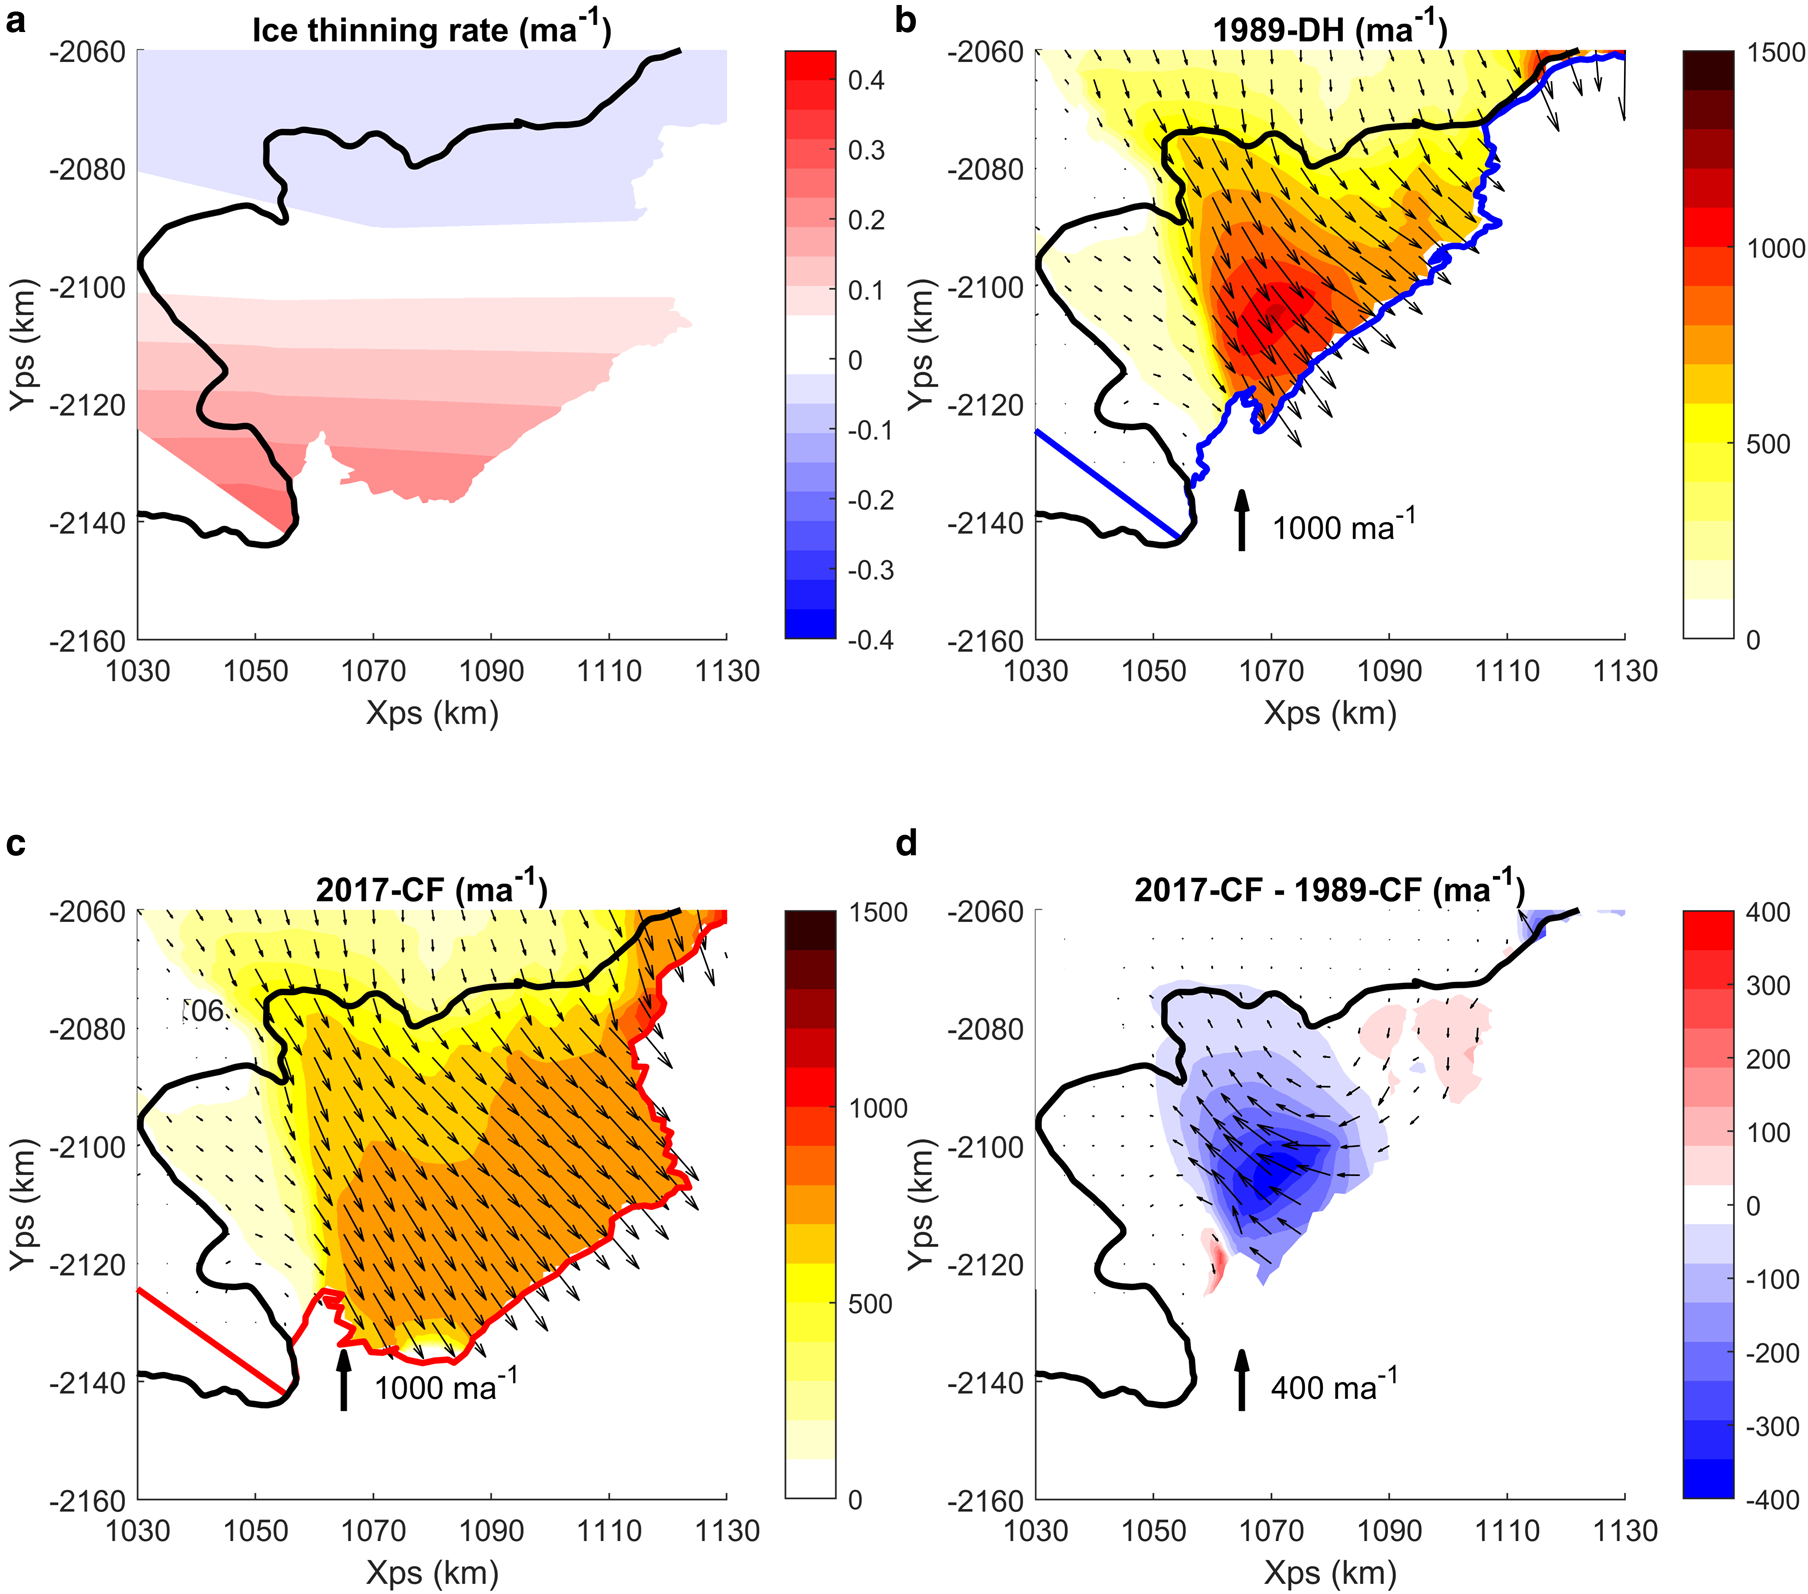
Fig. 7. Simulated impact of retreated calving-front position and ice-thickness change between 1989 and 2017 (CE-Past-DH). (a) Mean yearly observed ice-thinning rates between 1994 and 2011, with positive values indicating thinning ice (Paolo and others, Reference Paolo, Fricker and Padman2015). (b) Cook East modelled ice speed (colours) and velocity (arrows) for 1989 calving-front position. (c) Cook East modelled ice speed (colours) and velocity (arrows) for 2017 calving-front position. (d) Difference between modelled 2017 and 1989 ice velocities (positive values indicate faster flowing ice in 2017). Note that the standard Antarctic Polar Stereographic coordinates (EPSG:3031 WGS 84) are used.
Finally, the CE-Past-GL perturbation experiment combines the previous calving front and ice thickness perturbation with a grounding-line perturbation simulating a 1989 grounding line up to 5 km in advance of its 2017 position (Fig. 8a). A comparison between the 1989 (Fig. 8b) and 2017 (Fig. 8c) modelled ice velocities again shows the same general spatial patterns of ice velocity increasing from the grounding line towards the calving front, albeit with the modelled 1989 ice velocities being noticeably slower in the area downstream of the grounding line than the 2017 ice velocities. A direct comparison between the 1989 and 2017 ice velocities (Fig. 8d) shows that the 2017 ice velocities are greater than the 1989 velocities over the majority of the ice shelf, with the exception of a small area near the calving front. This is particularly notable in the area surrounding the grounding line, with 2017 velocities up to 200 m a−1 higher in the area just downstream of the grounding line and 100 m a−1 higher in the area just upstream of the grounding line. Thus, we find that a change in grounding-line position at Cook East since 1989 are required to generate the observed acceleration over the majority of the ice shelf.

Fig. 8. Simulated impact of retreated calving-front position, ice-thickness change and grounding-line retreat between 1989 and 2017 (CE-Past-GL). (a) The original (black) and modified grounding line where the 1989 grounding-line position is advanced from its 2017 location. (b) Cook East modelled ice speed (colours) and velocity (arrows) for simulated 1989 calving-front position, ice thickness and grounding-line position. (c) Cook East modelled ice speed (colours) and velocity (arrows) for 2017 calving-front position. (d) Difference between modelled 2017 and 1989 ice velocities (positive values indicate faster flowing ice in 2017). Note that the standard Antarctic Polar Stereographic coordinates (EPSG:3031 WGS 84) are used.
Future changes at Cook West (CW-Future)
The (CW-Future) experiment sought to determine the instantaneous response of Cook West to the imposition of future grounding-line retreat. Here, the grounding line is progressively retreated back along the western boundary of Cook West between the two areas of relatively high bedrock (Fig. 9a). This has the effect of rapidly increasing the grounding-line flux, with flux increasing from 12 Gt a−1 with no grounding-line position change to 25 Gt a−1 after a 5 km retreat and 41 Gt a−1 after 10 km (Fig. 9b). Further retreat into the deep trough upstream of the Cook West grounding line leads to a rapid increase in grounding-line flux.
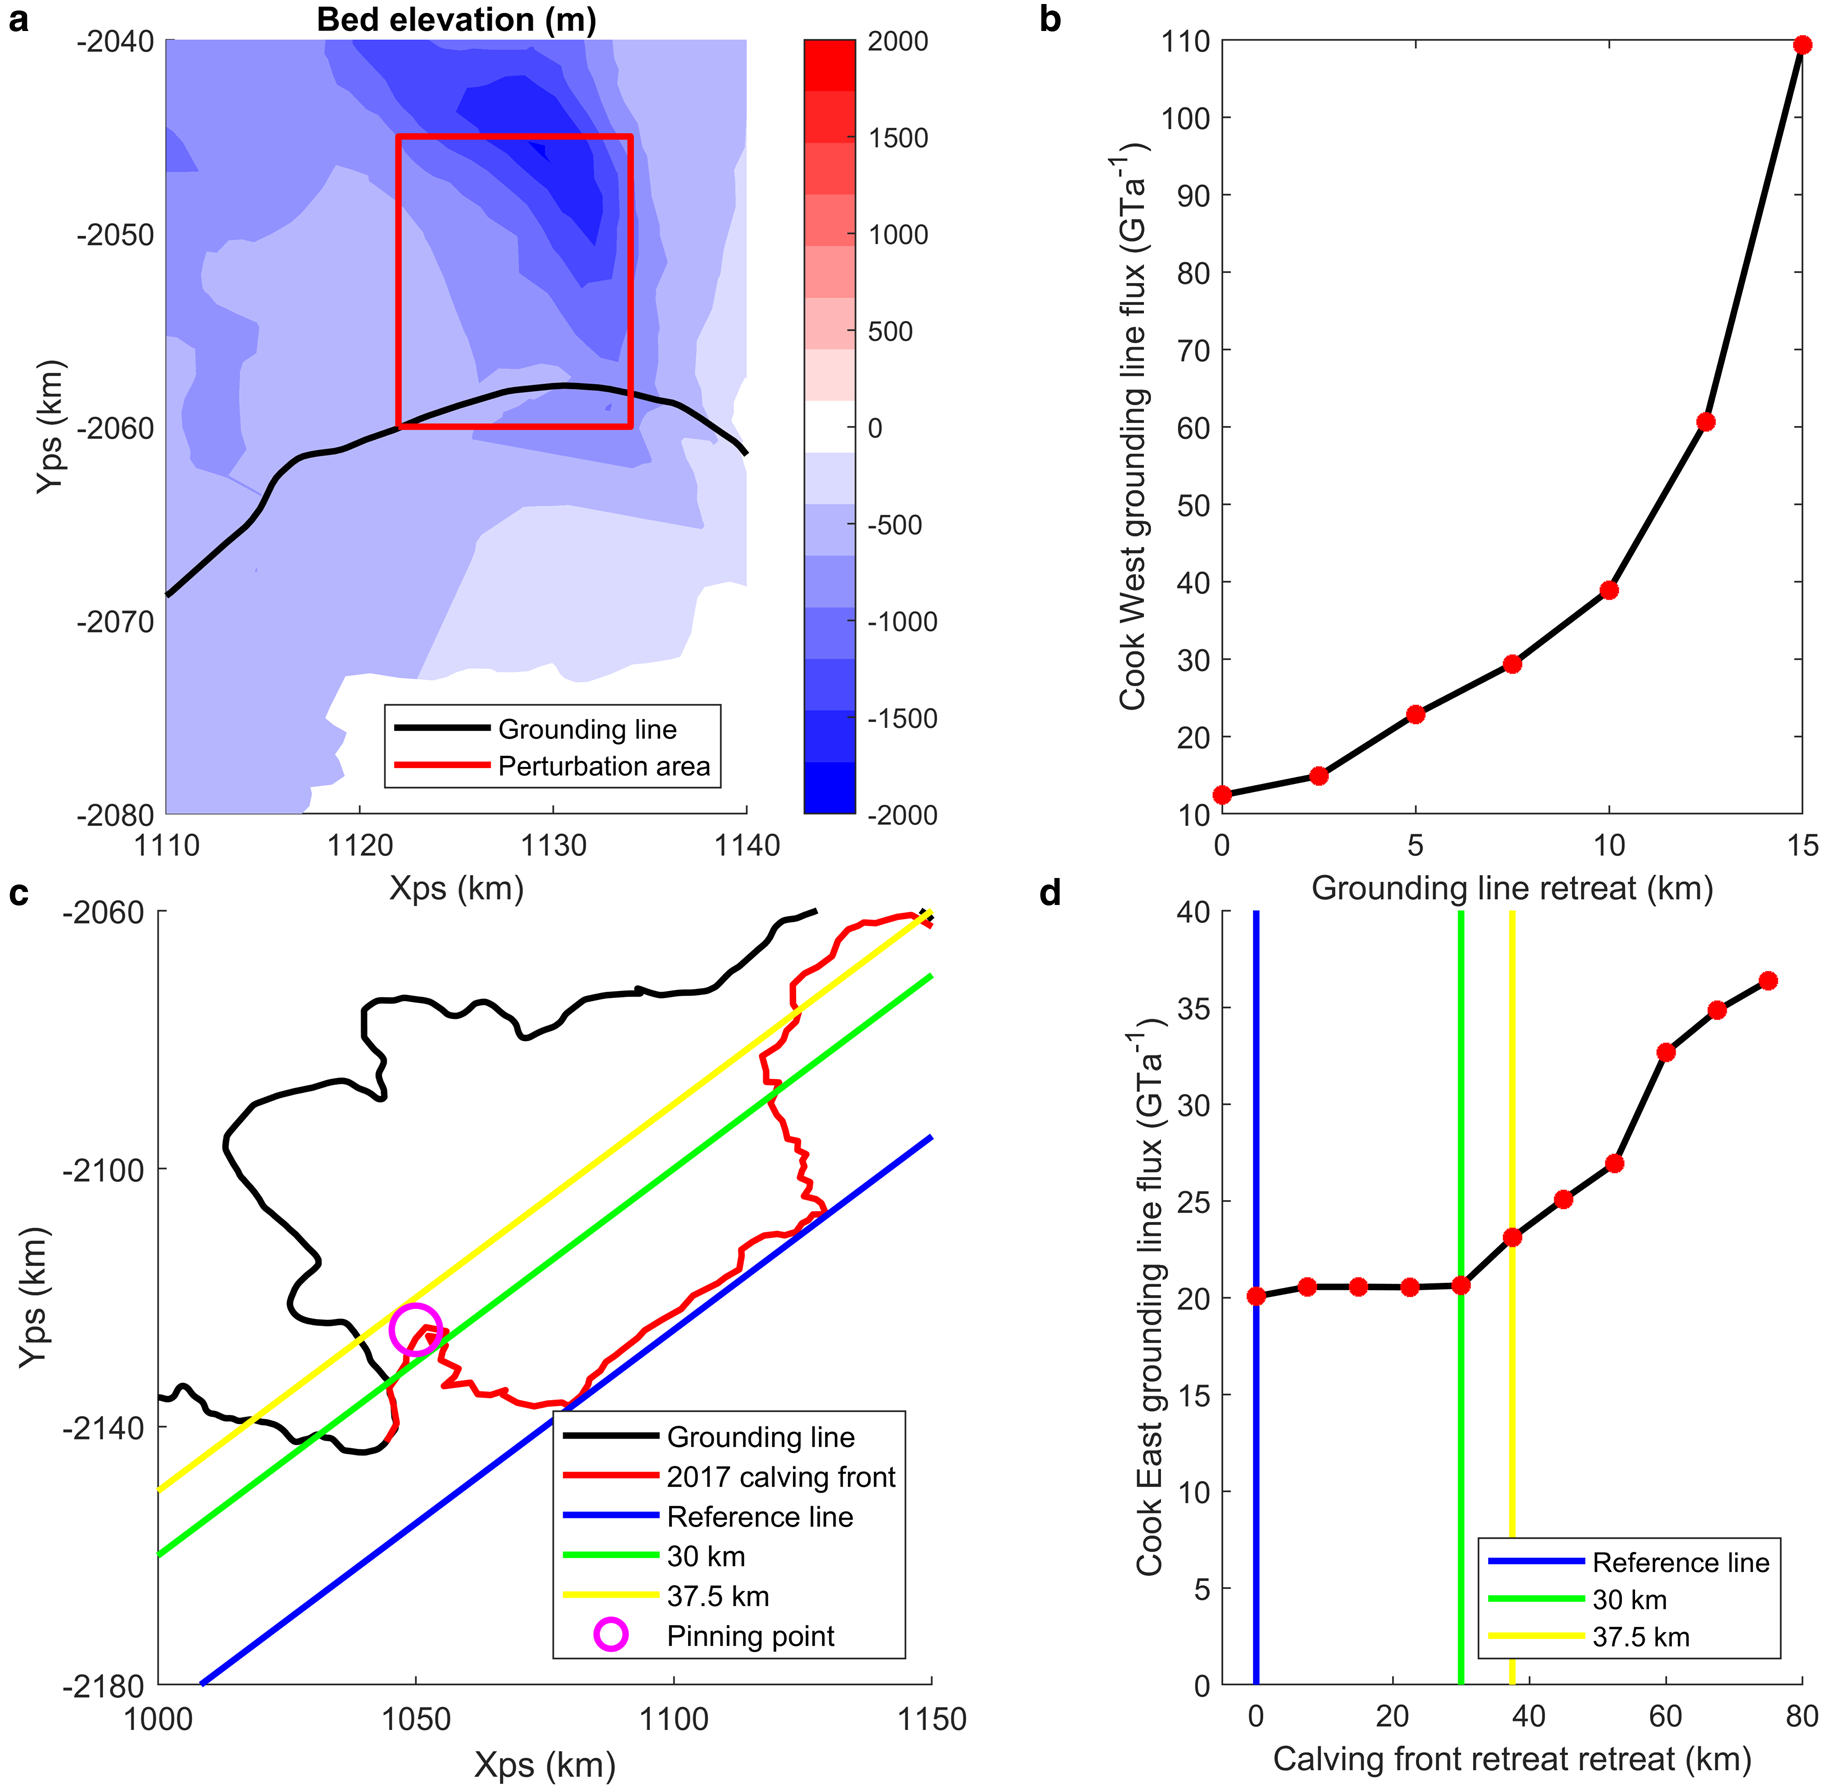
Fig. 9. Future Cook ice-shelf geometry perturbations (CE-Future and CW-Future). (a) Bed elevation (colours) and area of grounding-line perturbation experiment (red) for Cook West. (b) Annual flux over the grounding line for Cook West following an imposed instantaneous retreat of the grounding line. Note that a small retreat of the grounding line can lead to a large instantaneous increase in ice discharge. (c) Schematic of calving-front perturbations experiment, showing the reference line and pinning point. (d) Annual flux over the grounding line for Cook East following an instantaneous removal of floating ice. Note that large instantaneous increase in ice discharge if the ice were to ever retreat past the eastern pinning point (magenta circle). The side of the rectangle closest to the present grounding line in (a) corresponds to 0 in (b), with grounding-line retreat being imposed in increments from this line over the area shown in the rectangle. The coloured lines in (c) correspond to the same positions in (d). Note that (a) and (c) use the standard Antarctic Polar Stereographic coordinates (EPSG:3031 WGS 84).
Future changes at Cook East (CE-Future)
The (CE-Future) experiment seeks to determine the susceptibility of Cook East to future changes in calving-front position. The position of the reference line and the various calving-front positions are shown in Figure 9c, with the response in ice discharge shown in Figure 9d. With no ice removed there is an ice flux of 22 Gt a−1 over the grounding line. By removing up to 30 km of ice from the reference line there is a minimal (${< }1\percnt$ ) response in ice discharge. Between 30 and 37.5 km the ice is ungrounded from an eastern lateral pinning point on an island, with a corresponding increase in grounding-line flux. This carries on in a linear fashion until all ice is removed, eventually increasing grounding-line flux to 37 Gt a−1 by the time all the ice shelf is removed.
Discussion
Controls on the past behaviour of Cook West and Cook East
Since Cook West's most recent major calving event sometime after 1973, ice speed at the grounding line was observed to have approximately doubled (although with large errors on the 1973 observations) and the majority of the ice shelf disappeared (Miles and others, Reference Miles, Stokes and Jamieson2018). The agreement, albeit with an underestimation within error range, between the modelled acceleration of Cook West and the observed changes following its calving event prior to 1973 (observed acceleration of 600 ± 450 ma−1, modelled acceleration of 300 ma−1) shows that the loss of ice-shelf buttressing was sufficient to produce the changes in observed ice speed. A potential cause of this discrepancy is that our model set-up uses fixed values of basal slipperiness and the ice-rate factor, as determined from present-day observations. If these were different in the past they could account for remaining difference between observed and modelled ice velocities. Another potential explanation for the under estimation of ice acceleration at Cook West is that the grounding line may have potentially retreated since 1973. When the change in calving-front position is combined with a potential 1973 grounding-line position the simulated acceleration of Cook West is enhanced, achieving a comparable magnitude of acceleration to observations when the grounding line is perturbed up to 5 km from its present-day location. This supports the hypothesis that the calving event in the 1970s and the subsequent loss of buttressing, potentially combined with a retreat in grounding-line position, contributed strongly to Cook West's acceleration (cf. Miles and others, Reference Miles, Stokes and Jamieson2018).
Determining the cause of Cook East's acceleration, however, is not as simple. Miles and others (Reference Miles, Stokes and Jamieson2018) found there was an ~$20\percnt$ increase in observed ice speed in 2017 compared to 1989 in the area just upstream of the grounding line of Cook East. Ice velocities were also found to have increased by a comparable amount downstream from the grounding line over the main body of the ice shelf. Perturbing the calving front to its 1989 position was found to produce higher ice velocities for the 1989 simulation than the 2017 simulation, which contrast with observations. Therefore, and unsurprisingly, we can eliminate the advance in calving-front position as a possible mechanism for the observed acceleration, while noting that any other ice geometry perturbations will have to counteract the deceleration caused by the change in calving-front position to reproduce observed velocities.
A combination of a change in the calving front to its 1989 position and ice-shelf thinning likewise results in a velocity difference in the opposite direction for the floating portion of the ice shelf, with the 1989 simulation having greater ice velocities than the 2017 simulation. In the immediate vicinity of the grounding line, however, there was a small increase in ice velocity in 2017, although this did not permeate far upstream of the grounding line. As such, we can eliminate ice-shelf thinning as the primary cause of Cook East's acceleration; even if it were responsible for the near grounding-line acceleration, it is not able to counteract the effect of the change in calving-front position on downstream velocity or affect ice velocities upstream of the grounding line.
It is only by assuming that the grounding line was previously more advanced than it is at present that we can reproduce the observed acceleration of Cook East in the area just upstream of the grounding line as well as downstream of the grounding line (albeit with a small area in the immediate vicinity of the calving front where we do not reproduce observations). Thus, our results do not support the notion that ice-shelf thinning is the primary cause of Cook East's acceleration (as proposed by Miles and others, Reference Miles, Stokes and Jamieson2018) but instead suggest that, in order to reproduce past observations, Cook East's grounding line used to be in a more advanced position in 1989 than it is now. Note that we do not presume to know the exact position of the 1989 grounding line, only that it being more advanced than its 2017 position produces ice velocities consistent with observations both in the immediate vicinity of the ground line and most of the area downstream of the grounding line.
Whether such a retreat resulted from ice-shelf thinning due to oceanic warming or as a result of Cook East's last calving event is unclear, as oceanic observations of the local area are scarce, due to the heavy prevalence of sea ice making it problematic to reach by research vessels. Estimated basal melt rates in the region are no more than 2 m a−1 (Depoorter and others, Reference Depoorter2013; Rignot and others, Reference Rignot, Jacobs, Mouginot and Scheuchl2013; Adusumilli and others, Reference Adusumilli, Fricker, Medley, Padman and Siegfried2020), suggesting that recent warm-water intrusions are rare. The nearby Mertz ice tongue (through which the WSB also drains), however, has higher melt rates of up to 5 m a−1. Although some observations taken off the coast of the WSB in 1995 (Foster, Reference Foster1995) and more recent observations near the Mertz Ice Tongue in 2015 (Silvano and others, Reference Silvano, Rintoul and Herraiz-Borreguero2016) found no evidence of warm-water intrusions, other observations in 2010 found warm-water intrusions in the vicinity of the Mertz Ice Tongue (Williams and others, Reference Williams2010). Numerical simulations also show that similar warm-water intrusions could occur for Cook Glacier (Kusahara and others, Reference Kusahara2017). The strength of polynyas (which are known to affect the melt-rates of nearby ice shelves) near the Mertz Ice Tongue have been shown to change following calving events (Tamura and others, Reference Tamura, Ohshima, Fraser and Williams2016). It is possible past calving events at Cook could have had a similar effect, although likely a lower effect due to the relatively larger scale of the Mertz Ice Tongue calving event.
To summarise, recent study appears to suggest relatively low melt rates in the vicinity of Cook Glacier but we cannot rule out the possibility that current observations do not capture the full range of inter-decadal variability and that some warmer-than-present ocean conditions occurred in the mid-20th century (Miles and others, Reference Miles, Stokes and Jamieson2018). Such conditions would be consistent with the observed removal of Cook West's ice shelf in the 1970s.
Future behaviour of Cook West and East glaciers
The ice front at Cook West is now undergoing more frequent, smaller calving events in a manner akin to a tidewater glacier (Meier and Post, Reference Meier and Post1987) rather than large-scale calving events more reminiscent of an ice shelf (Miles and others, Reference Miles, Stokes and Jamieson2018). Since Cook West's last calving event in the 1970s there has been no sign of the ice shelf regrowing (Miles and others, Reference Miles, Stokes and Jamieson2018). Moreover, our simulations show that the total grounding-line flux is now very sensitive to small changes in the grounding-line position, with a retreat of the grounding line of 10 km leading to an instantaneous response that would see ice flux increase by ~$300\percnt$ . The bed elevation decreases with distance from grounding line, making it very likely that once the grounding line starts to retreat it will continue to do so. It is, therefore, important to monitor the oceanic and atmospheric condition in the area to try and ascertain the relationship between these potential forcings and future grounding-line evolution.
Cook East appears to be less susceptible to grounding-line retreat, with a shallower sloping bed upstream of its grounding line than Cook West. The grounding-line position appears steady at present (even if a retreat of the grounding line potentially occurred in the 1990s, as we suggest), and has not changed significantly over the last 16 years ((Depoorter and others, Reference Depoorter2013; Konrad and others, Reference Konrad2018) and the ESA CCI project at http://cryoportal.enveo.at/). The largest uncertainty in Cook East's future, however, comes from an eastern pinning point (Fig. 9c). Our simulations show a minimal change in grounding-line flux until the calving-front retreats past the eastern pinning point. Grounding-line flux then begins to increase from 22 Gt a−1 to a maximum of 37 Gt a−1 when all the ice shelf is removed, an 85% increase in grounding-line flux. Given that the combined ice discharge for Cook East and West has been observed to have increased by 3 Gt a−1 since 1979 (Rignot and others, Reference Rignot2019) an increase in ice discharge approaching our simulated values would be a significant change to the dynamics of the region. Our finding that the ice downstream of this pinning point is largely passive in nature, and therefore does not provide any buttressing, is in broad agreement with past studies (Fürst and others, Reference Fürst2016; Reese and others, Reference Reese, Gudmundsson, Levermann and Winkelmann2018). Note that although the majority of the glacier's calving front has been inferred to have retreated past this point before (Miles and others, Reference Miles, Stokes and Jamieson2018), at no time has it been observed to unground from the eastern pinning point. There is no guarantee this will be the case in the future, especially if a calving event was more extensive then previously observed. Determining the conditions and processes that could lead to such an ungrounding of the ice is therefore of vital importance.
It should be noted that our simulations show the instantaneous response of Cook Glacier to changes in ice geometry rather than the long term, transient evolution of the system following an instantaneous change. Previous research on the Larsen B Ice Shelf has shown that numerical models are capable of accurately reproducing the instantaneous response on ice velocity to the total collapse of the ice shelf (De Rydt and others, Reference De Rydt, Gudmundsson, Rott and Bamber2015). Observations following the collapse of the Larsen B Ice Shelf show that following a large instantaneous increase in ice velocities there was a deceleration over the next few years (Rignot and others, Reference Rignot2004). Although velocities did decrease over the following years they remained in excess of their pre-collapse values. However, an investigation of Petermann Glaciers response to a large-scale calving event found similar sensitivity to iceberg calving in both a diagnostic (Hill and others, Reference Hill, Gudmundsson, Carr and Stokes2018) and transient (Hill and others, Reference Hill, Gudmundsson, Carr, Stokes and King2021) model simulation. As such it is perhaps best to think of our results as the upper limit of velocity response to an instantaneous change, with transient simulations likely to be the of the same or less magnitude.
Conclusions
We have used the finite-element, ice dynamics model Úa to show how changes in the calving front, ice thickness and grounding-line position of Cook Glacier can explain past observations of ice-flow velocity.
Model simulations of calving-front retreat for Cook West are able to produce changes of a similar magnitude to observations of ice-speed acceleration following the 1973 calving event, with this acceleration enhanced by a potential grounding-line retreat. Model simulations that only prescribe ice-shelf thinning at Cook East do not reproduce ice-speed acceleration in the 1990s. However, when thinning is combined with a simulated grounding-line retreat an acceleration in ice speed of a comparable magnitude can be obtained, indicating that the grounding line at Cook East was previously in a more advanced location.
There is the potential for future changes in ice geometry at Cook Glacier to have significant impacts upon its contribution to future global mean sea level rise. A future retreat in Cook East's calving-front position would have a minimal effect on ice flow, unless it were to cause ungrounding from the eastern lateral pinning point. In this case, instantaneous ice flux would increase, reaching a value $85\percnt$ higher than present if the whole ice shelf is removed. If the Cook West grounding line were to retreat onto its inland, downward sloping bed by 10 km there would be a corresponding increase in instantaneous grounding-line flux of ~$300\percnt$
 . These experiments solely focus on the instantaneous response to changes in ice geometry, and future research could explore transient simulations where ice geometry changes over time in direct response to atmospheric and oceanic forcing.
Acknowledgements
The authors thank the journal editor and reviewers for their insightful and constructive feedback. This study was funded by the Natural Environment Research Council, grant No. NE/R000719/1.


 Open access