


1. Introduction
Definitions of ice aprons (IAs hereafter) are often conflicting. IAs have been defined as ‘thin mass of snow and ice adhering to a mountainside’ by Armstrong and others (Reference Armstrong, Roberts and Swithinbank1973). Bhutiyani (Reference Bhutiyani, Singh, Singh and Haritashya2011) states that IAs are ‘small accumulations of snow and ice, generally found above the equilibrium line, that stick to the topography of the glacierized basin’. Among mountain glaciers constrained by the topography, Benn and Evans (Reference Benn and Evans2010) identify a group related to the smallest glaciers with: (1) glacierets that are thin ice patches produced by snowdrifting and avalanching and occupying depressions on low-angle terrains; (2) niche glaciers that are ice bodies, undergoing significant movement, whose location is controlled by a niche or rock bench in a mountain or valley side and (3) ice aprons that are ‘thin snow and ice accumulations adhering to mountainsides’ (Fig. 1), to which they add snow patches. For Cogley and others (Reference Cogley2011), IA is synonymous to ‘mountain apron glacier’. This definition conflicts with the previously stated ones over the dynamics of IAs (flowing glaciers vs non-flowing IAs). Guillet and Ravanel (Reference Guillet and Ravanel2020) further defined IAs where gravity-driven mass transfer is considered to be negligible. IAs are thus defined as ‘very small (typically <0.1 km2) ice bodies of irregular outline, lying on slopes >40°, regardless of whether they are thick enough to significantly deform under their own weight’. This definition covers IAs in all types of high-alpine north faces (see Figs 1, 2) and will be further used here and completed or corrected if necessary.

Fig. 1. IAs. (a) Sketch (cross section) of an IA overlooking a cirque glacier. IAs are present in different contexts, as in the MBM; (b) west face of Mont Maudit (4465 m a.s.l.); (c) north face of Mont Blanc du Tacul (4248 m) with its rocky Triangle (3970 m); (d) north face of Aiguille de Bionnassay (4052 m); (e) east face of Mont Blanc (4808 m). IAs are present in many high-altitude mountain ranges: (f) north face of Shivling (6543 m, Garhwal Himalaya, India; photo: A. Upadhya); (g) west face of Tocllaraju (6034 m a.s.l.; Cordillera Blanca, Peruvian Andes; photo: N. Heald); (h) Mount Robson (3954 m, Canadian Rockies; photo: B. Derek). Yellow arrows indicate IAs. Numbers correspond to different contexts (see Section 3.2): (1) ‘long-standing exposed’ IA; (2) IA previously buried under the ice of another glacier (on B: thickness reduction of one of the tributaries of Bossons Glacier; on D: shrinkage of Bionnassay Glacier revealed several tens of metres high slopes); (3) quasi-continuous IA; (4) IAs overlooking hanging, slope or cirque glaciers.

Fig. 2. Typology of the high-alpine north faces according to Galibert (Reference Galibert1965) excluding slopes with thick mobile glacier like avalanching glaciers or ice falls. (a) North face with almost continuous ice/snow cover – Trugberg north ridge (3933 m a.s.l., Bernese Alps, Switzerland) with its north (left) and west (right) faces (photo: September 2018); (b) mixed north face – Mönch north face (4107 m, Bernese Alps, Switzerland) (photo: S. Rasanen, August 2012); (c) north rock face partly covered by ice – Jungfrau northwest face (4158 m, Bernese Alps, Switzerland) (photo: B. Tibbetts, March 2018).
Within the mountaineering community, the north faces of Matterhorn (4478 m a.s.l., Valais Alps, Switzerland), Grandes Jorasses (4208 m, Mont-Blanc massif, France), Eiger (3967 m, Bernese Oberland, Switzerland) and Drus (3754 m, Mont-Blanc massif, France) are known – due to their difficulty and height – as the ‘four great north faces of the alps’. These steep rock faces participate in the alpine myth (Raffestin, Reference Raffestin2001) through the high-mountain landscapes to which they contribute with more or less large IAs. These ice bodies are permanently present in many north faces located above 3000/3500 m a.s.l. in the alps and sometimes on sunnier slopes at higher altitudes (e.g. Italian side of Mont Blanc, 4808 m a.s.l.). Over the last century and a half, several IAs in the Mont-Blanc massif (MBM) have recorded drastic surface area loss, with an increase in melting rates since the 1990s. Recent melt became more and more visible thanks to the disconnection between current ice surfaces and past in situ mountaineering equipment, as well as the emergence of rock spurs within IAs. This evolution not only contributes to changing the high-alpine landscapes – which are becoming darker and darker by losing ice and snow (Moreau, Reference Moreau2010) – but also challenges the traditional practice of mountaineering which has used these IAs as access routes to summits for more than a century. Rébuffat (Reference Rebuffat1973) – a French mountain guide who was the first to climb all four of the great north faces – published a collection of the 100 most beautiful mountaineering routes of the MBM. In total, 50% of them include IAs, and recent changes make the climbs more technically challenging and dangerous (Mourey and others, Reference Mourey, Marcuzzi, Ravanel and Pallandre2019). In terms of difficulty, this results today in steeper IAs, with predominant ice surface while they were generally covered with snow until the early 2000s, requiring advanced ice climbing skills. In addition, the retreat of IAs is likely to trigger rockfalls, endangering mountaineers within their vicinity. Given their very small dimensions, the effects of the IA vanishing on water availability and ecology are minimal. Interest in IAs is however renewed today because of (1) the current and future impacts of their evolution on mountaineering, (2) their relation with, and impact on the underlying permafrost and rockfall hazards associated with its degradation/warming and (3) the profound lack of fundamental knowledge.
Despite the absence of widespread and systematic surveys, IAs are very frequent in high-alpine mountain areas like the Andes, Rockies, Himalaya or European Alps (Fig. 1). Nonetheless, IAs have so far received relatively poor attention since the works of Galibert (Reference Galibert1960b, Reference Galibert1965) that documented IAs in three types of north faces (excluding slopes with thick mobile glaciers) (Fig. 2):
(1) the faces with quasi-continuous ‘snow/ice shells’ (Galibert, Reference Galibert1965). Their almost immobility without any crevasses distinguishes them from crevassed and mobile slope glaciers (Galibert, Reference Galibert1960a). However, very slight movements can in places be revealed by cracks visible on the surface. The author notes that, in the case of Trugberg (3933 m a.s.l., Bernese Alps, Switzerland, Fig. 2a), the layer of snow covering the ice was 2- (top part) to 15 m thick (lower part) with coarse-grained snow beds alternating with layers of ice. Deeper, the snow was giving way to massive ice until bedrock.
(2) The mixed north faces where large sectors of bare rock contrast with the ‘ice/snow filling couloirs and hollows’. The thickness of the fillings typically varies from 3 to 5 m, and their distribution is likely to be related to rock structures enabling snow deposition and ice formation in the most fractured areas. Galibert (Reference Galibert1965) gives the north face of Mönch (4107 m a.s.l., Bernese Alps, Switzerland; Fig. 2b) as an example.
(3) The sub-vertical rock faces with ‘high-altitude ice covers’. Few north faces culminating above 4000 m a.s.l. are rocky up to their summit (Galibert, Reference Galibert1960b). Only slopes >70° seem to exclude the formation of ice cover. Such rock walls are strongly inclined and, in a more or less discontinuous manner, can be covered with sparse, thin ice patches whose formation is favoured, as in the case of the northwest face of Jungfrau (4158 m a.s.l., Bernese Alps, Switzerland; Fig. 2c), by the horizontal component of the rock structure (small ledges on which snow and ice accumulate).
This typology also highlights the difficulty of precisely defining these small ice bodies and the necessity to differentiate them from other cryospheric bodies lying on steep slopes: thick mobile glaciers/icefalls (Benn and Evans, Reference Benn and Evans2010) and avalanching glaciers such as cold-based hanging glaciers (Flotron, Reference Flotron1977; Pralong and Funk, Reference Pralong and Funk2006; Margreth and others, Reference Margreth2011).
The origin of IAs, their evolution with time and climate and their relationships with other high-mountain cryospheric bodies in their vicinity (permafrost, hanging glaciers, etc.) remain to be explored. This paper reviews the existing knowledge on IAs, entirely carried out in the MBM. We will first evoke recently published remote sensing, modelling and statistical methods used to study IAs, before discussing the already published evolution of IAs since the end of the Little Ice Age (LIA, about 1850 CE). We then present in detail new complementing results of two on-site sensor arrays used for IA thermal monitoring. In addition, already published ice texture analysis and radiochemical dating from ice cores are presented. According to the reported ice texture and age dating, we also discuss the dynamic regime and the depth/age relationship for ice in IAs.
2. Study area: the Mont-Blanc massif
The MBM covers an area of 550 km2 in the north-western European Alps (Fig. 3). It is predominantly composed of a heavily fractured crystalline basement formed by a granitic body intruding through metamorphic series (Bertini and others, Reference Bertini, Marcucci, Nevini, Passerini and Sguazzoni1985; Bussy and von Raumer, Reference Bussy and von Raumer1994). In total, 28 of the 82 summits ⩾4000 m a.s.l. in the alps are located in the MBM, forming the drainage divide between the Rhône and Po basins. Permafrost or perennially frozen ground (Harris and others, Reference Harris2009) is present throughout a large area: modelled as ‘possible’, ‘likely’ and ‘almost certain’, permafrost covers 79, 65 and 45% of the 86 km2 of rock walls steeper than 40° on the French side of the MBM, respectively (Magnin and others, Reference Magnin, Brenning, Bodin, Deline and Ravanel2015a). Research carried out on steep permafrost-affected slopes of the MBM has in particular made it possible to show the relationship between global warming and slope instabilities (e.g. Ravanel and Deline, Reference Ravanel and Deline2011) before showing the role of warming permafrost within bedrock in rockfall triggering (e.g. Ravanel and others, Reference Ravanel, Magnin and Deline2017a, Reference Ravanel2017b; Legay and others, Reference Legay, Magnin and Ravanel2021). Next to topography and geological structure, ice-related permafrost conditions and topographic history including glacier vanishing are of primary importance in explaining rockfall occurrences. The formation and persistence of permafrost is driven by the cold mean annual air temperatures characteristic of high-altitude areas. In the MBM, the 0°C isotherm is situated from 2200 on the north side to 2700 m a.s.l. on the south side (Durand and others, Reference Durand2009). At the Aiguille du Midi (3842 m a.s.l.), the mean annual temperature is ~−7.8°C (Magnin and others, Reference Magnin, Deline, Ravanel, Noetzli and Pogliotti2015b). These low temperatures are also very likely a condition for the presence and persistence of cold IAs (Haeberli, Reference Haeberli1975).
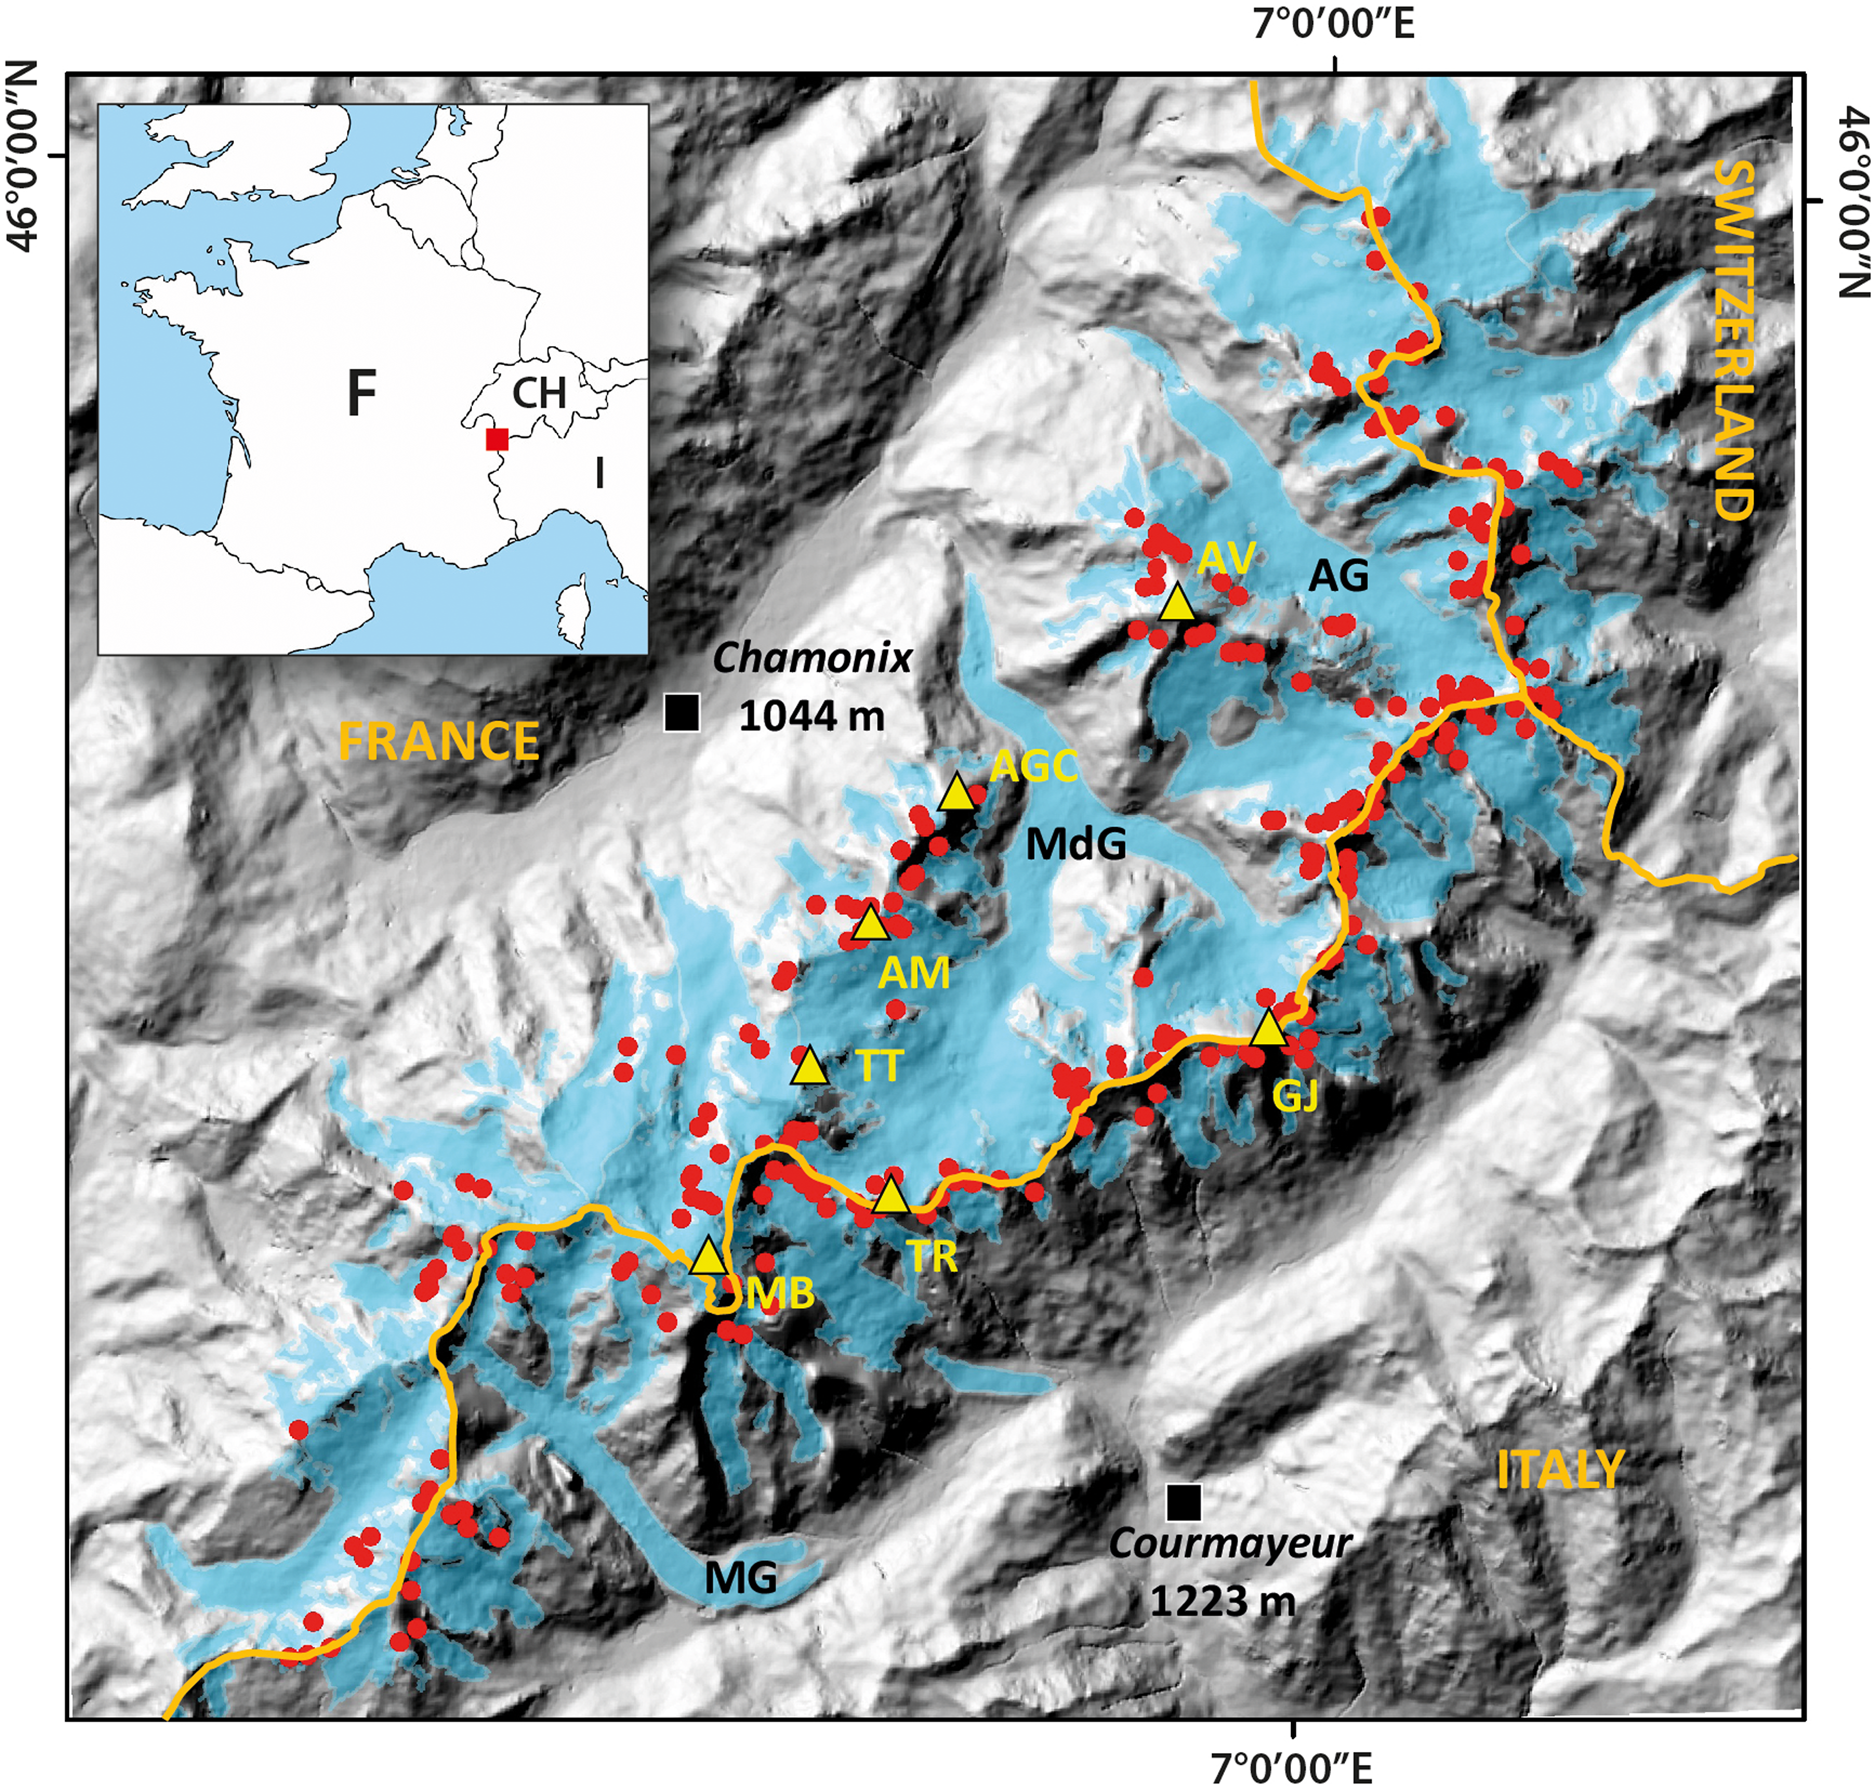
Fig. 3. IAs of the MBM (background: ASTER DEM). In blue: glacier outlines (2019); red dots: IAs; yellow triangles: summits. MB: Mont Blanc (4808 m a.s.l.); AM: Aiguille du Midi (3842 m); TT: Triangle du Tacul (3970 m); TR: Tour Ronde (3792 m; sampling site for dating); AGC: Aiguille des Grands Charmoz (3445 m); GJ: Grandes Jorasses (4208 m); AV: Aiguille Verte (4122 m); MG: Miage Glacier; MdG: Mer de Glace; AG: Argentière Glacier. Elevations are in m a.s.l.; yellow line: national boundaries.
Excluding small (typically <0.5 km2) ice masses such as IAs, ~30% (155 km2) of the MBM area is covered by 94 glaciers including 12 with a surface area >5 km2 (Gardent and others, Reference Gardent, Rabatel, Dedieu and Deline2014; Berthier and others, Reference Berthier, Cabot, Vincent and Six2016; see Fig. 3). The accumulation zone of some of these glaciers exceeds 4000 m a.s.l., and their related fronts can reach down to ~1500 m a.s.l. The flow of the MBM glaciers has been the subject of numerous in situ or remotely sensed velocity measurements (e.g. Gagliardini and Meyssonnier, Reference Gagliardini and Meyssonnier1997; Berthier and others, Reference Berthier2005; Fallourd and others, Reference Fallourd2011) in order to better characterize the dynamics of warm- and cold-based glaciers (Pourchet and others, Reference Pourchet, Debonnet, Preiss and Vincent1998; Suter and Hoelzle, Reference Suter and Hoelzle2002), with particular emphasis on hazard assessment (e.g. Le Meur and Vincent, Reference Le Meur and Vincent2006; Margreth and others, Reference Margreth2011; Dematteis and others, Reference Dematteis, Giordan, Troilo, Wrzesniak and Godone2021). Glaciological field measurements are performed routinely on several glaciers, including the Mer de Glace and Argentière Glacier (e.g. Six and Vincent, Reference Six and Vincent2014). This massif has also proved appropriate for evaluating new remote-sensing techniques (e.g. Berthier and others, Reference Berthier2005, Reference Berthier2014). The recent decline of the MBM glaciers has been abundantly quantified from field data (e.g. Vallon and others, Reference Vallon, Vincent and Reynaud1998; Vincent, Reference Vincent2002; Vincent and others, Reference Vincent, Soruco, Six and Le Meur2009) and remote-sensing methods (e.g. Vernier and others, Reference Vernier2011; Berthier and others, Reference Berthier2014; Gardent and others, Reference Gardent, Rabatel, Dedieu and Deline2014; Dehecq and others, Reference Dehecq2016; Réveillet and others, Reference Réveillet2021) but very few studies have focused on IAs.
3. Characteristics of current ice aprons
IAs are small, but they are likely to settle in many areas as long as the snow can accumulate and be preserved enough to form ice. Given the slope of the IAs which is unfavourable to thick accumulations of snow, it should be noted that the formation of ice does not occur by compressive firnification metamorphosis but more likely by refreezing of meltwater in snow in the same way as superimposed ice in perennial ice patches (Davesne and others, Reference Davesne, Fortier and Domine2022). The study of Kaushik and others (Reference Kaushik, Ravanel, Magnin, Trouvé and Yan2022a) carried out at the scale of the whole MBM made it possible to specify the spatial distribution of IAs, resulting in a better understanding of their location within the high-mountain slopes as well as their relations with the other types of glaciers.
3.1. Distribution of ice aprons
A combination of very high-spatial resolution images like the orthophotos available from www.geoportail.gouv.fr (0.4 m resolution), panchromatic images from SPOT 6 (1.5 m resolution) and the high-resolution images available from Google Earth were accurately used in order to manually digitize IAs in the MBM under a GIS environment (Kaushik and others, Reference Kaushik2021, Reference Kaushik, Ravanel, Magnin, Trouvé and Yan2022a). Since IAs have a slope >40° (slope angle regularly used as a minimum value to define rock walls), they might be confused with avalanching glaciers but they do not have a vertical front from which blocks of ice (‘séracs’) break off, nor do they have crevasses. The upper boundary of an IA is generally indicated by the ice–rock transition. The lower boundary is either marked by such an ice–rock transition (when IA is located within a rock face) or by a bergschrund (when the IA stands on top of a glacier of a different type; see Schweizer, Reference Schweizer1988) (see e.g. Fig. 9), i.e. a crevasse that forms between the relatively stable IAs and the more mobile glacier downstream.
A total of 423 IAs were identified by Kaushik and others (Reference Kaushik, Ravanel, Magnin, Trouvé and Yan2022a) (Fig. 3), corresponding to a total of 4.21 km2 which is ~0.8% of the massif surface area and ~2.6% of the total surface area covered by ice (162.4 km2 according to Kaushik and others, Reference Kaushik, Ravanel, Magnin, Trouvé and Yan2022a). Regarding the surface area of IAs, the statement of Guillet and Ravanel (Reference Guillet and Ravanel2020) defining IA <0.1 km2 is confirmed since the values in the MMB are from 0.001 to 0.05 km2. This upper limit does not seem restricted to the MMB since very large IAs like the main one on the Shivling north face (6543 m a.s.l.; Garhwal Himalaya, India; Fig. 1f) or on the west face of Tocllaraju (6034 m a.s.l.; Cordillera Blanca, Peruvian Andes; Fig. 1g) have a surface area ~0.1 km2. Problems associated with the lack of coverage over the entire MBM, presence of cloud cover, illumination and shadow area issues, which make visual interpretation difficult and the presence of seasonal snow cover were all overcome using images acquired through different modes (Kaushik and others, Reference Kaushik, Ravanel, Magnin, Trouvé and Yan2022a).
According to the same authors, 87.5% of IAs are located above 3100 m a.s.l. (Fig. 4a), i.e. above the regional equilibrium line altitude (Rabatel and others, Reference Rabatel, Letréguilly, Dedieu and Eckert2013). The lowest ice bodies are generally located at the foot of cold north faces. IAs are present in all orientations (Fig. 4b) with a maximum on northwest faces (19.4%), then north (16.3%) and, counter-intuitively, south (14.4%), where the IAs are located at higher altitude than the north-facing IAs. In total, 58% of the IAs have a slope angle between 50° and 65° (Fig. 4c) like IAs of Triangle du Tacul, Tour Ronde or Grandes Jorasses. For some, slopes are >75°. Comparable work outside the MBM and the alps is necessary to validate and complete the results of this first regional survey, in particular to verify the relative part of IAs within the ice-covered areas.

Fig. 4. Topographical characteristics of IAs in the MBM (Kaushik and others, Reference Kaushik2021, modified): (a) elevation; (b) aspect and (c) slope angle; values correspond to the number of IAs. The analysis was performed using ASTER global DEM available at 25 m resolution.
3.2. Four types of occurrence of ice aprons
To better understand the location of IAs on rock walls and their spatial relationships with glaciers, four types of IA formation contexts can be observed in the MBM based on the survey of Kaushik and others (Reference Kaushik, Ravanel, Magnin, Trouvé and Yan2022a):
(1) type 1 is ‘long-standing exposed’ IAs ((1) in Fig. 1), i.e. IAs having continuously existed independently of any glacier outside ice ages; they are overall receding (Section 4.1);
(2) the retreat of glacier bodies releases IAs possibly previously buried under the ice (type 2), including at very high altitudes (Fig. 1b); for example, retreat of valley or slope glaciers frees sectors at the foot of steep back-walls ((2) in Figs 1b, c), or lateral rock slopes on which ice remains ((2) in Fig. 1d);
(3) type 3 corresponds to an evolution of what Galibert (Reference Galibert1965) called ‘north faces with quasi-continuous snow/ice shells’: these pretty steep slopes that used to be snow-covered all year long become steeper as the snow and then the ice melt; the surface of the IA is then completely freed from snow, temporarily or permanently ((3) in Fig. 1);
(4) type 4 corresponds to IAs that overlook hanging, slope or cirque glaciers; these IAs tend to lose their snow cover; it often allows the distinction between steep IAs ((4) in Figs 1b, c) and glaciers, the latter being gentler, snow-covered and whose mobility is shown by crevasses.
4. Evolution of ice aprons at different timescales and related geomorphological effects
Since the 1980s, the glaciers in the alps displayed a general shrinkage (e.g. Paul and others, Reference Paul, Frey and Bris2011; Gardent and others, Reference Gardent, Rabatel, Dedieu and Deline2014) as documented in most mountain ranges worldwide (e.g. Roe and others, Reference Roe, Baker and Herla2017; Hugonnet and others, Reference Hugonnet2021). In this context, the accurate quantification of changes in IAs through surface area reconstruction was needed to better understand IAs/climate relationships. Although some international glacier inventories have existed since the mid-1970s, like the World Glacier Inventory (WGMS, Reference Haeberli, Bösch, Scherler, Østrem and Wallén1989) or the Randolph Glacier Inventory (RGI), no data were available for IAs partly because IAs are not glaciers and therefore not systematically contained in these inventories. First steps have been made in the MBM by Guillet and Ravanel (Reference Guillet and Ravanel2020) and Suvrat and others (Reference Kaushik, Ravanel, Magnin, Yan, Trouve and Cusicanqui2022b) while thickness losses also become significant as indicated by first observations and measurements, affecting the stability of recently deglaciated and permafrost-affected rock walls. The interactions between IAs and permafrost need to be better understood.
4.1. Variations in ice apron surface area since the 19th century
Using oblique historical imagery and a specifically developed photogrammetric inverse perspective method for extracting physical landscape measurements (see Guillet and others, Reference Guillet, Guillet and Ravanel2020), Guillet and Ravanel (Reference Guillet and Ravanel2020) documented the variations in surface area for six IAs from four north-oriented steep rock walls within the MBM since the termination of the LIA (see Fig. 3): one at Triangle du Tacul (3970 m a.s.l.) between 3570 and 3690 m a.s.l. (0.004 km2 in 2018; slope angle: ~59°); two at Tour Ronde (3792 m), 3343–3594 m and 3600–3750 m (0.011 km2 in 2018 and 0.005 km2 in 2012, respectively; both ~55°); two at Grandes Jorasses (4208 m), 3220–3650 m and 3500–4000 m (0.016 km2 in 2016 and 0.028 km2 in 2017, respectively; both ~63°) and one at Aiguille des Grands Charmoz (3445 m), 2907–3185 m (in 2015; 0.0105 km2 in 2012; ~52°).
Shrinkage is documented over all the considered IAs from the end of 1850s to the mid-to-late-1960s (Fig. 5). This period of shrinkage is followed by a short period of IA steadiness or expansion, from the early 1970s to the early 1990s. The Triangle du Tacul IA, for example, gained 11% of surface area between 1966 and 1988. This is certainly due to the significant precipitation and cooler temperatures than today (Auer and others, Reference Auer2007) which allowed alpine glaciers to gain volume (see e.g. Vincent, Reference Vincent2002). Since the beginning of the 21st century, the study confirms the observations of the mountaineers, namely an accelerated shrinkage over all the six IAs. The shrinkage recorded since the termination of the LIA strongly varies between the different IAs. The upper IA of Grandes Jorasses experienced the lowest shrinkage, ~20% of the post-LIA surface area (−7400 ± 200 m2), while other IAs show higher relative losses: 35% for Triangle du Tacul (−1940 ± 158 m2), 40% for the upper IA of Tour Ronde (−3500 ± 147 m2), 50% for the lower one (−1100 ± 127 m2) and 60% for the lower IA of Grandes Jorasses (−28 440 ± 550 m2) (Fig. 5). The most dramatic shrinkage affected the IA of Grands Charmoz, which melted completely during the summer of 2017 (Guillet and Ravanel, Reference Guillet and Ravanel2020).

Fig. 5. Variations of surface area of six IAs in the MBM since the termination of the LIA (Guillet and Ravanel, Reference Guillet and Ravanel2020). Error bars represent the 95% confidence interval. Elevations are in m a.s.l.
Using very high-resolution optical images, Kaushik and others (Reference Kaushik2021) have quantified the surface area of the IAs in the MBM for 2012 (Pleiades 1B PAN and ortho-images IGN – Institut national de l'information géographique et forestière) and 2019 (Pleiades 1B PAN and Sentinel-2). Although manual mapping procedures are time-consuming, they enabled to map outlines of surface ice with the highest precision, an operation which remains difficult with automatic mapping, especially for very small snow/ice features (e.g. Paul and others, Reference Paul2013). The work has recently been completed by Kaushik and others (Reference Kaushik2022b) by including the years 1952 and 2001 from ortho-images IGN. The total surface area of IAs in 1952 was 7.93 km2 and then dropped to 5.91 km2 in 2001, 4.92 km2 in 2012 and 4.21 km2 in 2019 (Fig. 6). From 1952 to 2019, IAs have lost ~47% of their surface area, corresponding to an average rate of surface area loss of 0.78 km2 decade−1. The area loss was 25.4% from 1952 to 2001 compared to 30.6% from 2001 to 2019 (Fig. 6).

Fig. 6. Evolution of the total surface areas of IAs in the MBM over seven decades.
4.2. Significant recent changes in ice apron thickness
IAs are small ice masses located in mainly concave topographies (Kaushik and others, Reference Kaushik2022b). The loss of surface is therefore related to the loss of thickness.
Mountaineers have widely experienced this loss through: (1) the disappearance of ice in many climbing routes (Mourey and others, Reference Mourey, Marcuzzi, Ravanel and Pallandre2019) or even on an entire rock wall, as in the cases of the north face of Aiguille des Grands Charmoz in 2017 (see Section 4.1) or the famous niche in the north face of Les Drus (3754 m a.s.l.) of which only a curved rest of ice remained in the most shaded area at the end of the recent hot summers of 2019 and 2022; (2) the emergence of spurs and boulders within IAs that were recently still continuous (e.g. at Triangle du Tacul where a spur appeared in 2003–04 in the centre of the lower IA and where new rocks now appear almost every year; see black dashes in Fig. 8); (3) the disconnection between current IA surfaces and mountaineering equipment used until the very beginning of the 2000s (Mourey and others, Reference Mourey, Perrin-Malterre and Ravanel2020). In the Gabarrou-Marquis route at Triangle du Tacul for example, ~6.2 m of ice had melted in 2020 since the early 2000s when a belay, now inaccessible, was still used on the right rim of the IA (Fig. 7a).

Fig. 7. Two examples of the thickness loss of IAs. (a) Loss of ~6.2 m of ice thickness at the Triangle du Tacul between the beginning of the 2000s, when permanent mountaineering equipment could be reached from the surface of the ice, and 2020. (b1) Left sidewall of the Argentière Glacier in 1952 (IGN orthophoto); (b2) in 2019 (Spot7 image); (b3) part of the IGN topographic map 3630OT Chamonix 1 : 25 000 that indicates (brown contours) the shrinkage of several IAs.
Such ice loss can also be revealed locally when topographic maps are updated. Since 2012, the IGN 3630OT Chamonix map 1: 25 000 (IGN, 2017) contains a new brownish tint corresponding to ‘glacier retreat between 1980 and 2009’ derived from aerial images of 2008 (Fig. 7b). Although not usable for our study given the steepness of the slopes, the new colours suggest the loss of IA area and thickness, confirmed by the comparison of aerial photos (Fig. 7b).
To quantify the IA-wide thickness loss and its spatial variability, we determined the annual mass balance for 2017 using stakes in the lower Triangle du Tacul IA (Fig. 8; aspect: 355° N, surface area: 0.04 km2; slope angle: 59°). Ten 2 m-long fibreglass stakes (1 m in the ice to measure the probable melt and 1 m outside to measure the possible accumulation) were installed on 29 March 2017. They were checked on 25 September 2017 and 16 March 2018. The hot summer of 2017 consistently melted 42–48 cm of ice over the whole IA (excluding the area covered by snow in March 2017 and areas where snow avalanches and boulder falls destroyed the stakes; Fig. 8), i.e. a mean melting of 0.4 ± 0.03 m w.e. No mass gain or loss was detected between September 2017 and March 2018. Thus, we measured over 1 year a significant summer loss and no accumulation. This monitoring and previous observations (Guillet and Ravanel, Reference Guillet and Ravanel2020) suggest that summer melting combined with the absence of accumulation has probably been a fairly general trend since the early 2000s. The efficiency of the summer melting is corroborated by Kaushik and others (Reference Kaushik2022c) who investigated the evolution of the physical backscatter properties and surface changes of IAs by exploiting time series of X- and C-band synthetic aperture radar (SAR) images from PAZ and Sentinel-1 satellites. SAR data indeed provide information about the seasonal behaviour of IAs since physical changes of IA surfaces modify the backscattering of radar waves. The analysis of the temporal variations of the backscatter coefficient illustrates the effects of summer air temperatures on the surface of the IAs with a strong decrease in coefficient values indicating an increase in the liquid water content and thus the melting. Accumulation on IAs is severely hindered by surface topography, as only snowfall occurring within the 0 to −5°C temperature range can accumulate on slopes steeper than 30° (Guillet and Ravanel, Reference Guillet and Ravanel2020; Eidevåg and others, Reference Eidevåg, Thomson, Kallin, Casselgren and Rasmuson2022). With the growing number of summer (Beniston and others, Reference Beniston2004; Zampieri and others, Reference Zampieri2016) and winter (Beniston, Reference Beniston2005; Colucci and others, Reference Colucci, Giorgi and Torma2017) heat waves, such conditions have become rarer while smooth ice surfaces are not conducive to snow deposition under windy conditions. IAs are thus becoming particularly distinguishable (grey ice) in the MBM from other types of less steep and still snow-covered ice masses (see Fig. 1). The evolution of the colour of the IAs and their very high retreat rates over recent period contribute greatly to the darkening of the high-mountain slopes and give rise to fears of numerous disappearances in the near future.
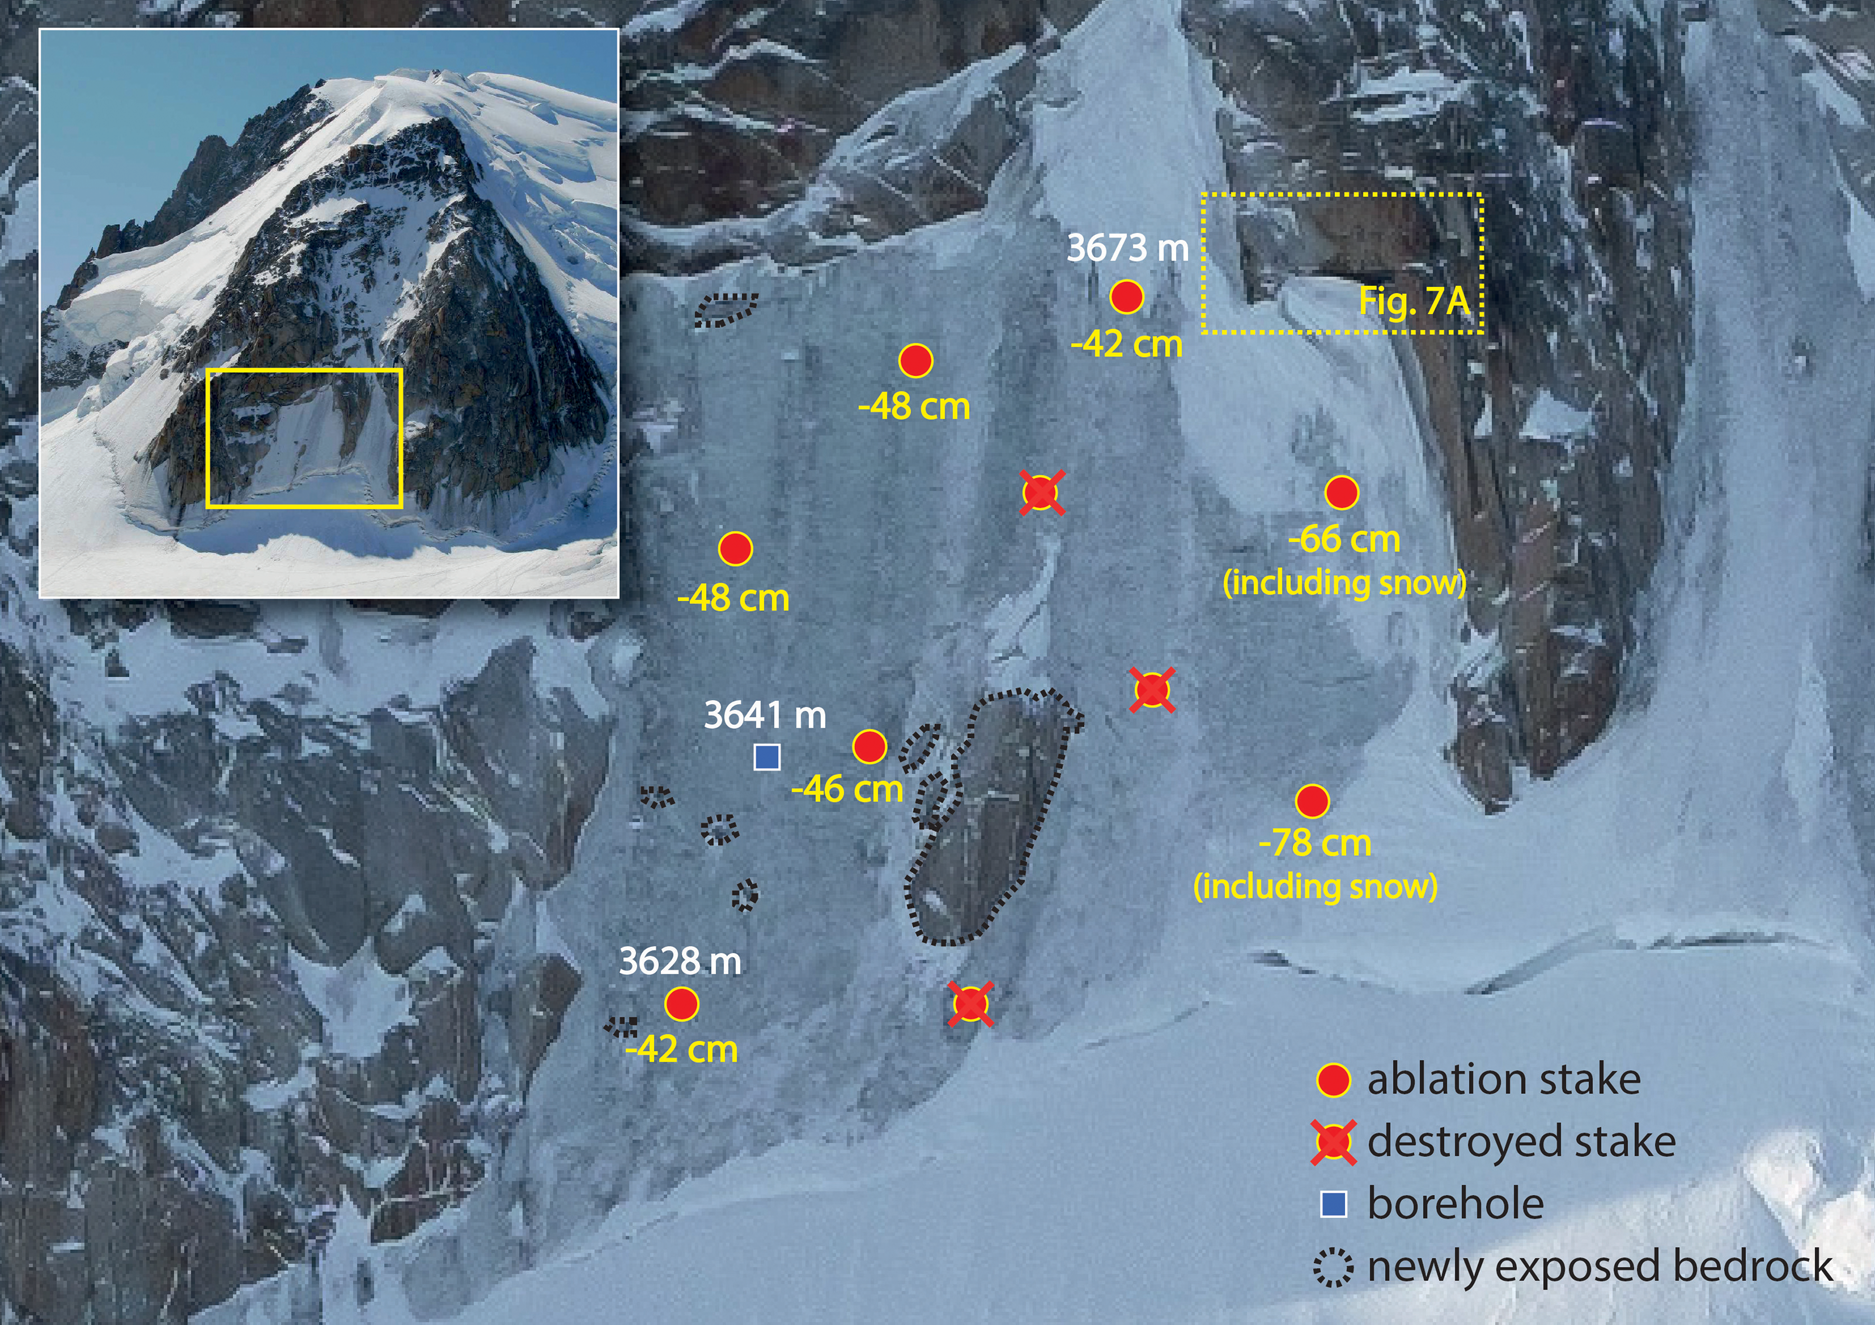
Fig. 8. Effects of a hot summer on the evolution of IAs: the example of the summer 2017 thickness loss in Triangle du Tacul. Elevation in m a.s.l. Outside areas covered with snow in early summer, mass balance was −0.4 ± 0.03 m w.e (only ablation occurred during the year).
4.3. Short-term effects on rock slope stability
Rockfalls >100 m3 have been surveyed in the MBM since 2007 (Ravanel and Deline, Reference Ravanel and Deline2013; Ravanel and others, Reference Ravanel, Magnin and Deline2017a). Over the recent years, many small events have occurred in recently deglaciated areas due to retreat of IAs: following 2015, 2017, 2018, 2019, 2020 and 2022 summer heat waves, rockfall deposits have heavily accumulated at the foot of ice-covered rock walls (Fig. 9). Besides boulders formerly embedded into the ice and released as the ice melts, a high rockfall frequency from the margins of the shrinking IAs is observed. Ice vanishing often exposes perennially frozen and heavily fractured rock that the disappearance of the ice in the form of a cover or joints no longer allows to maintain on the slope (Davies and others, Reference Davies, Hamza and Harris2001; Krautblatter and others, Reference Krautblatter, Funk and Günzel2013; Mamot and others, Reference Mamot, Weber, Schröder and Krautblatter2018; Kenner and others, Reference Kenner, Arenson, Grämiger and Shroder2022). At the scale of larger alpine faces like Monte Rosa east face (4634 m a.s.l., Italian Alps), Fischer and others (Reference Fischer, Eisenbeiss, Kääb, Huggel and Haeberli2011) showed that the sequence of the largest slope failures occurring during the last few decades is spatially connected to disappearing surface ice and further demonstrated the coupling between permafrost-related instability and the condition of adjacent ice masses. The case of the north face of Tour Ronde in 2020 sheds light on this point. An automatic camera was used to monitor the evolution of the face throughout the summer season (Fig. 10). Totally snow covered at the beginning of the summer, the IA underwent notable melting in July and a first rockfall occurred from a recently deglaciated area on 31 July. A second event occurred on 4 August, from an area directly upstream which had still been covered by ice a decade earlier. Later, a third rockfall occurred on 27 August just upstream of the previous one, in an area also covered by ice several decades ago. The two last events exposed massive ice in their scar (Fig. 10), confirming a permafrost context (Cremonese and others, Reference Cremonese2011). This ice suggests a rockfall related to permafrost degradation (e.g. Gruber and Haeberli, Reference Gruber and Haeberli2007; Ravanel and others, Reference Ravanel, Magnin and Deline2017a). A rockfall of ~12 000 m3 (estimation from measurements on a 3-D model acquired by terrestrial LiDAR) finally took place on 13 August 2022 after three long heat waves in the western European Alps (the summer of 2022 was the hottest ever recorded in France and in Chamonix – data Météo France) causing a probably unprecedented IA melting and a very significant heat input for the permafrost. While the melting of IAs likely destabilizes rock volumes almost immediately, the retreat of IAs also implies the development of a new direct air/rock connection in deglaciated areas – for the very first time in several millennia (see Section 6.2) –, generating permafrost degradation (active layer development, i.e. the formation of a sub-surface layer that thaws each year, and a deep and long-term warming from the surface), then triggering rockfalls (see also Haeberli and Gruber, Reference Haeberli, Gruber and Margesin2009; Hartmeyer and others, Reference Hartmeyer2020). The subsurface response of permafrost can be all the faster as the ice gives heat to the surrounding rock while melting (Hasler and others, Reference Hasler, Gruber, Font and Dubois2011). IAs are thus first-order protective layers for permafrost (see e.g. Wegmann and others, Reference Wegmann, Gudmundsson and Haeberli1998) since the thermal conductivity of the rock is much better than that of the ice and a thermal inertia arises from latent heat (Noetzli and others, Reference Noetzli, Gruber, Kohl, Salzmann and Haeberli2007; Harris and others, Reference Harris2009; Hasler and others, Reference Hasler, Gruber, Font and Dubois2011). Heat therefore does not penetrate the ice well. Thus, the temperature variability at ~8 m depth (see Section 5) is much lower under the ice of the Tour Ronde IA than in the rock at the Aiguille du Midi (Magnin and others, Reference Magnin, Deline, Ravanel, Noetzli and Pogliotti2015b) with a rather similar orientation and altitude.
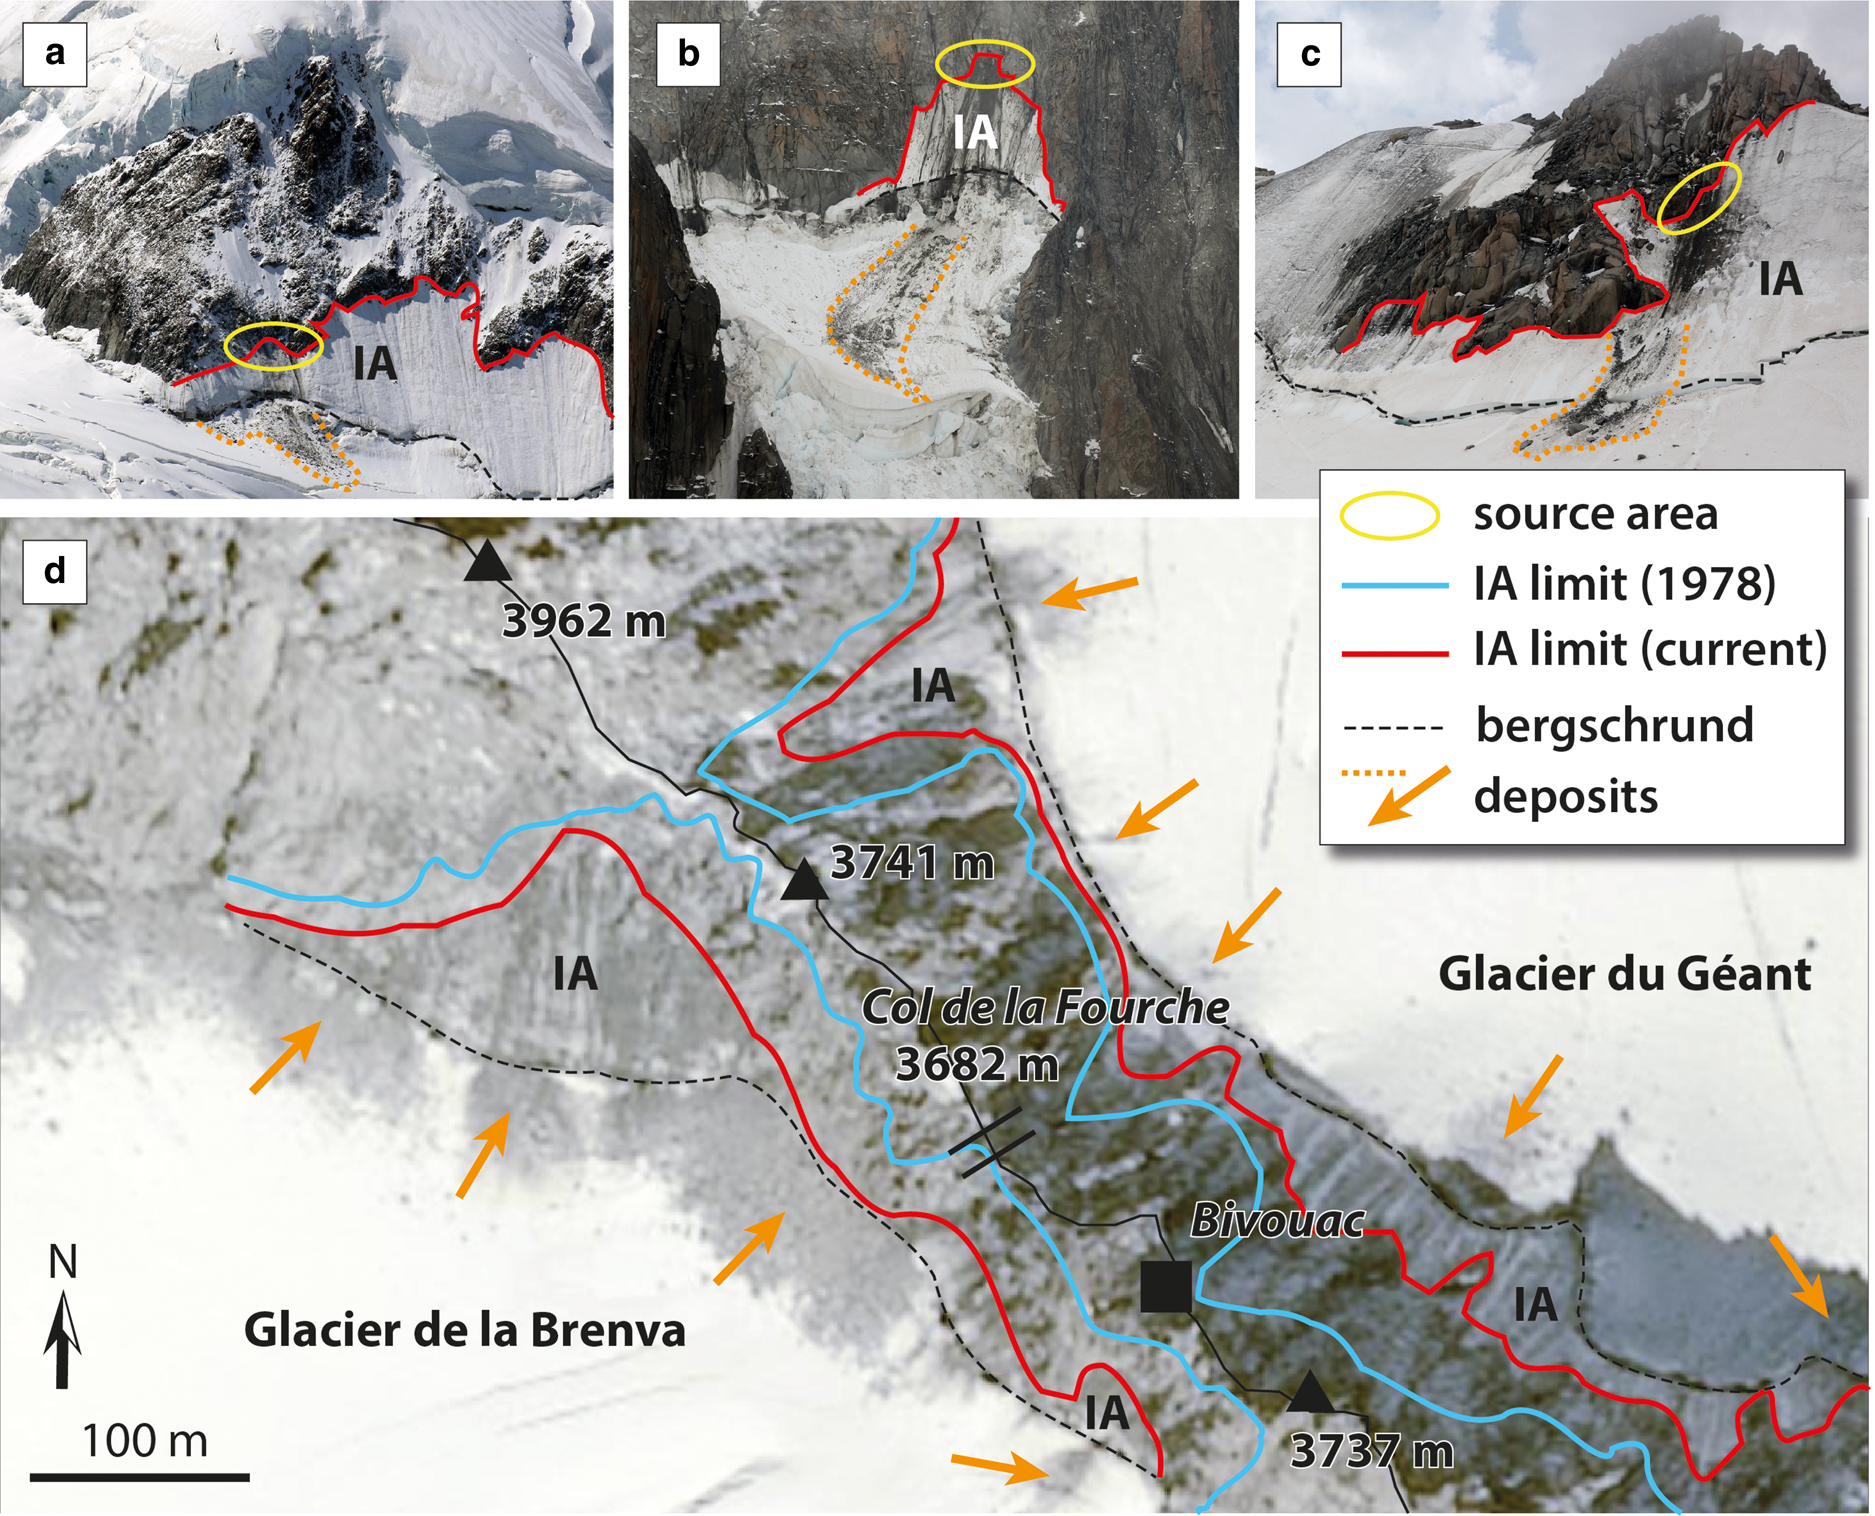
Fig. 9. Rockfall deposits at the foot of: (a) the north face of Rocher du Petit Plateau (3680 m a.s.l.; photo 13 August 2019); (b) the north side of Col du Diable (3770 m; photo 8 August 2018); (c) the north face of Pointe Lachenal (3565 m; photo 13 August 2019) and (d) along the Brenva ridge on the French–Italian border (SPOT6 image, late summer 2018). Areas between the upper limits of the IAs in 1978 (blue) and 2018 (red) are the main source of the rockfalls.
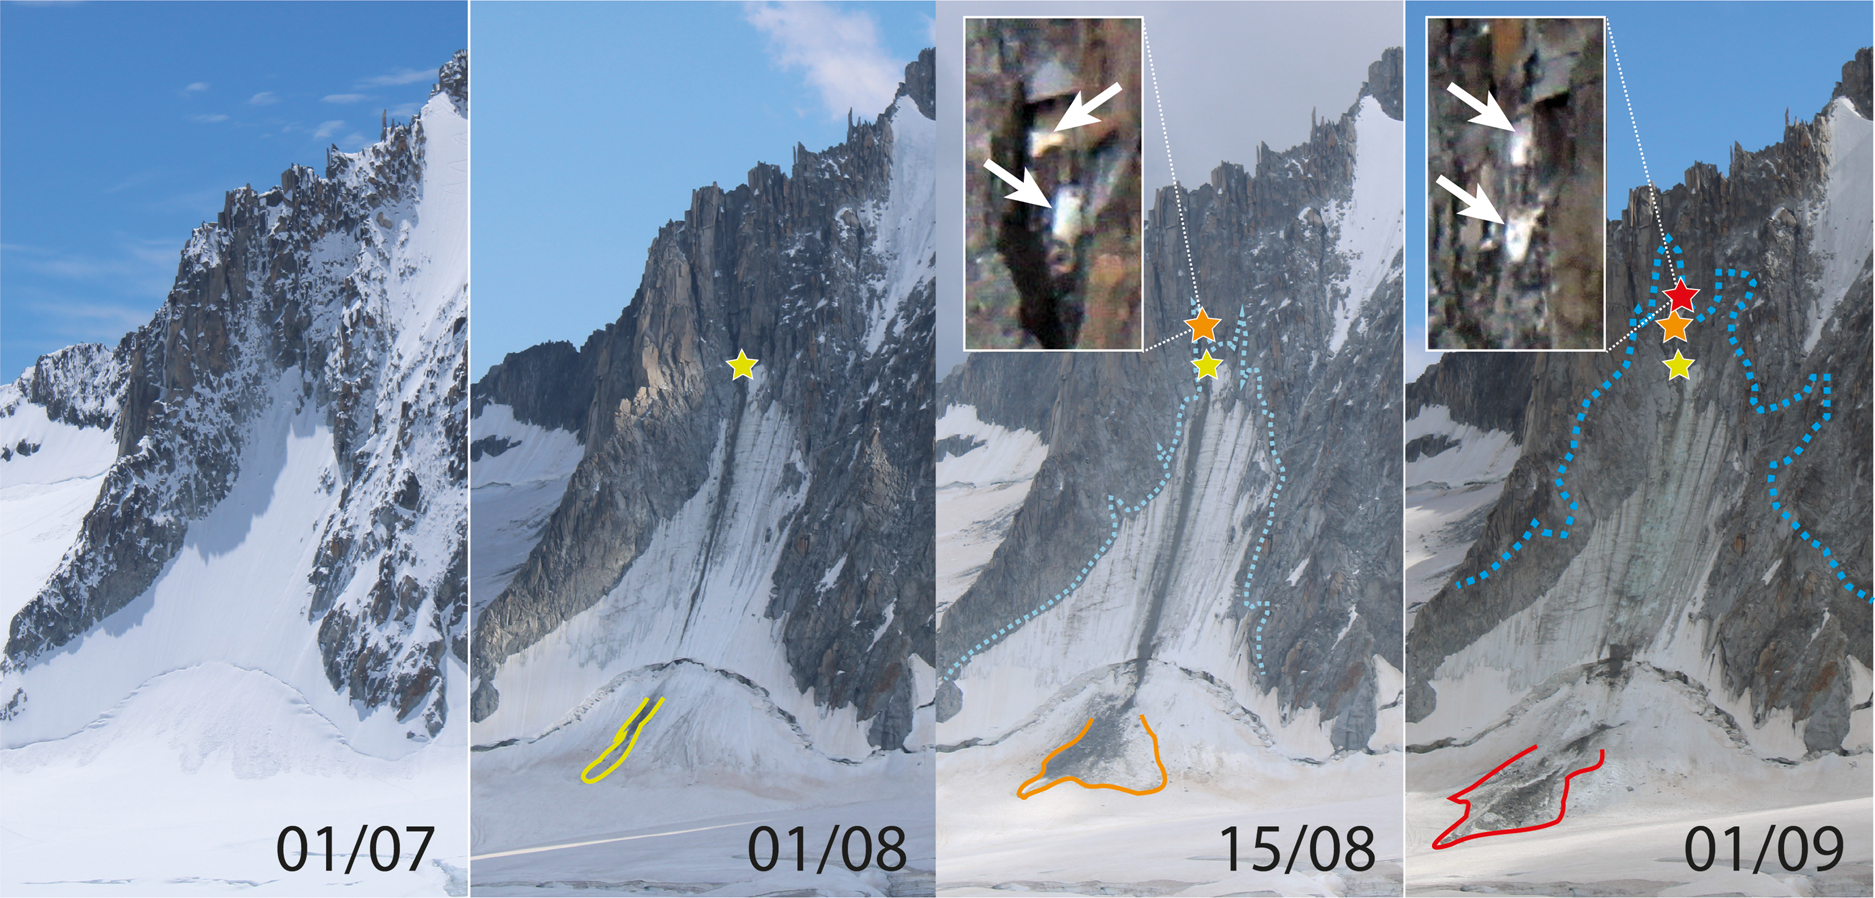
Fig. 10. Evolution of the north face of Tour Ronde during the summer 2020 and in 2022. The lower IA, covered with snow at the beginning of the summer 2020 is almost snow-free at the end. Three rockfalls occurred from the upper limit of the IA: on 31 July and on 4 and 27 August (stars: sources). The last two exposed massive ice (arrows) in their scar. Light blue and blue dashed lines: IA limits in 2009 and the 1880s, respectively. A much larger rockfall finally occurred on 13 August 2022.
5. Ice aprons: cold ice bodies
Given the spatial distribution of alpine permafrost (Boeckli and others, Reference Boeckli, Brenning, Gruber and Noetzli2012; Magnin and others, Reference Magnin, Brenning, Bodin, Deline and Ravanel2015a) and cold-based glaciers (Suter and Hoelzle, Reference Suter and Hoelzle2002; Haeberli and others, Reference Haeberli, Frauenfelder, Kääb and Wagner2004) which are frozen to bedrock (Waller, Reference Waller2001; Faillettaz and others, Reference Faillettaz, Sornette and Funk2011), IAs are interpreted as permafrost evidence (Haeberli and others, Reference Haeberli, Wegmann and Vonder Mühll1997; Gruber and Haeberli, Reference Gruber and Haeberli2007), and it has been assumed that IAs are composed of cold ice (Haeberli, Reference Haeberli1975; Guillet and others, Reference Guillet, Preunkert, Ravanel, Montagnat and Friedrich2021). This thermal state had to be confirmed through recent systematic in situ temperature measurements in boreholes.
5.1. First two boreholes drilled in ice aprons
In high mountains, temperature measurements in boreholes have been used routinely to study the thermal regime of glaciers (Fisher, Reference Fisher1955; Haeberli and others, Reference Haeberli, Schmid and Wagenbach1988, Reference Haeberli, Frauenfelder, Kääb and Wagner2004; Haeberli and Funk, Reference Haeberli and Funk1991; Lüthi and Funk, Reference Lüthi and Funk2001; Suter and others, Reference Suter, Laternser, Haeberli, Frauenfelder and Hoelzle2001; Suter and Hoelzle, Reference Suter and Hoelzle2002; MacDonell and others, Reference MacDonell, Kinnard, Mölg, Nicholson and Abermann2013), rock glaciers (Arenson and others, Reference Arenson, Hoelzle and Springman2002; Haeberli and others, Reference Haeberli2006; PERMOS, Reference Noetzli, Pellet and Staub2019) and rock wall permafrost (Harris and others, Reference Harris2009; Magnin and others, Reference Magnin, Deline, Ravanel, Noetzli and Pogliotti2015b; Pogliotti and others, Reference Pogliotti2015). In the MBM, recent ice temperatures (Vincent and others, Reference Vincent2007a, Reference Vincent2007b) have been compared with older data (Lliboutry and others, Reference Lliboutry, Briat, Creseveur and Pourchet1976; Vincent and others, Reference Vincent2020), while measurements have been carried out at the Tête Rousse and Taconnaz Glaciers because of risks for the valleys (Gilbert and others, Reference Gilbert, Vincent, Wagnon, Thibert and Rabatel2012, Reference Gilbert, Vincent, Gagliardini, Krug and Berthier2015). In order to better understand the thermal regime of IAs and its relationships with the underlying permafrost, two boreholes in IAs were drilled to bedrock and equipped (Figs 11a, b) with a Geoprecision thermistor chain (Dallas DS18S20, accuracy: ±0.25°C, resolution: 0.065°C): on the north face of Tour Ronde (nine sensors up to 880 cm deep, installed in December 2016), and at Triangle du Tacul (four sensors up to 100 cm deep, installed in March 2017) (Ravanel and others, Reference Ravanel2017b). These chains were installed in high-resistance polyurethane (PU) tubes cased in October 2016 in boreholes drilled normal to the ice surface using a portable steam-driven ice drill (Heucke, Reference Heucke2003). Foam pads were inserted between the sensors to prevent heat advection by air. Temperature was recorded every 4 h by a Geoprecision logger (Dallas M-Log5W). Setting up required significant mountaineering skills, but maintenance was even more challenging. At Triangle du Tacul, the summer 2017 heat wave melted almost half of the thickness of the IA (see Section 4.2) at the borehole location, exposing three sensors to free air. At Tour Ronde, the early heat wave of summer 2017 produced rockfalls from the upper margin of the IA that strongly damaged the upper part of the borehole. The following winter, an avalanche destroyed the logger.
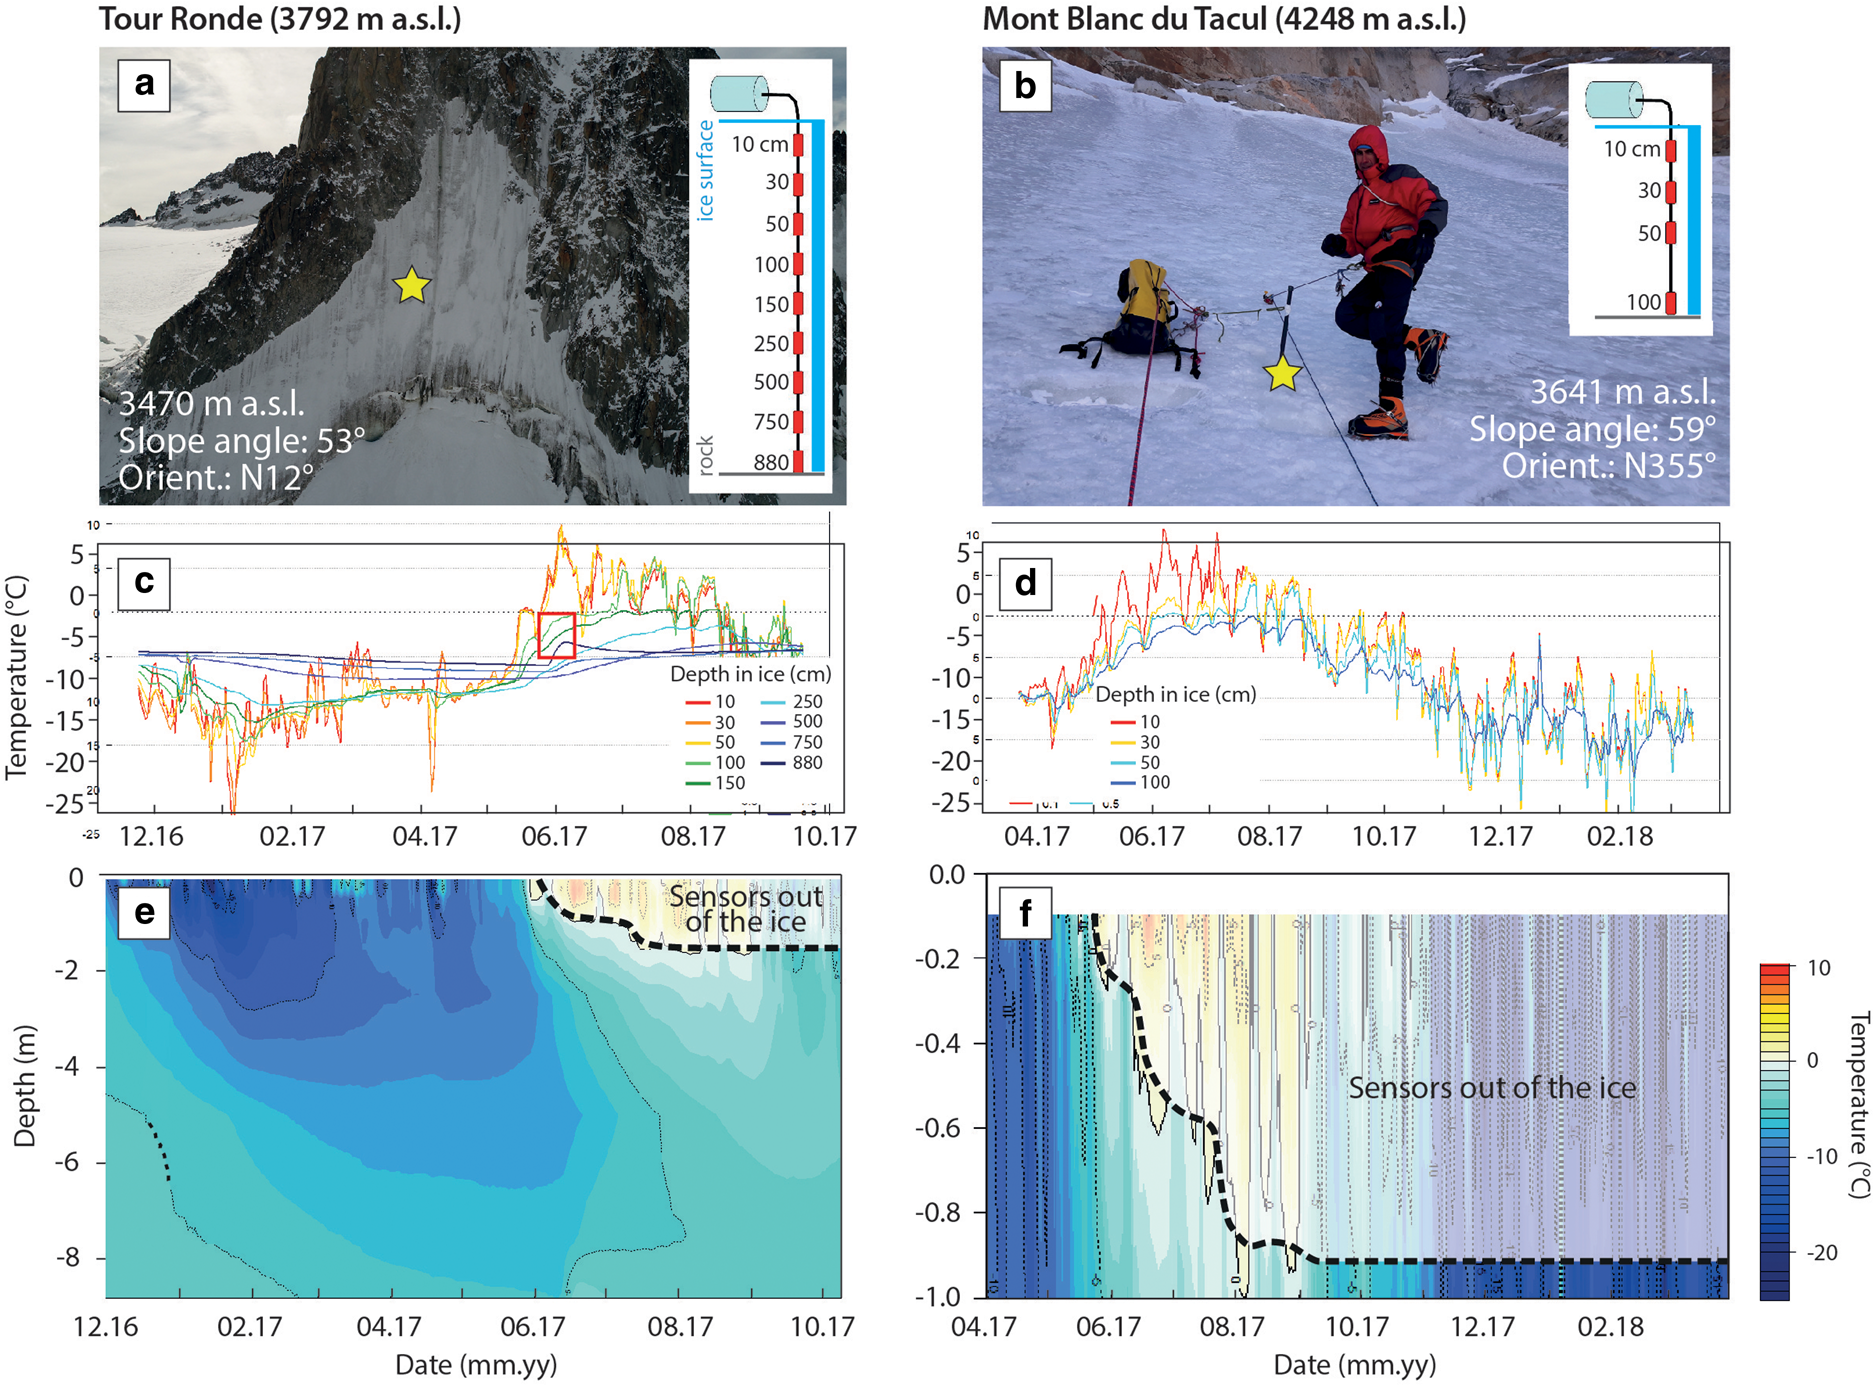
Fig. 11. Thermal regime of two IAs in the MBM. (a, b) borehole location and thermistor chain at Tour Ronde and Triangle du Tacul. (c, d) Tour Ronde and Triangle du Tacul daily temperatures at different depths; at Tour Ronde, the jump in temperature at 8.8 m depth in June 2017 (red box) is certainly linked to liquid water flowing to the bottom of the borehole, following its damage by a rockfall; at Triangle du Tacul, three of the four sensors came out of the ice due to its melting. (e, f) Tour Ronde and Triangle du Tacul modelled daily temperature from surface to 8.8 and 1.0 m deep, respectively.
5.2. Cold ice stuck to the permafrost
At Tour Ronde, we acquired a bit more than 10 months of data (2 December 2016–11 October 2017; Fig. 11c). Near-surface IA temperature is heavily correlated with air temperature, while only seasonal air temperature signal affects ice temperature below 5 m depth. The lowest temperature at 5 m depth is recorded in the early summer (Fig. 11e). From 2 December 2016 to 30 May 2017, sensors at −10, −30 and −50 cm displayed very high variability, with two periods (21 March–13 April; 25 April–24 May) of similar temperatures with reduced variability that suggests the setting of a snow cover (see e.g. Magnin and others, Reference Magnin2017), confirmed by photos automatically taken from the nearby Aiguille du Midi cable-car station. Influx of warm air affects the MBM from the second 10 d period of May, evidenced by the largely positive temperature measured by the 10 cm-deep sensor in the rock on the left margin of the IA, at the borehole altitude. The available heat melted the snow, generating a loss of insulation (see e.g. Magnin and others, Reference Magnin2017), and warmed the exposed ice. This surface change lowered the surface albedo during the time of maximum incoming solar radiation, which at this IA with its exposure of azimuth N12° is especially important during hours of the morning sun. Following 30 May, the three shallowest sensors recorded significant warming of the ice, with temperatures close to the melting point. Between 7 and 12 June, these temperatures became positive as the sensors were exposed to free air. This significant melting was favoured by high air temperature and still the exposure of the IA to direct sunlight. On 15 June, the ice at the level of the sensor −100 cm reached temperature close to the melting point. The sensor seems exposed to free air on 7 July, suggesting a melting of ~1 m of ice between 7 June and 7 July. Initially positioned at −150 cm, the fifth sensor indicated a temperature of 0°C from 8 July but remained buried in the ice (no positive temperature recorded).
The lowest mean temperature (−6.6°C) for the available period was found for the sensor initially located at −250 cm. At the ice–rock interface, the mean 10 month temperature was −4.8°C, confirming the presence of cold permafrost in the rock slope. At this depth (originally −880 cm), the lowest temperature is recorded on 13 June (−6.0°C) while the peak temperature was not yet reached on 11 October 2017 (−4.2°C), when the equipment was damaged. On 2 December 2016, this temperature was −4.4°C, before decreasing: maximum temperature at the base of the IA is therefore likely attained in November. At this depth, a jump in the temperature curve is recorded several days from 12 June 2017 (Fig. 11e), related to a rockfall detected with the Aiguille du Midi camera. It is conceivable that the rockfall damaged the PU tube, allowing liquid water to flow down to the bottom of the borehole, thus temporarily modifying the temperature.
At Triangle du Tacul, temperature was continuously recorded between 1 April 2017 and 31 March 2018 (Fig. 11d). Because of the IA thinness, ice temperature is extremely dependent on air temperature. The sensor at −10 cm recorded significant ice warming from 3 May, leading to its free air exposure on 16 May. The sensor initially at −30 cm indicated ice temperature close to the melting point around 28 May, and was exposed on 12 June. The −50 cm sensor indicated a temperature of 0°C from 12 June, and positive temperature from 16 July, as the mass balance (cf. Section 4.2) indicates a loss of thickness of 46–48 cm near the borehole (Fig. 8). In view of the strong documented ice losses (see Fig. 11f), only the mean annual temperature at the rock–ice interface can be considered: −8.1°C. The annual temperature range is very significant there due to the very thin ice: 0°C on 6 August 2017 (ice temperature almost reaches the melting point during two short periods: 3–5 August and 26 August–3 September), and −20.2°C on 20 February 2018.
These recordings confirm that – outside warm periods during which ice temperature close to the surface can reach 0°C eventually before melting – the IAs are cold ice settled on terrain with negative subsurface temperatures, i.e. stuck to the permafrost-affected bedrock. They are part of the permafrost-related periglacial environment. The basal sliding processes are therefore largely excluded as a consequence of cold-bed conditions, explaining the stability of ice on such steep slopes.
6. Ice aprons: quasi-static millennial ice
There was a fundamental lack of knowledge about the age and dynamics of the ice composing IAs. As the low thickness probably prohibits any significant ice flow, it was believed that the analysis of IA ice structure would bring new insights into dynamics of IAs. Guillet and others (Reference Guillet, Preunkert, Ravanel, Montagnat and Friedrich2021) addressed these points by studying ice cores sampled from Triangle du Tacul. Three 60 cm-long ice cores with a diameter of 5.5 cm were drilled to bedrock close to the borehole (see Fig. 8) in spring 2018 and 2019 using a portable drilling system (see Montagnat and others, Reference Montagnat2010). One ice core was used to study likely lattice preferred orientation of ice crystals in order to highlight potential variations in ice structure with depth. The two remaining ice cores were used for age-dating, also by Guillet and others (Reference Guillet, Preunkert, Ravanel, Montagnat and Friedrich2021).
6.1. Simple shear as the main regime for the deformation of ice-apron ice
To observe lattice preferred orientation, as well as grain shape and size, thin sections were sampled in one of the ice cores, using standard protocols for thin section preparation (see e.g. Schwarz and others, Reference Schwarz1981; Durand and others, Reference Durand2006). Thin sections were typically 4–5 cm wide and 0.4–0.5 cm thick. Guillet and others (Reference Guillet, Preunkert, Ravanel, Montagnat and Friedrich2021) used an Automatic Ice-Texture Analyser (Wilson and others, Reference Wilson, Russell-Head and Sim2003) to measure lattice preferred orientation.
Results from Guillet and others (Reference Guillet, Preunkert, Ravanel, Montagnat and Friedrich2021) are presented on pole diagrams in stereographic projections in Figure 12 and quantify the statistical distribution of c-axis orientations (the optical birefringence axis, normal to the basal plane of the ice crystallographic structure; see: Alley and others, Reference Alley, Gow and Meese1995). Guillet and others (Reference Guillet, Preunkert, Ravanel, Montagnat and Friedrich2021) described c-axis distributions clustered around a single vertical maximum with most grains in the analysed samples oriented parallel to the core axis (reddish colours in Fig. 12). Several tilted grains (greenish colours in Fig. 12) could be observed within the ice core. Guillet and others (Reference Guillet, Preunkert, Ravanel, Montagnat and Friedrich2021) further reported a sharp transition in ice lattice preferred orientation at 5 cm above bedrock, with an increase in the concentration of tilted grains, which they interpreted as resulting from the increase in the concentration of impurities in the ice, preventing effective recrystallization. This phenomenon has been widely observed and described in the scientific literature (see e.g. Thorsteinsson and others, Reference Thorsteinsson, Kipfstuhl and Miller1996; Weiss and others, Reference Weiss2002). Statistical distributions of c-axis orientations in ice have been vastly documented and strong lattice preferred orientation are often attributed to the deformation of ice under simple shear and dynamic recrystallization under glacier conditions (see e.g. Hudleston, Reference Hudleston, Saxena, Bhattacharji, Annersten and Stephansson1977; Hudleston, Reference Hudleston2015). As the ice is deformed in simple shear, the single maximum distribution of c-axis orientations is typically oriented normal to the shear plane. This is reinforced by recrystallization (Journaux and others, Reference Journaux2019). According to Guillet and others (Reference Guillet, Preunkert, Ravanel, Montagnat and Friedrich2021), the single maximum pattern observed in Triangle du Tacul ice likely results from a quasi-stationary shear regime, with a plane parallel to the surface slope of the IA.

Fig. 12. c-Axis lattice preferred orientation pole figures and orientation colour-coded images displaying the c-axis orientations for all the thin sections of the Triangle du Tacul ice core (Guillet and others, Reference Guillet, Preunkert, Ravanel, Montagnat and Friedrich2021). Crossed out sections represent destroyed portions of the ice core. Note that depth representation is not to scale and depths have been rounded to the nearest value. In most pole figures, statistical distributions of c-axis orientations are clustered around a single maximum. Second maxima on section 2 is the consequence of the relative weight of the two greenish crystals in the statistical distribution of the sample. c-Axis orientations on the orientation colour-coded images are given by the colour scale on the top left. The colour code on the pole figures represents the density of c-axis orientations at the pixel scale (1 pixel = 20 μm).
6.2. Ice aprons as a glacial heritage
The above considerations and the significant melt of IAs during the recent decades suggest the outcropping ice to be of millennial age. Considering previous work focusing on the age of alpine glaciers (see e.g. Jenk and others, Reference Jenk2009; Gabrielli and others, Reference Gabrielli2016; Uglietti and others, Reference Uglietti2016; Zipf and others, Reference Zipf, Merchel, Bohleber, Rugel and Scharf2016; Feng and others, Reference Feng2019; Preunkert and others, Reference Preunkert2019a, Reference Preunkert2019b; Bohleber and others, Reference Bohleber, Schwikowski, Stocker-Waldhuber, Fang and Fischer2020), Guillet and others (Reference Guillet, Preunkert, Ravanel, Montagnat and Friedrich2021) expected the age of near-bedrock ice in IAs to be ranging between several hundred and several thousand years. A dating method specific to ice containing no vegetal leftover and suitable for potential ice ages older than a few hundred years was therefore considered. The authors specifically used 14C in particulate organic carbon (POC) associated with a recent sample preparation method successfully applied to near-bedrock ice from cold-based glaciers at high altitude (Hoffmann and others, Reference Hoffmann2018; Preunkert and others, Reference Preunkert2019a) and lower altitude (Bohleber and others, Reference Bohleber, Hoffmann, Kerch, Sold and Fischer2018). They focused on the lower part of the ice cores to avoid potential near-surface age-biasing artefacts, did however omit the lowest few centimetres of the cores to avoid macroscopic impurities – in greater concentration near bedrock (Guillet and others, Reference Guillet, Preunkert, Ravanel, Montagnat and Friedrich2021). Sample preparation (ice decontamination, melting, filtering and combustion) is described by Preunkert and others (Reference Preunkert2019a). POC average concentration of the samples was 330 ± 140 ng C g−1 (Guillet and others, Reference Guillet, Preunkert, Ravanel, Montagnat and Friedrich2021), i.e. 15 times higher than values found in the lowest metres of the neighbouring Col du Dôme Glacier (Preunkert and others, Reference Preunkert2019b), located at 4250 m a.s.l. and 5 km southwest of Triangle du Tacul. This difference was interpreted as resulting from the altitude difference and the presence of biogenic material near the IA during its formation (Guillet and others, Reference Guillet, Preunkert, Ravanel, Montagnat and Friedrich2021). Radiocarbon analyses were performed at the mass spectrometer accelerator at the Curt-Engelhorn Centre Archaeometry (Manheim, Germany). Three ages were obtained: (1) a mean calibrated 14C-age of 2640 ± 130 year cal bp on the 2018 core between 32 and 52 cm depth, averaging the ice age over 20 cm (Guillet and others, Reference Guillet, Preunkert, Ravanel, Montagnat and Friedrich2021), corresponding to Göschener I, a 3000–2300 year bp alpine cold period (Zoller and others, Reference Zoller, Schindler and Röthlisberger1966; Boxleitner and others, Reference Boxleitner2019); (2) 630 ± 55 year cal bp between 30 and 40 cm depth and 2840 ± 175 year cal bp between 40 and 49 cm on the 2019 core (Guillet and others, Reference Guillet, Preunkert, Ravanel, Montagnat and Friedrich2021). Therefore, the mean 2019 sample age is 1735 year cal bp (with a mean high time gradient of 220 years cm−1), i.e. 950 years younger than the 2018 sample. This difference was explained by the authors as resulting from an imperfect overlap of the covered time periods within the two sampling depths of the two cores due to (1) an inhomogeneous spatial accumulation distribution at this IA, affecting the age–depth model, (2) variability of isochronology distance to bedrock due to sub-glacial topography and (3) spatial variability of the ice melt (ablation). Using the age–depth calculation from the 2019 ice core, Guillet and others (Reference Guillet, Preunkert, Ravanel, Montagnat and Friedrich2021) further suggest an age of ~5500 year bp as a first crude estimate of the very near bedrock ice at Triangle du Tacul.
This age is consistent with other ages of basal ice in high-altitude cold-based alpine glaciers: 7000 year cal bp at Alto dell'Ortles (3905 m a.s.l., central alps, Italy) (Gabrielli and others, Reference Gabrielli2016), 5600 year cal bp at Col du Dôme (Preunkert and others, Reference Preunkert2019b) and 5000 year cal bp at Chli Titlis (3030 m a.s.l, central alps, Switzerland) (Bohleber and others, Reference Bohleber, Hoffmann, Kerch, Sold and Fischer2018) while older ages exist as >15 000 cal bp at Colle Gnifetti (4455 m a.s.l., Monte Rosa, Switzerland) (Jenk and others, Reference Jenk2009; Hoffmann and others, Reference Hoffmann2018; see also: Gäggeler and others, Reference Gäggeler, von Gunten, Rössler, Oeschger and Schotterer1983; Lüthi and Funk, Reference Lüthi and Funk2000). Unlike the aforementioned glaciers, where basal ice is located tens of metres below the surface, IAs possibly offer a quick access with appropriate mountaineering skills to thousands of years old ice.
In the coming years, to better appreciate the palaeo-environmental potential of IAs through the establishment of an age model and the detection of chemical tracers of air pollution sources, to model their effects on the underlying permafrost (new borehole temperature measurements and modelling) and to ensure continuous monitoring of thickness variations (LiDAR or glaciological mass balance) is imperative while, in the meantime, strengthening the effort towards the understanding of IA dynamics (rheology, accumulation/ablation and related local factors) in the alps and outside is needed.
7. Conclusions and perspectives
Almost 60 years after first observations in the European Alps, research on IAs has been carried out in the MBM since 2015 with different methodologies and instruments:
• the main topographic characteristics of IAs have been studied via remote sensing;
• the surface of six IAs has been reconstructed since the termination of the LIA from aerial and terrestrial photographs while the surface of all the IAs of the massif was reconstructed from high-resolution aerial and satellite images for four dates between 1952, 2001, 2012 and 2019;
• 10 ablation stakes were used to calculate a first ever IA's mass balance;
• borehole equipped with temperature sensors were drilled in two IAs of different thicknesses (8.8 and 1.0 m) in order to measure the temperature of the ice and at the ice–rock interface;
• an automatic camera allowed us to observe the temporal and spatial relationship between the retreat of an IA and the stability of its rock environment during a summer season;
• three short ice cores were extracted from an IA to document the deformation and age of the ice.
Finally, to the definition ‘very small (generally <0.1 km2) [perennial] ice bodies of more or less irregular outline due to high-ruggedness topographies, lying on steep slopes’ (an arbitrary slope threshold of 40° is commonly used to differentiate IAs from other stationary ice bodies such as permanent snow patches) with a quasi-stationary shear regime (very low ice creep), can be added that they are mainly located above the regional equilibrium line altitude (~3000–3100 m a.s.l. in the MBM region) in permafrost context as illustrated by the mean annual temperatures of ~−5 and −8°C measured at the base of two IAs. The small ice thickness, coupled with this cold context, indeed implies almost near-zero movement of the ice. IAs occupy a very small part of the ice-covered surfaces (4.2 km2 in the MBM, i.e. 2.6% of its total ice surface area) and they are currently not or only slightly fed by snow, while they can lose several tens of centimetres of thickness during a single hot summer. This loss results in a very significant retreat, as shown by the dramatic 50% reduction of IA surface area in the MBM since the 1950s. This shrinkage leads to a darkening of mountain appearance, increasing difficulties for mountaineering and risks of rockfall. This also represents a threat of disappearance of these ice masses that are several hundred to several thousand years old.
The combination of the current IA high retreat rates, the reduction of their albedo accelerating melting, their reduced thicknesses and the acceleration of global warming leads concern with regard to a very large number of IAs disappearing in the short term. At the present rate (Kaushik and others, Reference Kaushik2022b), the IAs in the MMB would lose another half of their surface area within 20 years. IAs thus seem to be among the most vulnerable components of the mountain cryosphere.
Acknowledgements
This research is part of the EU ALCOTRA PrévRisk CC, USMB GPClim and USMB Foundation Explor'Air projects. The authors acknowledge the Chamonix Guides Company and Olivier Greber in particular, the French national ski and mountaineering school (ENSA) and particularly François Pallandre, Philippe Batoux and François Marsigny for the field campaigns. They deeply thank the reviewers Wilfried Haeberli and Max Van Wyk de Vries for their very valuable comments, and the scientific editor Dan Shugar. With this paper, the authors pay tribute to Bruno Wilhelm, researcher and mountaineer, who recently lost his life in the mountains.


 Open access