


Introduction
Since the early 2000s, the literature on transnational regulatory networks (Raustiala Reference Raustiala2002; Slaughter Reference Slaughter2004; Slaughter and Zaring Reference Slaughter and Zaring2006; Berg and Horrall Reference Berg and Horrall2008; Verdier Reference Verdier2009; Zaring Reference Zaring2009; Ahdieh Reference Ahdieh2010; Newman and Zaring Reference Newman and Zaring2013) and on European Regulatory Networks (Eberlein and Grande Reference Eberlein and Newman2005; Coen and Thatcher Reference Coen and Thatcher2008; Kelemen and Tarrant Reference Kelemen and Tarrant2011; Maggetti and Gilardi Reference Maggetti and Gilardi2011; Thatcher Reference Thatcher2011; Van Boetzelaer and Princen Reference Van Boetzelaer and Princen2012; Maggetti Reference Maggetti2013; Blauberger and Rittberger Reference Blauberger and Rittberger2015; Mathieu Reference Mathieu2016) has literally boomed. The pervasiveness of informal networks in policy and politics has fuelled academic investigation about their origins, their functioning and their effectiveness. Comparatively less research has focussed, however, on the inner side of network collaboration. What are the criteria according to which regulators choose whom to network with? In other words, what are the drivers of regulatory networking? This article answers this question by analysing network ties among National Energy Regulatory Authorities from the EU Member States.
The governance literature has converged on the overarching understanding that transnational (or transgovernmental) networks are meant to improve the governance of economic sectors or phenomena, whose reach extends beyond any single country. Within networks, regulators have the opportunity to exchange information and to coordinate their regulatory practices in order to facilitate cross-border trade and investment. These conclusions resonate with the stances of the liberal school of international relations (Keohane and Nye Reference Keohane and Nye1974; Keohane Reference Keohane1998), which has emphasised how increased interdependence motivates transnational cooperation and coordination, leading to the creation of international regimes (Haas Reference Haas1980; Keohane Reference Keohane1982). In this view, regulators network transnationally in order to tackle the challenges of interdependence while reaping the opportunities.
Beyond interdependence, the drivers of regulatory networking have rarely been investigated. Recent explanations have pointed to the importance of autonomy and resources in prompting regulators to network transnationally (Vestlund Reference Vestlund2015; Bach et al. Reference Bach, De Francesco, Maggetti and Ruffing2016). Moreover, existing literature usually employs the word “network” as a useful descriptive metaphor, but rarely studies it as a relational structure (Isett et al. Reference Isett, Mergel, LeRoux, Mischen and Rethemeyer2011). Yet, the real thrust of networks resides in the connections between the nodes forming them. Regulators maintain informal network ties with peers from other countries because they find it worthwhile. Even when semiformal networked organisations (such as European Regulatory Networks) exist, individual regulators are unlikely to maintain regular bilateral ties with each and every one of their peers; more plausibly, they sustain bilateral frequent ties with a subset of peers, reaching out to others more sporadically.
In this article, I investigate the drivers of regulatory networking by analysing the directed network of connections between the 28 National Energy Regulatory Authorities of EU Member States, plus Norway. I develop an Exponential Random Graph Model (ERGM) premised on hypotheses aimed at testing whether the structure of the energy sector (in electricity and gas) at national level holds relevance for explaining the structure of the informal network of the collaboration of European energy regulators. In doing so, I rely on the theoretical link between Varieties of Capitalism (VoC) (Hall and Soskice Reference Hall and Gingerich2001; Hancké et al. Reference Hancké, Rhodes and Thatcher2007) and regulatory arrangements in network industries and hypothesise that regulators network more with peers who oversee similarly organised markets.
The results of the analysis show that regulators are, indeed, homophilous in their tie choices. Namely, this study finds that similarity in the structure of the energy sector across countries is a powerful determinant of network ties for some clusters of regulators. Moreover, the British regulator emerges, all else equal, as considerably more active and influential than its peers, and a divide is observable between regulators from EU-15 countries and others. The results of the model also indicate that more resourceful regulators are both more active and more popular networkers, contradicting the expectation that regulators with lower (budgetary and staff) resources use their informal collaboration network to compensate for this lack by having more outgoing links than their more resourceful peers.
Overall, these results lend support to contributions underlining the importance of expertise-driven policy learning as the driving force behind transnational regulatory networking. Although comembership in EU policy initiatives and transnational flows of electricity and/or gas partially explain network structure, the similarity in energy sector structure is associated with much higher odds of tie existence. However, the homophily effect is strongest for newer Member States, suggesting they form a rather detached clique from the core of the network. If placed in the context of European energy market integration, this result suggests that the establishment of a European Agency for the Cooperation of Energy Regulators (ACER) was probably necessary to compel EU energy regulators to coordinate with and learn from all of their counterparts, as well as to spur convergence across the whole EU.
The determinants of network ties: literature review and hypotheses
The structures of interconnection among a set of nodes can be measured and explained using Social Network Analysis (SNA). The usage of SNA for transnational or national networks of civil servants or other regulatory officials has recently made inroads into the social sciences, as shown by the growing number of contributions employing the technique (Alcañiz Reference Alcañiz2010; Cranmer and Desmarais Reference Cranmer and Desmarais2011; Ingold et al. Reference Ingold, Varone and Stokman2013; Maggetti et al. Reference Maggetti, Ingold and Varone2013; Alcañiz Reference Alcañiz2016a; Boehmke et al. Reference Boehmke, Chyzh and Thies2016; Cranmer et al. Reference Cranmer, Leifeld, McClurg and Rolfe2017; Lazega et al. Reference Lazega, Quintane and Casenaz2017).
Scholars have conceptualised transnational regulatory networks as the functional response to economic interdependence. Networks have been shown to affect rule adoption across countries (Maggetti and Gilardi Reference Maggetti and Gilardi2011; Maggetti and Gilardi Reference Maggetti and Gilardi2014) via a process of regulatory coordination at the supranational level. Sociological perspectives have conceptualised networks as arenas where regulators can exchange information, opinions and experiences, and therefore learn from each other (Majone Reference Majone1997; Humphreys and Simpson Reference Humphreys and Simpson2008; Sabel and Zeitlin Reference Sabel and Zeitlin2008; Bianculli Reference Bianculli2013). In a policy learning perspective, networked cooperation that is sustained over time enables regulators to experiment with the outcomes of their collaboration, to conceive new approaches to old and new problems (Sabel and Zeitlin Reference Sabel and Zeitlin2012).
More recently, the literature has complemented these understandings with perspectives emphasising the importance of domestic determinants for explaining transnational networking (Bach and Newman Reference Bach and Newman2014). In particular, contributors have highlighted the strategic use that regulators make of their networks to achieve more autonomy from the government (Danielsen and Yesilkagit Reference Danielsen and Yesilkagit2014; Ruffing Reference Ruffing2015) by exploiting the informational advantages deriving from transnational networking (Eberlein and Grande Reference Eberlein and Newman2005; Jordana Reference Jordana2017). In addition, regulators appear to pool resources through networking, thereby compensating for those they lack (Alcañiz Reference Alcañiz2010; Vestlund Reference Vestlund2015).
However, the literature has, thus far, overlooked the rationales explaining regulators’ choices regarding their network connections. Regulators maintain informal, bilateral network ties because they find it worthwhile. Presumably, however, resource and time constraints prevent regulators from being able to maintain regular communication with all of their counterparts; more plausibly, they choose their strong ties. Analyses of the motivations for these choices are, however, lacking. Filling this gap requires close-up observation and analysis of the ties that each regulator has within a network, as this would allow for a clearer grasp of the aims of regulatory networking.
In this article, I use original network data gathered through email and phone inquiries from all 28 energy regulatory authorities of EU Member States, plus Norway.Footnote 1 Their self-reported bilateral ties constitute a network structure. The model developed in this article is aimed at explaining that structure. The literature on European Regulatory Networks (key contributions include Coen and Thatcher Reference Coen and Thatcher2008; Eberlein and Newman Reference Eberlein and Grande2008; Kelemen and Tarrant Reference Kelemen and Tarrant2011; Levi-Faur Reference Levi-Faur2011; Maggetti and Gilardi Reference Maggetti and Gilardi2011) and more generally on networks of regulators of network industries has, thus far, scarcely relied on the richness of insight that network theory and network analysis could afford it. In other words, the literature has often used the term “network” without using the methods pertaining to the quantitative analysis of networks.
There are notable exceptions: several contributions have used measurements derived from network analysis in order to quantify the influence and reputation of different bureaucratic and political actors in the Swiss telecommunication sector (Ingold et al. Reference Ingold, Varone and Stokman2013), or the independence and accountability of different regulatory authorities (Maggetti et al. Reference Maggetti, Ingold and Varone2013). Few contributions, however, have investigated the explanatory factors of the relational structure connecting the members of a network. The mere existence of semi-formalised frameworks of cooperation, such as European Regulatory Networks, offers no insight into the drivers of informal bilateral ties among regulators. Yet, the importance of transgovernmental networking for the shaping of EU energy policy, in particular, can hardly be overlooked (Eberlein Reference Eberlein2008; Kaiser Reference Kaiser2009).
Recent contributions have argued that the “VoC” framework holds explanatory power with regard to market and regulatory arrangements in national network industries (Thatcher Reference Thatcher2007; Guardiancich and Guidi Reference Guardiancich and Guidi2016). The VoC framework subdivides countries that are members of the Organization for Economic Cooperation and Development (OECD) according to “the way in which firms resolve the coordination problems they face” (Hall and Soskice Reference Hall and Gingerich2001, 7) in the country where they operate. The two main types of VoC are Coordinated and Liberal Market Economies (CMEs and LMEs). In LMEs, firms predominantly coordinate their activities via markets. In CMEs, firms rely more heavily on relational modes of coordination with other actors in the political economy than on market signals. In Continental Europe, CMEs are the majority. The only European countries classified as LMEs are the United Kingdom (UK) and Ireland (Hall and Gingerich Reference Hall and Soskice2009). CMEs have been further differentiated: Scandinavian countries appear to have a specific type of social-democracy, different from the coordinated economies of Germany (the only pure CME), Austria, Belgium and the Netherlands. Southern European countries (France, Italy, Spain and Portugal) have been defined as “mixed” (or “Mediterranean”) economies (MMEs), where coordination (or lack thereof) coexists with an interventionist and compensating state.
Thatcher (Reference Thatcher2007) studies the interplay between the VoC framework and regulatory institutions in network industries in the cases of the UK, France and Germany. He asserts that the EU legislative and regulatory framework for network industries, being premised on the goal to foster market competition in the energy sector through the introduction of private capital, cost-reflective pricing, market transparency and unbundling, essentially dovetails the British (and therefore, LME) paradigm, which emerged from the 1980s privatisation and liberalisation reforms of UK network industries. This choice, according to Thatcher (Reference Thatcher2007), forced all other Member States to converge towards the LME model of regulation of network industries. Indeed, before the EU began legislating on network industries, France and Germany relied on very different arrangements: in France, the state owned or controlled most of the sectoral firms and steered sector development; in Germany, industrial associations performed self-regulatory functions and the state accepted to keep itself at a distance, while retaining a monitoring role. Eventually, France and Germany, like all other Member States, complied with the requirements of European legislation in formal respects, inter alia by setting up regulatory authorities. Closer examination, however, reveals that both countries retained the key features of their distinctive mode of coordination in the informal networks undergirding the sector at the national level (Thatcher Reference Thatcher2007). Thus, in France, the state preserves a key steering role, while in Germany industry continues leading sector development, even though both, at least formally, converged to an LME-type sector organisation.
How does the link between the political economy of a country and its energy sector arrangements translate into the transnational arena of regulatory networking? Does national sector structure affect regulators’ networking choices? I surmise that it does: on the one hand, regulators may seek to establish strong connections with peers dealing with similarly organised markets, as they are more likely to face similar challenges as themselves; on the other, certain national regulators may enjoy more influence than others, prompting their peers to seek them out as frequent interlocutors. Since the EU energy legislation is premised on a market model corresponding to LMEs, one should expect regulators from LMEs to receive more incoming ties as all other Member States slowly converge (or adapt their extant mode of coordination in network industries) to the LME mode of coordination.Footnote 2
In a recent contribution on the European network of broadcasting regulators, Papadopoulos (Reference Papadopoulos2017) emphasises that regulators learn from peers they hold in high esteem and/or who are facing problems perceived as similar, but does not explore this pattern any further. In their study of the European network of patent judges, Lazega et al. find that “It is clear that judges do sort each other in social networks based on their belonging to blocks of countries with similar types of capitalism” (Reference Lazega, Quintane and Casenaz2017, 19). The explanation they provide is that judges from similar VoC probably refer to similar bodies of law. The fact that nodes prefer to connect to nodes that they perceive as being similar to themselves in some theoretically or empirically relevant respect (a pattern called “homophily”) has often emerged as having considerable explanatory power in studies of social networks (McPherson et al. Reference McPherson, Smith-Lovin and Cook2001; Lee et al. Reference Lee, Lee and Feiock2012; Barberá Reference Barberá2015). Both studies also note that, within networks, certain regulators are much more influential than others and are perceived as models by their peers.
The reason why regulators from countries displaying similar energy sector structures are expected to link to peers in similar sector structures is that they are likely to encounter the same bottlenecks in the formulation and implementation of regulatory policy. At the same time, regulators may seek to establish direct networks with peers overseeing markets that they are converging to, in order to learn from their experience and access their expertise, as well as to better foresee potential conflicts of interests in their own context.
My first hypothesis is, therefore, that European energy regulators’ connections are governed by a pattern of homophily (Cranmer and Desmarais Reference Cranmer and Desmarais2011) driven by the similarity in national energy sector structure.
H1: Regulators network more with regulators overseeing similarly organised markets.
My second hypothesis is that the British regulator should be highly sought after by its peers, given that all EU Member States have had to converge, at least partially, towards an LME type of energy sector organisation.
H2: Regulators from LMEs have significantly more incoming ties than their peers.
The literature has frequently pointed to another factor of great importance to regulators, as well as to all administrative organisations, which may affect the likelihood of tie formation: resources (Glachant et al. Reference Glachant, Khalfallah, Perez, Rious and Saguan2013). Alcañiz (Reference Alcañiz2010, Reference Alcañiz2016b) finds that sudden budgetary cuts represent a strong incentive for nuclear experts and regulators to collaborate with their peers in transnational joint projects, in order to accomplish their ongoing technical activities. This suggests that less resourceful regulators may use informal networking to compensate for their lacking resources and should, therefore, display a tendency to have many outgoing ties to their peers. These considerations lead me to formulate my third hypothesis.
H3: Regulatory authorities with lower (budgetary and human) resources are more active networkers (i.e. have significantly more outgoing ties than their peers).
This analysis comprises the full population of European national energy regulatory authorities, including those from Eastern European Member States. However, extant analyses of the link between VoC and regulatory institutions in the EU focus on EU-15 Member States (i.e. the Member States of the EU before the 2004 and subsequent enlargements). Indeed, the original VoC classification by Hall and Soskice (Reference Hall and Gingerich2001) did not include Eastern European countries. Scholars have attempted to categorise newer Member States according to existing or new VoC typologies. Feldmann (Reference Feldmann2006) argues that the Baltic countries are closest to the LME model, and Slovenia to the CME model. However, Hancké et al. (Reference Hancké, Rhodes and Thatcher2007) underline that the new Member States should be considered to be transitioning towards specific models of capitalism and cluster them as Emerging Market Economies. Nölke and Vliegenthart (Reference Nölke and Vliegenthart2009) label the Czech Republic, Hungary, Poland and the Slovak Republic as Dependent Market Economies (DMEs), since their type of capitalism development is based on the provision of capital through foreign direct investment.
Examining the structure of the electricity and gas sectors of different Member States (see details in Table 4 in the Online Appendix), however, reveals partial discrepancies between even the original VoC classification and the energy sector structure of different EU Member States. The most obvious discrepancy concerns the case of Ireland, where the electricity and gas sectors are almost entirely under government control, thus preventing a categorisation of Ireland as an LME. Overall, a neat distinction exists between countries where the transmission and distribution segments are owned and operated by different companies and are separate from generation and retail (only the UK) and countries where companies active in distribution are also active in retail and sometimes in generation too (as in most CMEs).
In the so-called MMEs, the dominance of formerly state-owned incumbents has been restrained through regulation (as in France), mandatory divestment (as in Italy and Greece) or privatisation (as in Portugal and Spain); still, former incumbents have the largest market shares. The energy sector structures of Scandinavian countries also show commonalities, i.e. a good level of competition in both generation and retail (even though state-controlled incumbents are also active in those segments), locally owned distribution systems and state-owned transmission systems. The penetration of foreign capital (mostly from Western European national companies) in the generation, distribution and retail segments of the electricity sector in several Eastern European countries resonates with their classification as DMEs by Nölke and Vliegenthart (Reference Nölke and Vliegenthart2009). Finally, prevalence of direct state ownership and control in all segments of the market is evident in other Eastern European countries, Cyprus, Malta and, as mentioned, Ireland.
In sum, the structure and organisation of the electricity and gas sectors across the EU Member States show considerable differences in the extent of achieved liberalisation and government control. The VoC classification derives from the analysis of national political economies and the institutions underpinning those. The concept captures the dominant mode of coordination in the whole political economy. Although arguably too general to accurately portray similarities and differences across energy sector structures of EU Member States, the VoC framework appears to constitute a useful heuristic to categorise different sectoral arrangements and, therefore, to capture the different circumstances that national regulatory authorities face in their domestic setting. Hence, in the model developed in the empirical section, regulatory authorities (as identified by the name of their country) are classified as per Table 1.
Table 1 Categorisation of European national energy markets
Regulators’ ties choices, however, may hardly be choices at all: geography plays such a dominant role in energy infrastructure as to potentially overshadow any other rationale for informal cooperation, as regulators are bound to communicate often with regulators from neighbouring (or, more precisely, interconnected) countries. Regular communication with neighbours, in turn, may engender stable patterns of exchange of information. In order to assess this effect, rather than geographic contiguity, one should consider the actual direction of the flows of electricity and gas that are transmitted across borders and seas within the EU. Consequently, I include electricity and gas flows, both across land and sea, in the analysis, as their directionality may be strongly determining regulatory interactions.
Furthermore, within the context of the EU, exchange of information is mandated by the existence of a common EU energy regulatory framework that national regulators have to implement at the national level. The declared aim of the EU energy policy is achieving a fully integrated Internal Energy Market (IEM). As an interim step towards the achievement of the IEM, the European Commission has launched the so-called Regional Energy Initiatives for electricity and gas. The Regional Initiatives group regulators into eight regions for electricity and three for gas with the intent of achieving integrated regional markets for both. Frequent interaction in the framework of the Regional Initiatives may have engendered socialisation dynamics leading to trust and thus to the maintenance of ties beyond the official policy framework. I, therefore, include comembership in the Regional Initiatives as a proxy for the relevance of European policy requirements to explain regulators’ informal ties.
Data and method: an ERGM of strong ties among European energy regulators
The literature on transnational regulatory networks, both European and global, has scarcely exploited the power of quantitative network analysis to explain patterns of transnational networking. This is plausibly due to lack of data on the connections that individual regulators maintain. The contributions that use the tools of network analysis usually concern multilevel and multiactor networks of experts around specific issue areas, such as the environment, and usually, rely on data concerning comembership in cooperation initiatives and/or coattendance of certain events. The assumed link between comembership and collaboration, however, is not self-evident, as actors may be members of the same initiative but not collaborate regularly. Very recent contributions in the policy studies literature have resorted to asking network members about their regular and frequent ties to other network members (Fischer et al. Reference Fischer, Ingold and Ivanova2017; Hamilton and Lubell Reference Hamilton and Lubell2017) in order to attempt to capture the essence of coordination. This analysis adopts a similar approach in studying the empirical case of a homogenous network (i.e. comprising one type of actor) of transnational scope: the network of ties linking European energy regulators, as reported by regulators themselves.
I gathered the data used in this article between the second half of 2015 and late 2016. Specifically, I wrote to the Heads of International Affairs departments and to Communication Officers of all EU national energy regulatory authorities. Not all regulatory authorities have dedicated International Affairs offices, but all have staff dedicated to international affairs, such as Communication Officers. I asked these respondents to reply to the following question:Footnote 3 “Think of the individuals you (or somebody at your NRA) exchange information with more often. Which NRAs do they belong to?”. Network analysis is very sensitive to missing data; it is important to possess information on the whole network in order to make accurate analyses. Therefore, I chose to rely on a single question in order to maximise my chances of receiving a reply from all network members. Indeed, I have obtained replies from all European national energy regulatory authorities, bar one. For that missing respondent, I have just considered the nominations of other regulators as reciprocated.
Being aware that the notion of “most frequent” may mean different things to different people, and that regular exchanges of information may include mostly routine exchanges rather than be occasions for learning, I added to my requests an explanatory text specifying to respondents that they should name the peers they get in touch with when they seek advice or an exchange of opinions or suggestions, not just routine exchanges of information. Moreover, I complemented the question with a request to name the regulatory authorities with which they are in contact above and beyond European policy requirements (including participation into the ACER). I guaranteed all respondents anonymity of their identities and their replies.
The resulting network is a “thinned” network (Cranmer and Desmarais Reference Cranmer and Desmarais2011), i.e. a network consisting of only the strong relationships between the nodes. If the ties across European regulators were a valued network (with ties having different weights depending on their importance), the network studied in this article is one of the highly valued ties. I chose to focus on strong ties because energy regulatory cooperation in the EU has a long history, dating back since the late 1990s (Vasconcelos Reference Vasconcelos2005). Moreover, European energy legislation imposes an obligation on European regulators to cooperate within the ACER. Therefore, every European energy regulator is connected to all others. I was specifically interested, however, in the informal bilateral ties that regulators maintain more regularly and frequently.
I set up an ERGM of the network of relations among European energy regulators. ERGMs represent a technique for inferential network analysis where the outcome of interest is a set of relationships (i.e. the ties among the nodes of the network) (Cranmer et al. Reference Cranmer, Leifeld, McClurg and Rolfe2017). ERGMs are generative models: the underlying assumption is that the observed network structure has emerged from an evolutionary process of tie formation over time, which can be explained by the combination of theoretically and empirically relevant variables as well as network dependency structures (Robins et al. Reference Robins, Lewis and Wang2012), such as the tendency for nodes to reciprocate ties, or for triangles to be closed (i.e. the property of transitivity, whereby if node i is connected to j and j is connected to k, there is a higher probability that i and k are also connected). The explanatory variables could be attributes of individual nodes or attributes of dyadic ties. ERGMs assess the probability that the observed network is drawn from the distribution of the network structures that are plausible, given the number of nodes and the network density, and the explanatory variables. The coefficients of the model are to be interpreted as log odds, as in a logit model.
The graph in Figure 1 reports the structure of the relations among European energy regulators. The network appears characterised by a small number of highly connected nodes, a small number of peripheral nodes and a majority of nodes having an intermediate number of connections. Figure 1 shows that two nodes have not been nominated by any of their colleagues as their most frequent contacts (hence have an in-degree of zero). Figure 1 also shows that most of the ties are reciprocal, which validates the data, considering that I did not set a minimum or a maximum number of nominations for regulators. The promise of anonymity concerning respondents’ identities and their replies prevents me from assigning labels to all nodes in the graph.
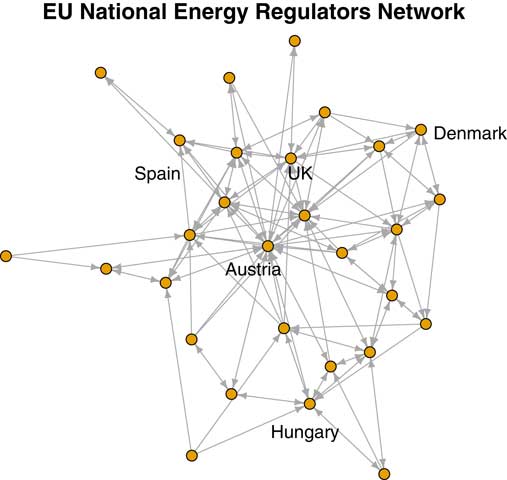
Figure 1 Visualisation of the network.
As mentioned, I expect the ties in this network to depend on both exogenous and endogenous factors. As for the exogenous factors, the hypotheses I developed in the previous section point to homophily, activism and influence, controlling for EU policy requirements, interconnection and flows across borders. I include in the model several endogenous dependencies to account for likely patterns of social interaction that may have contributed to determine the network structure: the density of the network; the reciprocity of ties; and the transitivity of ties. I also include dependencies to account for the centralisation of the network, i.e. to verify whether the network is more centralised around particularly active (i.e. many outgoing ties) or particularly influential (i.e. many incoming ties) nodes than would be expected by chance.
Therefore, the predictors employed in the model include electricityFootnote 4 and gasFootnote 5 flows, over land and sea, across EU Member States (plus Norway); comembership in the European Regional Initiatives for electricity and for gas;Footnote 6 data on each regulatory authority’s budget and staff numbers;Footnote 7 and the above-mentioned categorisation of their energy sector structure. The quantitative data has been standardised before proceeding to the analysis by subtracting the mean and dividing by the standard deviation.
Results of the model
For the sake of clarity, the hypotheses I formulated are listed in Table 2, together with the variables describing them and the factors I use as controls for the effect of interconnection and coparticipation in EU Regional Initiatives.
Table 2 Hypotheses, variables and mechanisms
Note: VoC=Varieties of Capitalism.
The results of the ERGMs are reported in Table 3. I performed the analysis using R package “ergm” (Handcock et al. Reference Handcock, Hunter, Butts, Goodreau, Krivitsky and Morris2017). Coefficients are log odds, that is, after exponentiation, they indicate the probability that an edge exists between two nodes, all else equal, i.e. conditional on the rest of the graph being fixed. Positive and high coefficients indicate higher odds, while negative and high coefficients indicate lower odds of a tie existing between two regulators on the basis of the given parameter. Each explanatory factor was fed into the model according to its expected effectFootnote 8 on the odds of tie existence.
Table 3 Exponential Random Graph Models of the network of European energy regulators
Note:*p<0.1; **p<0.05; ***p<0.01.
Table 3 offers two main takeaways: first, all else equal, regulators do display a tendency to maintain close relationships with peers who oversee similarly structured markets, particularly in the case of regulators from Dependent Energy Markets and from Coordinated Energy Markets; second, the British regulator is more likely to be at the receiving end of a tie than its peers, all else equal. Hypotheses 1 and 2, therefore, are confirmed. The homophily pattern could not be tested in the case of the UK and its liberal market model because it is unique in the data set, hence cannot form homophilous ties. Overall, all regulators are significantly more likely to receive ties than regulators from energy markets that are dependent on foreign investment (i.e. DEMs, the reference category in the models), bar regulators from countries where the electricity and gas sectors are mostly under public ownership and control.
In model 3, budgetary and staff resources are operationalised via a continuous predictor (referring to the year 2013) and appear not to significantly affect the odds of tie existence. To shed more light on the matter, in model 4 I use more recent, categorical data on staff figures released by ACER.Footnote 9 All else equal, regulators with medium staff numbers (i.e. 90–140 full-time equivalent employees) are more likely to be active networkers. Higher budgetary figures are also associated with higher odds of outgoing ties, but the effect is rather weak. These results run partially contrary to Hypothesis 3: regulators with low staff numbers do not tend to send significantly more outgoing ties than regulators with different staff numbers, all else equal. However, the model suggests that regulators with intermediate staff numbers are significantly more likely to have more outgoing ties even compared to authorities with large numbers of staff. This effect may be the manifestation of a compensatory strategy. Given that variables associated with regulators’ resources do not fully explain regulators’ outgoing ties, in model 5 I examine whether sector structure is associated with a higher likelihood of being active networkers. Once again, the British regulator appears, all else equal, more likely to have more outgoing ties than its peers.
Furthermore, the results for endogenous dependencies show that ties are very likely to be reciprocated. The coefficient on the dependency called “shared partners” should be read in conjunction with transitivity. Shared partners indicate the tendency for the nodes in the network to have connections in common, whether they are connected or not. Transitivity indicates whether two regulators that share a strong tie are also more likely to have shared partners than would be expected by chance. Hence, in this network, there is a tendency to have connections in common, which becomes significantly stronger when two regulators are connected. In other words, if two regulators have a connection in common, they have higher odds of being connected by a strong tie, as well. Finally, there are signs that the network is centralised on nodes having high out-degree, i.e. having many outgoing ties, while the parameter for centralisation of the network around highly influential nodes, although positive, fails to achieve significance. This means that regulators cluster around active nodes, but not around influential ones, and suggests that regulators use active nodes to increase their access to information, including their access to influential nodes.
As for the other predictors, the models show that regulators that are members of the same Regional Initiative for Electricity are more likely to be connected and that the direction of the electricity flows across the EU mirrors the directionality of ties across regulators. Gas Regional Initiatives and gas flows never achieve significance. Nevertheless, these effects do not suffice to explain the network structure, which appears even more strongly determined by energy sector structure. The coefficients of the ERGM should be interpreted as log odds of the probability of a tie existing, given the feature investigated. In the network described by model 2, the probability of a tie existing (equivalent to the intercept in a regression) is 0.4%. If there is a mutual tie, the probability becomes 17%. If two nodes are both from what I defined as Coordinated Energy Markets (i.e. from Coordinated Market Economies), the probability jumps to 40%.
I run additional ERGMs in order to check for the possibility that the extent of market liberalisation in each country is the actual explanatory factor for tie homophily and individual regulators’ influence. I operationalised market liberalisation using two different measures: first, by using the market share of the largest electricity generator in each country (Eurostat dataFootnote 10 ); second, I used OECD data on network industries regulation (Koske et al. Reference Koske, Wanner, Bitetti and Barbiero2015) concerning the extent of government ownership in the largest firm active in each of the segments of both the electricity and gas sectors: generation (production or import for gas), transmission, distribution and supply (see Tables 5 and 6 in the Online Appendix for data and models results). None of these variables appears to significantly affect the odds of tie formation; except for the variable indicating government ownership of the largest distribution system operators. This variable shows a significant negative coefficient, which should be interpreted as corroborating the results, emerging in other models, regarding regulators overseeing energy sectors under government direct control. The extent of market liberalisation upstream and downstream (i.e. generation and retail) does not, however, appear to hold explanatory power for regulators’ network ties.
Finally, I rerun the main model (i.e. model 2) using a different categorisation, whereby regulators from Member States that entered the EU in 2004,Footnote 11 2007Footnote 12 and 2013 (Croatia) are clustered as a single “Other” category. Merging the two categories of Dependent Energy Markets and government-controlled ones has the effect of showing the divide between EU-15 and newer Member States even more starkly. However, it prevents an appreciation of the homophily patterns across EU-15 regulators themselves, as the “Other” category outnumbers all other categories: the model results simply confirm that regulators from newer Member States are significantly more likely to network with each other than with the rest of their peers and that EU-15 regulators are much more likely to receive incoming ties than their peers from the “Other” category (results available upon request to the author).
Model fit
The ERGM defines a probability distribution across all networks of the size of the network in the model. If the model is a good fit for the observed data, then networks drawn from this distribution are likely to resemble the observed data. As mentioned, ERGMs are generative models. They represent the process of tie formation from a local perspective. These locally generated processes eventually produce network properties, even if those are not specified in the model. One way to assess the fit of a model, then, is to examine how well it reproduces network properties that are not in it. To assess model fit, I compare the value of several network statistics between the observed network and simulated networks; these are edge-wise shared partner distribution, minimum geodesic distance, in-degree and out-degree. The four plots emerging from the simulation from Model 2 (the preferred model) are reported in Figure 2. Model 2 appears able to capture network structure considerably well, given its parsimonious setup and clarity. The dark lines, corresponding to observed values, fall in the boxplots (simulated values) for nearly all configurations.
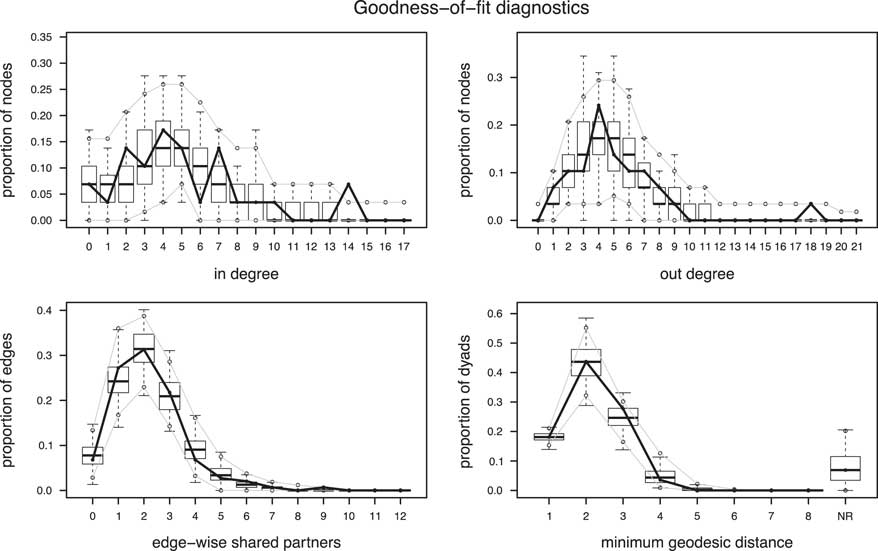
Figure 2 Goodness of fit of model 2: in-degree, out-degree, edge-wise shared partners, minimum geodesic distance.
Discussion of the results
Two main findings emerge from this analysis. First, regulators appear more likely to maintain connections with regulators who oversee similarly organised electricity markets; this is particularly the case for regulators from what I defined Coordinated, Nordic and Dependent Energy Markets. Second, and simultaneously, the regulator from the only LME in the data set (the UK) has much higher odds of receiving ties, given its peripheral geographic location, than its peers. Given that the whole EU energy regulatory framework and relevant legislation are based on an LME-type mode of coordination, this finding can cautiously be interpreted as a manifestation of regulatory convergence. The combination of these two patterns appears to support Thatcher’s (Reference Thatcher2007) analysis, which diagnosed convergence of other VoC towards the LME model, at least in network industries, but at the same time noted the persistence of extant modes of coordination. Regulators from Mixed Energy Markets, where formerly state-owned incumbent retain the bulk of the market share but coexist with smaller new entrants, are the least likely to be homophilous in their tie choices; this suggests that regulators from these economies are not significantly more likely to maintain frequent ties to peers from their same political economy, but rather have a wider range of regular contacts.
Although the coefficients in model 2 are higher for regulators from coordinated and liberal energy markets, all regulators appear significantly more likely to receive incoming ties than regulators in the reference category (DEMs), bar regulators from countries where government ownership and control across the whole energy sector is prevalent. These two categories of regulators, for the most part, belong to newer Member States, which entered the EU after 2004. In short, the models show that, as far as transnational energy regulatory networking is concerned, there is a divide between regulators from EU-15 and regulators from newer Member States.
The coefficients for endogenous dependencies indicate that reciprocity is common in this network, indicating bonding and reciprocal trust among European energy regulators (Berardo and Scholz Reference Berardo and Scholz2010). Transitivity is also a property of this network, as is relatively common in information exchange networks (Fischer et al. Reference Fischer, Ingold and Ivanova2017). Moreover, the model shows that some regulators are more active than others, i.e. have more outgoing ties, causing the network to be centralised on out-degree, even though the coefficient is not always significant across models. These active nodes are plausibly bridging across the network (Berardo and Scholz Reference Berardo and Scholz2010), which would otherwise comprise some isolated nodes.
Overall, the analysis of this network structure appears to tell a story of policy learning driven by expertise as well as by commonality in sector structure and therefore, as per my hypotheses, common challenges. The approach I adopted in developing the model is very conservative: I included several endogenous dependencies to account for ties that exist because of structural properties of the network, rather than homophily; I also included common membership in European Regional Initiatives and electricity and gas cross-border flows in order to test the strength of regulators’ associations against a powerful constraint for network industries, as geography. Furthermore, coordination and collaboration between European energy regulators have a long history, dating from the late 1990s, and are embedded in a very developed and well-formed supranational legislative and regulatory framework. These features show in the network structure, which is overall dense and comprises a single component.
Indeed, that any effect is visible beyond those controls is telling of the strength of the national political economy of the sector as a driver of regulatory networking. As regulators are placed at the interface between their national markets and the European dimension, they build their informal bilateral ties according to both homophily and, arguably, convergence. Interestingly, the British regulator also emerges as significantly more active than its peers in model 5, all else equal. This finding resonates with Thatcher’s (Reference Thatcher2007) remark that British politicians have often complained of the slow progress of liberalisation reforms in the other Member States. In truth, the British regulatory authority has repeatedly expressed concern over the effect that the lower extent of liberalisation in other European markets may have on British consumers and underlined its leading role in the network of European regulators in virtually all of its annual reports to the European Commission, released since 2007.Footnote 13
Model 2 is preferred for its parsimony. Indeed, evidence regarding the importance of resources for explaining network ties is less than conclusive, even though suggestive of interesting patterns. Using categorical instead of continuous data for staff figures, which splits regulators into groups according to the number of their full-time equivalent staff, avoids the collinearity driven by the very high numbers of staff of the British regulatory authority. Results show that regulators with intermediate numbers of staff are most likely to be active networkers, which suggests that regulators with small numbers of staff are somehow unable to cultivate an extended network and that regulators with large numbers of staff are not significantly more likely to have a higher number of ties compared to counterparts. I run other models which indicate homophily among regulators with large numbers of staff (i.e. >170), i.e. regulators with large numbers of staff tend to network with each other. It bears pointing out that, perhaps surprisingly, regulatory authorities with large numbers of staff are not necessarily those from bigger Member States; that subgroup comprises regulators from the UK and Germany, but also from Hungary and the Czech Republic. The energy regulatory authority of a large country like France has between 40 and 90 full-time equivalent staff units, ending up in the medium group. In this case, the impact of resources on the likelihood of tie existence is difficult to discern clearly.
The literature has found that very often policy networks display a core-periphery pattern (Knoke Reference Knoke1990; Carpenter et al. Reference Carpenter, Esterling and Lazer2003), whereby there is a cohesive core of densely connected nodes and a periphery whose members are poorly connected both to the core and among themselves. The intuitive conception of core-periphery structures entails a dense, cohesive core and a sparse, unconnected periphery. Core-periphery structures have been investigated in the literature on networks (Borgatti and Everett Reference Borgatti and Everett2000) as well as in the literature on the European Union (Magone et al. Reference Magone, Laffan and Schweiger2016). In the context of the EU, the same concept has been applied to frame relations between “old” and “new” Member States (Bohle and Greskovits Reference Bohle and Greskovits2012).
Finally, the irrelevance of gas in explaining the patterns of European energy regulators’ networking is a puzzling result of the analysis. Neither gas flows, nor gas regional initiatives appear to have statistical or substantive significance with regard to this network. This may be due to the lower control regulators have in the gas sector and the development of gas markets compared to electricity.
Conclusions
The main question this article sought to answer concerned the drivers of informal regulatory networking at the transnational level. I examined the empirical case of European National Energy Regulatory Authorities, tasked with regulating the electricity and gas sectors within their national borders and simultaneously asked to coordinate in order to bring about regulatory harmonisation and foster market integration across the EU. Far from being straightforward, this task is ridden with difficulties and setbacks given, as the relevant literature has often discussed, that the Member States have different administrative, legal and institutional traditions. This analysis shows that faced with these differences, national regulators capitalise on the similarities between the markets and sectors they oversee in order to fulfil their tasks.
Differences in the structure of the sector are likely and have been shown in this article, to be equally important in affecting regulators’ networking practices, as they seek to fulfil the tasks bestowed upon them.
I hypothesised that regulators would tend to choose counterparts embedded in similarly organised markets as their most frequent and stable network partners. I operationalised this concept by relying on data on the main stakeholders active in the different segments of the electricity and gas markets at the national level, their number and the extent of government ownership of them. I categorised regulators into separate groups by relying on the VoC framework as a heuristic device to conceptualise the specificities of the electricity and gas sectors in the countries considered. I also hypothesised that regulators from LMEs (in this context, the UK) would receive significantly more ties, since the European energy regulatory policy and legislation are shaped according to that mode of coordination. Finally, I expected resources to also matter for regulators’ networking choices, as less resourceful regulators may seek to fill their informational gaps by linking to more resourceful ones.
The results confirm that similarity of sector structure is, indeed, a powerful driver of regulators’ tie choices for most categories of regulators. The hypothesis concerning the influence of a liberal market model is also confirmed and can be interpreted as a sign of ongoing convergence, on the background, however, of persisting dynamics of coordination typical of national political economies, as found in Thatcher (Reference Thatcher2007). The hypothesised link between lower resources and higher network activism failed to clearly emerge from the analysis: however, medium-sized regulatory authorities do appear more likely to be active compared to their more or less endowed counterparts. Moreover, higher budgets are associated with more outgoing ties, suggesting that more resourceful regulators have, indeed, more resources to devote to networking.
The endogenous network dependencies indicate that ties in this network tend to be reciprocal; the effect for this dependency is very strong, representing an important validation of the data, as I did not specify a minimum or a maximum number of nominations to the respondents. Moreover, regulators tend to close triangles, particularly when two nodes are already connected; this testifies to the importance of information exchange relationships in fostering trust among the actors involved. The observed network structure features a handful of regulators having considerably more outgoing ties than their peers; to account for this, I included in the model dependencies accounting for network centralisation around active networkers. The effect is strong, but not consistently significant. The presence of particularly active networkers is, however, important to facilitate exchange among different nodes in the network, particularly those with fewer regular connections.
Overall, regulators from newer EU Member States (i.e. those who entered from 2004 onwards) appear less integrated into the network structure, suggesting a core-periphery pattern. Regulators from Dependent Energy Markets appear as the most strongly homophilous and the least likely to receive incoming ties. Regulators from countries where government ownership and control across all sector segments predominate also emerge as less likely to receive ties than their peers. The presence of scarcely connected nodes in this dense network of regulators suggests that forms of structured cooperation, such as the ACER, are probably necessary in order to achieve regulatory coordination across the EU. Structured cooperation impedes the formation of cliques or disconnected communities of regulatory authorities, and encourages learning and exchange also across widely different institutional contexts.
The purpose of the analysis was grasping the invisible and undocumented drivers of transnational networking; this entails the important limitation of the impossibility of triangulating data with other sources of information. This concern is assuaged by the practitioner knowledge of the persons who kindly agreed, under the promise of anonymity, to respond to my inquiry. Further research may seek to study network evolution over time by relying on longitudinal data, as this may help capturing the engines of phenomena, only cautiously alluded to here, such as convergence (or lack thereof).
The models in this article are cross-sectional; therefore, they do not allow for a full appreciation of regulators’ “historical” ties, i.e. whether their connections followed a path dependent evolution. ERGMs are premised on the notion that the observed network structure emerged as a result of a gradual process of network formation determined by the processes that the model itself attempts to capture. Hence, the results of this model suggest that homophily, influence, reciprocity and transitivity are essential properties of this network. For one, this suggests the copresence of bonding and bridging social capital (Berardo and Scholz Reference Berardo and Scholz2010); in other words, regulators’ ties are driven both by reciprocal trust and by informational needs. Further study of the process of network evolution and change over time, however, is necessary in order to capture the fine-grained mechanisms of long-standing regulatory collaboration.
Supplementary materials
To view supplementary material for this article, please visit https://doi.org/10.1017/S0143814X18000156
Acknowledgements
The author thanks Chris Hanretty and Hussein Kassim for helpful suggestions and comments. The author also thanks the participants to the seminar held at the Centre for Competition Policy (CCP) of the University of East Anglia on 24 February 2017 the participants to the workshop on VoC and Independent Regulatory Authorities (IRAs) held during the ECPR Joint Sessions 2017, the editor and the three anonymous reviewers for their insightful and constructive feedback.


