


Introduction
Current species extinction rates are an estimated 1,000 times over the background rate and are expected to increase with growing anthropogenic pressures worldwide (Barnosky et al. Reference Barnosky, Matzke, Tomiya, Wogan, Swartz, Quental, Marshall, McGuire, Lindsey, Maguire, Mersey and Ferrer2011). Loss of species and wildlife abundance is compromising ecological processes, reducing ecosystem services, and directly affecting humans (Şekercioğlu Reference Şekercioğlu, Sodhi and Ehrlich2010, Cadotte et al. Reference Cadotte, Carscadden and Mirotchnick2011). Tropical biodiversity is generally less studied than temperate biodiversity (Trimble and van Aarde Reference Trimble and van Aarde2012) and the tropics are expected to experience the greatest biodiversity losses in the 21st century (Alroy Reference Alroy2017). Overcoming this trend will require international investment and local community support (Ghosh-Harihar et al. Reference Ghosh-Harihar, An, Athreya, Borthakur, Chanchani, Chetry, Datta, Harihar, Karanth, Mariyam, Mohan, Onial, Ramakrishnan, Robin, Saxena, Shahabuddin, Thatte, Vijay, Wacker, Mathur, Pimm and Price2019). As biodiversity and threats are unevenly distributed, limited research and conservation investments should be strategically targeted to maximize effectiveness (Brooks et al. Reference Brooks, Mittermeier, Fonseca, Gerlach, Hoffman, Lamoreux, Mittermeier, Pilgrim and Rodrigues2006) and to fill threat gaps (Joppa et al. Reference Joppa, O’Connor, Visconti, Smith, Geldmann, Hoffmann, Watson, Butchart, Virah-Sawmy, Halpern, Ahmed, Balmford, Sutherland, Harfoot, Hilton-Taylor, Foden, Minin, Pagad, Genovesi, Hutton and Burgess2016).
As scavengers, vultures constitute the most endangered functional guild of birds and their populations are in severe decline worldwide (Buechley and Şekercioğlu Reference Buechley and Şekercioğlu2016a,Reference Buechley and Şekercioğlub). They are a top conservation priority because they are highly threatened and provide critical ecological functions by quickly consuming carrion, contributing to nutrient cycling and regulation of problematic facultative scavengers (Ogada et al. 2012) and, potentially, controlling disease (Buechley and Şekercioğlu Reference Buechley and Şekercioğlu2016a, Devault et al. Reference Devault, Beasley, Olson, Moleón, Carrete, Margalida, Sánchez-zapata, Sekercioglu, Wenny and Whelan2016, Plaza et al. Reference Plaza, Blanco and Lambertucci2020). Vultures face a range of threats, including most notably, poisoning, toxic veterinary drugs, loss of food availability, and collision and electrocution on energy infrastructure (Buechley and Şekercioğlu Reference Buechley and Şekercioğlu2016a, Botha et al. Reference Botha, Andevski, Bowden, Gudka, Safford, Tavares and Williams2017, Plaza et al. Reference Plaza, Martínez-López and Lambertucci2019). Given their broad distributions, large individual home ranges, and long-distance nomadic and migratory movements, conservation of vultures is challenging (e.g. Runge et al. Reference Runge, Martin, Possingham, Willis and Fuller2014, Reference Runge, Watson, Butchart, Hanson, Possingham and Fuller2015). Prioritizing geographic areas for conservation actions is needed (Mukherjee et al. Reference Mukherjee, Galligan, Prakash, Paudel, Khan, Prakash, Ranade, Shastri, Dave, Donald and Bowden2014, Santangeli et al. Reference Santangeli, Girardello, Buechley, Botha, Minin and Moilanen2019a). Indeed, the recently published Multi-Species Action Plan to Conserve African-Eurasian Vultures (Vulture MSAP), which is based on extensive expert input, provides a roadmap for vulture conservation across Africa and Eurasia, highlighting the need to identify threats and prioritize conservation actions at different spatial scales (Botha et al. Reference Botha, Andevski, Bowden, Gudka, Safford, Tavares and Williams2017).
To identify spatial conservation priorities, it is essential to know the distribution and habitat use of species. Species distribution models (SDMs) are an important tool used to identify priority habitats and to forecast anthropogenic effects on species (Guisan and Thuiller Reference Guisan and Thuiller2005, Aryal et al. Reference Aryal, Shrestha, Ji, Ale, Shrestha, Ingty, Maraseni, Cockfield and Raubenheimer2016). Combined with information on protected areas and existing threats to species, SDMs can help identify conservation priorities (Ferraz et al. Reference Ferraz, De Barros, De Siqueira, Alexandrino, Da Luz and Do Couto2012, Evans et al. Reference Evans, Asner and Goossens2018). However, the accuracy of SDMs is limited by the availability of both occurrence (i.e. where a species occurs) and predictor variables (i.e. spatial layers relevant to model a species’ distribution) (Fletcher Jr et al. Reference Fletcher, Hefley, Robertson, Zuckerberg, McCleery and and Dorazio2018), both of which can be limited in the Global South. Targeted survey data are costly and time consuming, and thus generally scarce. Bio-logging (e.g. GPS tracking) can be used to model species’ distributions (e.g. Coxen et al. Reference Coxen, Frey, Carleton and Collins2017), but can suffer from small sample sizes. Citizen science data (e.g. eBird; Sullivan et al. Reference Sullivan, Aycrigg, Barry, Bonney, Bruns, Cooper, Damoulas, Dhondt, Dietterich, Farnsworth, Fink, Fitzpatrick, Fredericks, Gerbracht, Gomes, Hochachka, Iliff, Lagoze, La Sorte, Merrifield, Morris, Phillips, Reynolds, Rodewald, Rosenberg, Trautmann, Wiggins, Winkler, Wong, Wood, Yu and Kelling2014) are being increasingly used to fill information gaps and have been shown to be useful for modelling bird distributions and population trends (Horns et al. Reference Horns, Adler and Şekercioğlu2018, Fink et al. 2019), but have spatial and observer biases (Fletcher Jr et al. Reference Fletcher, Hefley, Robertson, Zuckerberg, McCleery and and Dorazio2018, Horns et al. Reference Horns, Adler and Şekercioğlu2018, Fink et al. 2019, Neate-Clegg et al. Reference Neate-Clegg, Horns, Adler, Kemahlı Aytekin and Şekercioğlu2020). Combining multiple data sources to model species’ distributions can help increase predictive accuracy and account for sampling biases (Fletcher Jr et al. Reference Fletcher, Hefley, Robertson, Zuckerberg, McCleery and and Dorazio2018, Miller et al. Reference Miller, Pacifici, Sanderlin and Reich2019).
Here we used an SDM framework to identify spatial conservation priorities for vultures in Ethiopia, a high-priority country for vulture conservation (Santangeli et al. Reference Santangeli, Girardello, Buechley, Botha, Minin and Moilanen2019a). Our aims were to: 1) model the distribution of each vulture species; 2) identify vulture conservation priority areas; and 3) assess how well protected vulture priority areas are. We incorporated three independent datasets on vulture occurrence (road-surveys, GPS-tracking, and citizen science) to build robust predictions on vulture space use. Our results provide a framework for where to prioritize conservation work on endangered vultures in the Horn of Africa.
Methods
Study location and species
The study took place in Ethiopia, a biologically diverse and little-studied country, which supports one of the most species rich and abundant vulture communities worldwide (Mundy et al. Reference Mundy, Bunchart, Ledger and Piper1993, Buechley et al. Reference Buechley, Santangeli, Girardello, Neate-Clegg, Oleyar, McClure and Şekercioğlu2019). It is also the second most populous country in Africa and has a high human population growth rate (2.46% per year) (World Bank 2019b). Despite being one of the poorest countries in the world, Ethiopia is developing rapidly (World Bank 2019a), and there is severe pressure on natural ecosystems. Seven vulture species reside in Ethiopia: Bearded Gypaetus barbatus (‘Near Threatened’), Egyptian Neophron percnopterus (‘Endangered’), Hooded Necrosyrtes monachus (‘Critically Endangered’), Lappet-faced Torgos tracheliotos (‘Endangered’), Rüppell’s Gyps rueppelli (‘Critically Endangered’), White-backed Gyps africanus (‘Critically Endangered’), and White-headed Trigonoceps occipitalis (‘Critically Endangered’) (Botha et al. Reference Botha, Andevski, Bowden, Gudka, Safford, Tavares and Williams2017). The largest African populations of Bearded and Egyptian Vultures are thought to occur in Ethiopia (Arkumarev et al. Reference Arkumarev, Dobrev and Abebe2014, Botha et al. Reference Botha, Andevski, Bowden, Gudka, Safford, Tavares and Williams2017).
Species occurrence data
Vulture occurrence data were acquired from three independent sources: road-surveys, satellite telemetry, and citizen science. Road-surveys took place in Ethiopia from 2010 to 2018, whereby two experienced raptor biologists completed 10,857 km of surveys, while driving at speeds <60 km per hour during daylight hours, identifying perched and flying vultures within 1 km of the road. Citizen science observations of vultures were downloaded via the comprehensive eBird Basic Dataset (Sullivan et al. Reference Sullivan, Aycrigg, Barry, Bonney, Bruns, Cooper, Damoulas, Dhondt, Dietterich, Farnsworth, Fink, Fitzpatrick, Fredericks, Gerbracht, Gomes, Hochachka, Iliff, Lagoze, La Sorte, Merrifield, Morris, Phillips, Reynolds, Rodewald, Rosenberg, Trautmann, Wiggins, Winkler, Wong, Wood, Yu and Kelling2014) for Ethiopia, and censored to minimise sampling and observer bias, following specific recommendations and code provided by Johnston et al. (Reference Johnston, Hochachka, Strimas-Mackey, Gutierrez, Robinson, Miller, Auer, Kelling and Fink2019). Satellite tracking data were collected by deploying 34 solar-powered GPS-transmitters on vultures in or ranging through Ethiopia from 2012 to 2018, including 15 Egyptian, eight White-backed, six Hooded, three Ruppell’s, and two Lappet-faced vultures. See Figure S1 in the online supplementary material for an overview of occurrence data. Further details on acquisition and treatment of occurrence data are in Appendix S1.
Each dataset had strengths and weaknesses. For example, road-surveys were designed to have broad geographic coverage and high data quality, but were limited by the extent of the road network and security concerns inhibiting access to some areas. Further, road-surveys took place only during the dry season, and seasonal differences in vulture ranging behaviour has been shown elsewhere in Africa (e.g. Kendall et al. Reference Kendall, Virani, Hopcraft, Bildstein and Rubenstein2014), indicating that these surveys may not have captured each species’ full environmental niche. In contrast, satellite-tracking provided a picture of the habitat use of individual vultures throughout the full annual cycle, but had a limited sample of individuals. Meanwhile, citizen science data had broad geographic and temporal coverage, but were spatially biased towards urban centres and birding “hotspots”, and may have suffered from lower data quality due to potential species misidentification (e.g. Fink et al. 2019). We recognize that each of the data types was therefore capturing different aspects of the species’ ecological niche and at somewhat different spatial and temporal scales, and we see that as a net benefit of our approach. By incorporating multiple data types, we maximized the number of species for which we had sufficient data to model distributions, while also incorporating data that captured different aspects of each species’ environmental niche.
All analyses were completed in R (Version 3.1.0; R Core Team 2019). For eBird data, occurrence points were observations for each species spatially rarefied to a 1-km distance, while the background sample was the location of all complete checklists (Coxen et al. Reference Coxen, Frey, Carleton and Collins2017). For road-survey data, we buffered road transects by 1 km on both sides of the road, overlaid a 1-km2 raster grid over the survey area, and aggregated observations for each species within each pixel, such that any pixel where a given vulture species was sighted was given a value of 1 (occurrence), whereas pixels where that vulture species was not encountered were given a value of 0 (background). For satellite tracking data, we calculated the 95% minimum convex polygon (MCP) cumulative home range (‘adehabitatHR’ package; Clemente Calenge Reference Calenge2011) of all tracked individuals of each species (with one exception: we calculated separate MCPs for two Hooded Vulture populations that did not overlap from transmitter deployments in northern and southern Ethiopia). Tracked vulture locations within each species’ MCP were used as occurrence points, while background points were drawn from a systematic sample of 10,000 evenly spaced points within the MCP for each species (Benson Reference Benson2013).
Environmental variables
We compiled environmental data that were expected to influence vulture use, including habitat type (European Space Agency 2017), elevation and ruggedness (Robinson et al. Reference Robinson, Regetz and Guralnick2014), human footprint (Venter et al. Reference Venter, Sanderson, Magrach, Allan, Beher, Jones, Possingham, Laurance, Wood, Fekete, Levy and Watson2016), climate (annually averaged temperature, precipitation, wind, solar radiation; Fick and Hijmans Reference Fick and Hijmans2017), latitude and longitude. Prior to modelling, we assessed correlation of predictor variables by creating a correlation matrix using ‘corrplot’ (Wei and Simko Reference Wei and Simko2013), and reviewed the variance inflation factors using the ‘usdm’ package (Naimi 2015). We used a cutoff of |r| = 0.60 as an indication of strong co-linearity (Crandall et al. 2015). Elevation and temperature were inversely correlated (|r| = -1) and we thus excluded elevation because temperature was expected to have a more direct biological effect. Wind, precipitation, and longitude were highly correlated with other variables and were removed, leaving us with 12 predictor variables: latitude, ruggedness, human footprint, distance to cropland, distance to desert, distance to forest, distance to grassland, distance to shrubland, distance to urban, categorical landcover class, temperature, and solar radiation (Figure S3). Further details on processing of predictor variables can be found in Appendix S1.
Species distribution models
We modelled the distributions of seven vulture species in Ethiopia using maximum entropy (Maxent; Phillips et al. Reference Phillips, Anderson and Schapire2006). Maxent is the most widely used species distribution modeling technique (Elith et al. Reference Elith, Phillips, Hastie, Dudík, Chee and Yates2011). To maximize the accuracy of Maxent models, it is important to account for sampling bias of occurrence points, to select the appropriate background sample, and to select the best regularization multiplier (Merow et al. Reference Merow, Smith and Silander2013). To address these concerns, we spatially thinned each dataset, carefully selected the background sample, and tested a range of regularization multipliers. Maxent was run using the package ‘ENMeval’ (Muscarella et al. Reference Muscarella, Galante, Soley-Guardia, Boria, Kass, Uriarte and Anderson2014), using “algorithm = ‘maxent.jar’”, which interfaces with the standalone Maxent program (Version 3.4.1; Phillips and Dudík Reference Phillips and Dudík2020). For each data type and species combination, we ran a suite of models with a range of regularization multiplier values (from 1 to 4, by 1) and feature class combinations (L, LQ, H, LQH, LQHP, LQHPT; where L = linear, Q = quadratic, H = hinge, P = product and T = threshold), or up to 24 models each. To assess the predictive capacity of each model, we used k-fold internal cross validation (Merow et al. Reference Merow, Smith and Silander2013) with four folds (we used 75% of the data to train the model and 25% of the data to test the model), using the ‘block’ data partitioning method, which spatially partitions data into four bins by the lines of latitude and longitude that divide occurrence localities as equally as possible. We selected the top model for each species and data type using Akaike information criteria corrected for small sample sizes (AICc) (Burnham and Anderson Reference Burnham and Anderson2004, Muscarella et al. Reference Muscarella, Galante, Soley-Guardia, Boria, Kass, Uriarte and Anderson2014). Predictive accuracy of top models was assessed from the AUCtest score, which measures the model’s ability to discriminate between conditions at occurrence versus background locations (Muscarella et al. Reference Muscarella, Galante, Soley-Guardia, Boria, Kass, Uriarte and Anderson2014). We also report ORMTP, which is the average omission rate of the occurrence records at the minimum training presence (MTP) threshold, where MTP represents an estimate of species habitat suitability (Muscarella et al. Reference Muscarella, Galante, Soley-Guardia, Boria, Kass, Uriarte and Anderson2014, Taylor et al. Reference Taylor, Hafen, Holley, González and Long2020). We deemed models with AUCtest values >0.60 to be informative (Randin et al. Reference Randin, Dirnböck, Dullinger, Zimmermann, Zappa and Guisan2006).
Next, we compared the top predictions for each species and data type, using Hellinger’s I statistic. Hellinger’s I values range from 0 (no overlap) to 1 (complete overlap), quantifying niche overlap over geographic space while making no assumptions about species density (Warren et al. Reference Warren, Glor and Turelli2008).
Then for each species we created an ensemble species distribution model. To do so, we weighted the top species-data type model by its respective AUC test score and then summed them. We mapped the final predicted ensemble distribution of each species across Ethiopia, interpreted as relative habitat suitability (Merow et al. Reference Merow, Smith and Silander2013).
To estimate uncertainty in our predictions, we took 10 bootstrap samples of the training datasets and ran predictions for each species and data type combination on each bootstrapped sample. We then calculated the standard deviation of the predicted values for each species and data type combination and derived an overall map of the uncertainty in the modelled distribution for each species by taking the average of the standard deviation values across each data type.
We identified the core distribution of each species within Ethiopia as the top 30% of its predicted distribution areas. While the 30% threshold is somewhat arbitrary, it follows other recent work prioritizing conservation areas for vultures across the Old World (Santangeli et al. Reference Santangeli, Girardello, Buechley, Botha, Minin and Moilanen2019a). We then calculated overlap of the core distribution with protected areas (PAs; considering IUCN protected area categories I to VI; IUCN and UNE P-WCMC 2018) and Important Bird and Biodiversity Areas (IBAs; BirdLife International 2020).
Identifying priority conservation areas
We combined the final ensemble species distributions for each vulture species to identify priority conservation areas for all vultures in Ethiopia using software Zonation Version 4.0 (Moilanen et al. Reference Moilanen, Pouzols, Meller, Veach, Arponen, Leppänen and Kujala2014). Zonation ranks areas of conservation importance by iteratively removing grid cells starting from those that have the lowest value for conservation. We used the core area cell removal method (CAZ), such that high priority areas include important habitat for each species, i.e. a ‘leave no species behind’ approach, at a 1-km2 pixel resolution (Santangeli et al. Reference Santangeli, Girardello, Buechley, Botha, Minin and Moilanen2019a). In order to assess the robustness of the main priority map, we incorporated the prediction uncertainty layers we created (see above) directly into the prioritization analysis using the distribution discounting tool in Zonation (Moilanen et al., Reference Moilanen, Wintle, Elith and Burgman2006), such that the highest-ranking sites have high conservation value and low uncertainty. We ran the zonation analyses three times, setting the uncertainty parameter to subtract 0, 0.5, and 1 SD, from the nominal estimates of the input layers of analysis. We report on the intermediary output (0.5 SD) in the main text and provide the other outputs in Figure S5. Through the prioritization, all species were given the same weight. An alternative approach could be to weight species according to their global conservation status (e.g. Santangeli et al. Reference Santangeli, Girardello, Buechley, Botha, Di Minin and Moilanen2019). However, we decided to give species equal weight, provided that our exercise was national, and considering that Ethiopia may provide particularly important habitat for some of the less threatened species, particularly Bearded and Egyptian Vultures (Botha et al. Reference Botha, Andevski, Bowden, Gudka, Safford, Tavares and Williams2017). Next, we identified “vulture priority areas” in Ethiopia as the top 30% of the zonation output and calculated the area of overlap and the average priority of each PA and IBA in the country for vulture conservation.
Results
Species distribution models
We produced an ensemble SDM for five of the seven vulture species considered. Ensemble models were based on three data types for Egyptian and Hooded, two data types for Bearded and Rüppell’s, and one data type for White-backed Vulture (Table 1). AUCtest values for models used ranged from 0.606 for the Rüppell’s Vulture road-survey model to 0.928 for the Egyptian Vulture road-survey model (Table 1). Predicted distributions for each species from different data types showed a high level of niche overlap (Hellinger’s I statistic values ranged from 0.759 to 0.973; Table S1), indicating that the different datasets had largely similar predictions of each species’ distribution.
Table 1. Features and evaluation metrics of Maxent distribution models for seven vulture species in Ethiopia based on up to three data types. AUCtest measures the model’s ability to discriminate between conditions at test versus background locations, while ORMTP measures model overfitting (see text for details). For eBird and road-survey models, n refers to the number of observations, whereas for telemetry models n refers to the number of tracked individuals. Models with AUCtest <0.6, shaded in grey, were deemed uninformative and excluded from further analyses. Models were not run for species lacking a sufficient sample size (<20 records for eBird or road-surveys, or <5 individuals for telemetry) and thus their values are NAs, but are included here to show sample size (n).
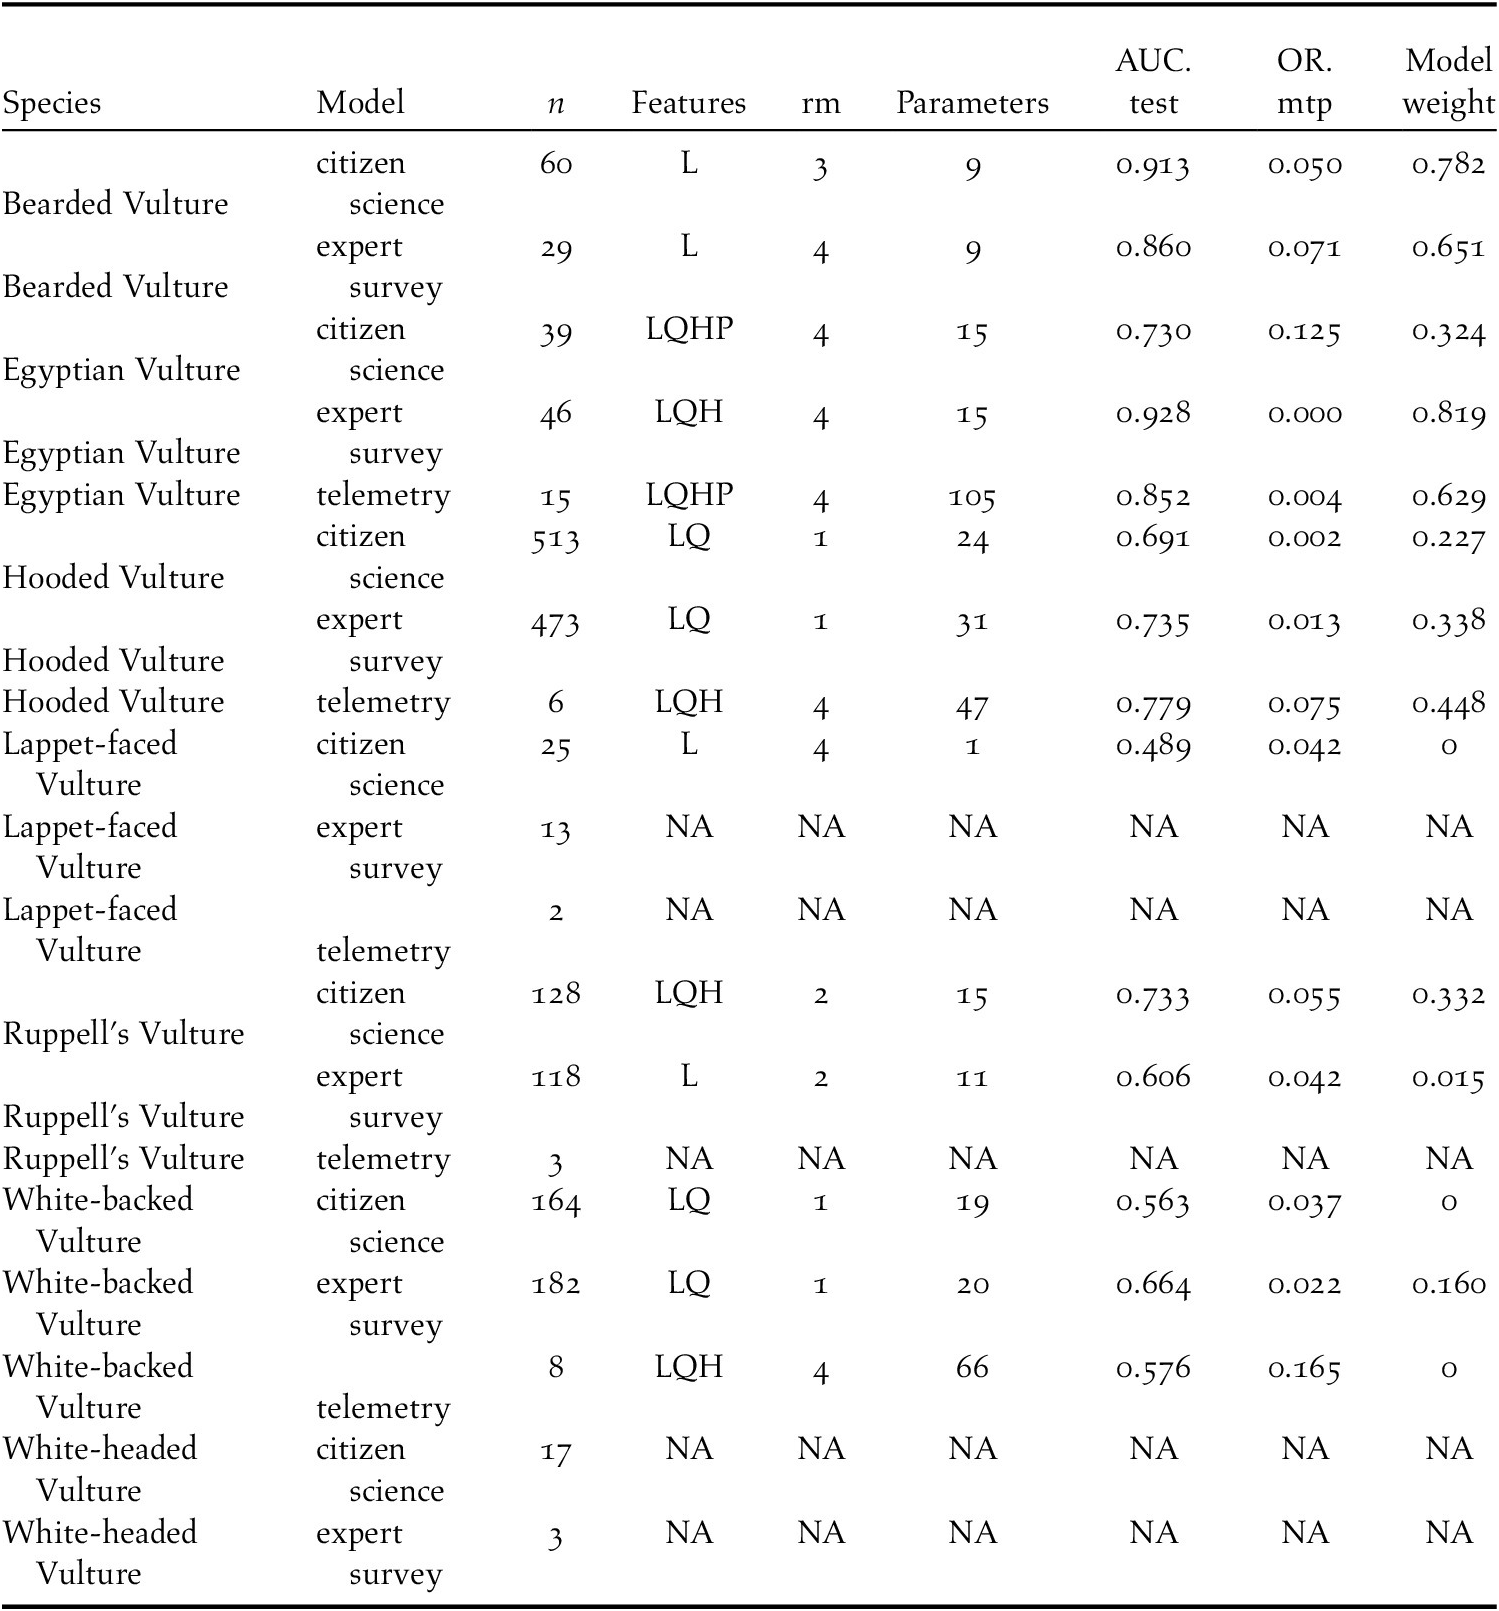
The leading predictor of Bearded Vulture occurrence was lower temperature, which was equivalent to higher elevations in Ethiopia, as well as more rugged areas. In contrast, Egyptian Vulture occurrence was best predicted by hotter temperatures, i.e. lowland desert areas. Hooded Vulture favoured human-dominated landscapes, while avoiding shrubland. Rüppell’s Vulture distribution was primarily predicted by ruggedness, as well as cooler, higher elevations. White-backed Vulture favoured cropland and forest habitats, proximity to urban centres, and cooler/higher elevations.
The core range of the Egyptian Vulture was best protected (PA coverage = 32.8%, IBA coverage = 7.8%), followed by White-backed (PA = 14.3%, IBA = 5.2%), Rüppell’s (PA = 11.9%, IBA = 9.6%), Bearded (PA = 10.5%, IBA = 13.1%), and Hooded (PA = 9.3%, IBA = 7.1%) Vultures (Table S2). The final ensemble species distribution models for each species are shown in Figure 1 and the average variable importance in the final ensemble model for each species is shown in Figure 2.
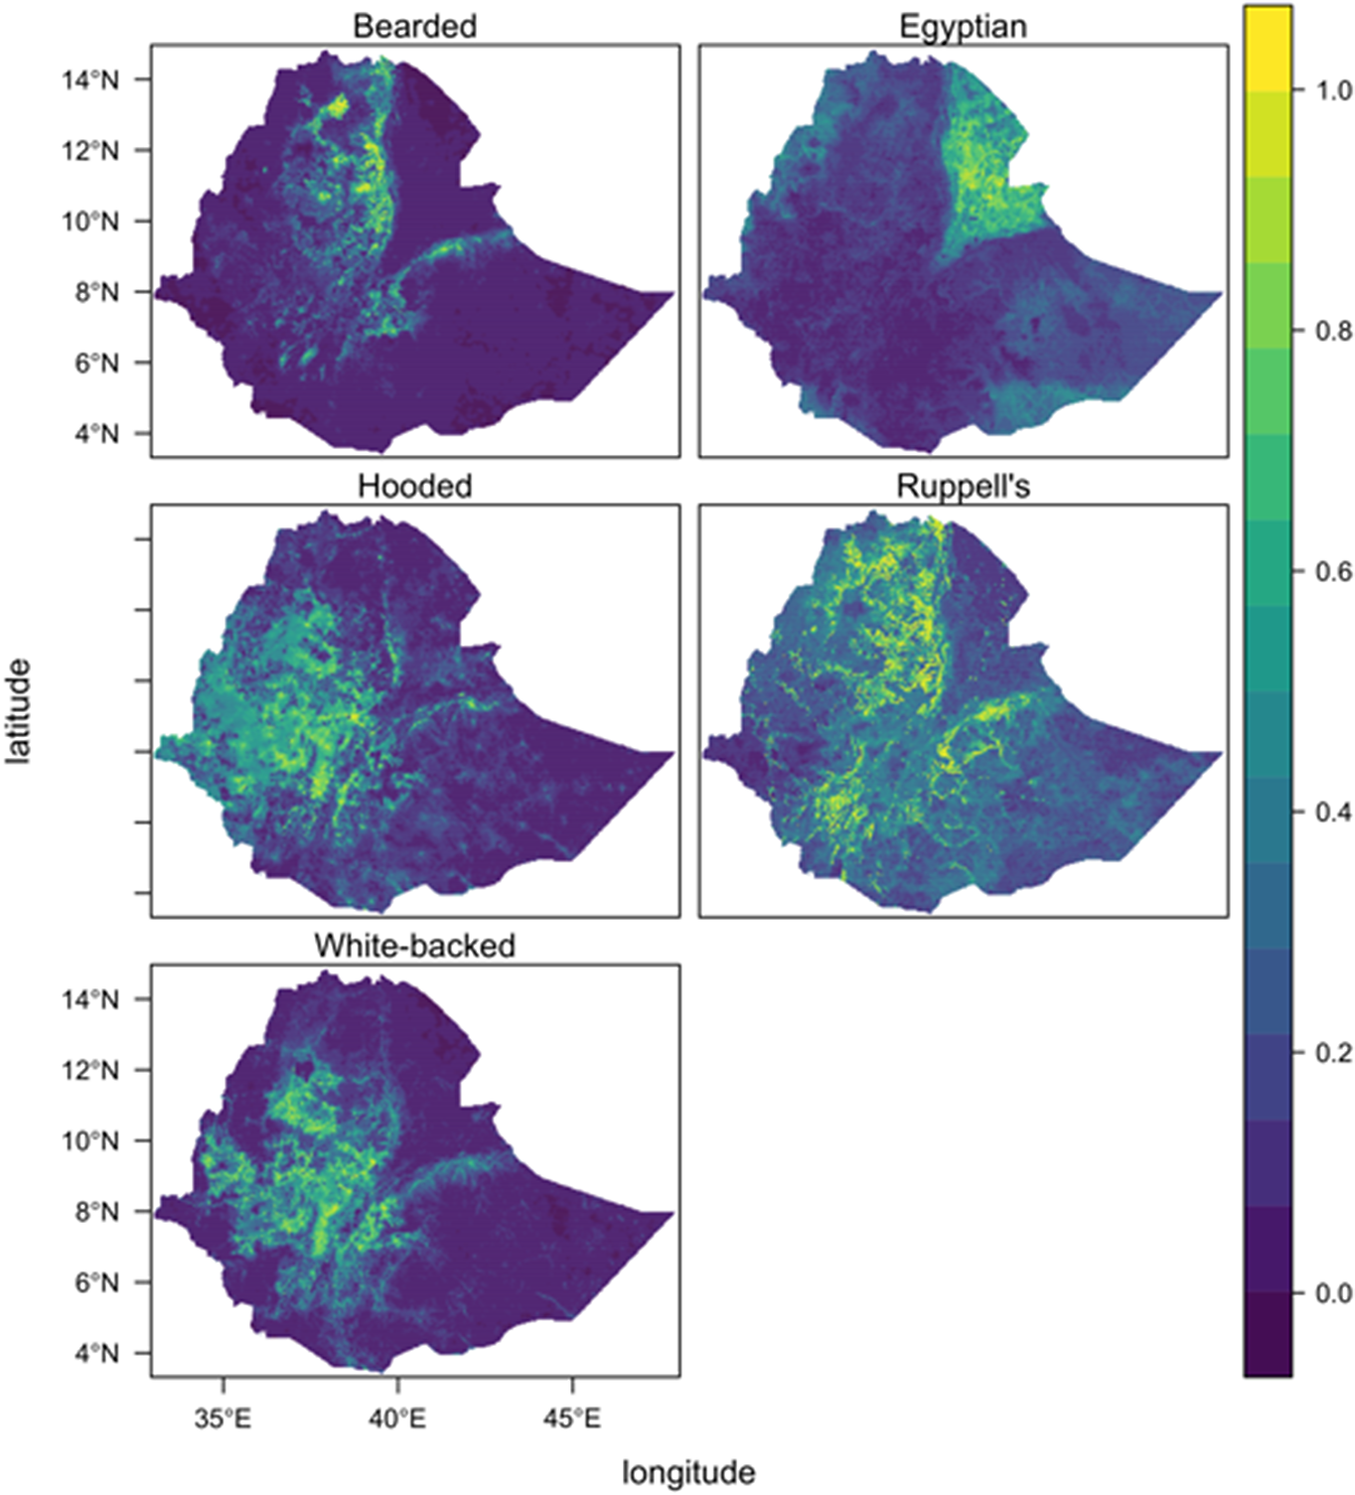
Figure 1. Ensemble species distribution models for five vulture species in Ethiopia based on up to three data sources per species (eBird, road-survey, satellite telemetry), weighted by their respective predictive accuracy, and summed. The predicted value, i.e. relative habitat suitability, ranges from 0 to 1 and is a measure of the relative probability that a species occurs on the landscape.
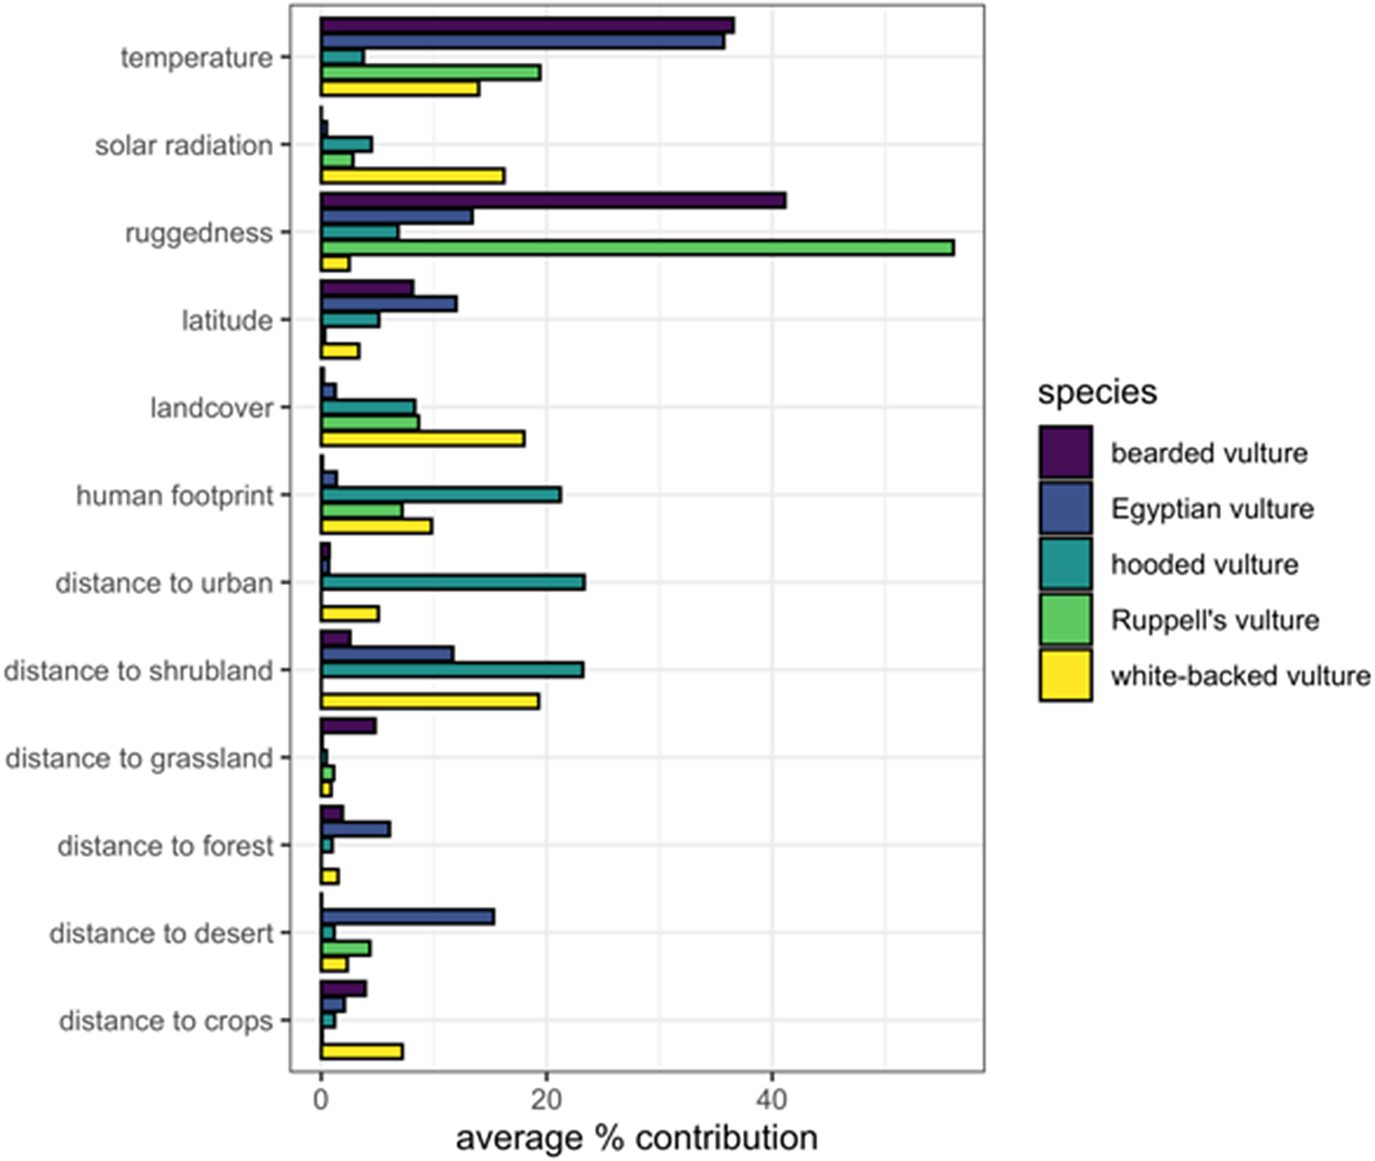
Figure 2. Average percent contribution of each predictor variable to the final ensemble distribution model for each species.
Priority conservation areas
Vulture conservation priority areas occurred throughout the highlands of Ethiopia, as well as the lowlands in the north-east of the country (Figure 3a). Southern and eastern Ethiopia had generally lower priority. The highest priority protected areas included Simien Mountains and Yangudi-Rassa National Parks, as well as several national forests (Figure 3b). These results were robust to uncertainty in predicted vulture distributions (Figure S5). Most of the highest priority IBAs were located in the vicinity of the capital city Addis Ababa in central Ethiopia (Figure 3c). The top 30% vulture priority areas encompassed an area of 338,388 km2, of which 19.4% was covered by protected areas and 8.6% was covered by IBAs. See Appendices S2 and S3 for a full list of protected areas and IBAs with their priority rank.
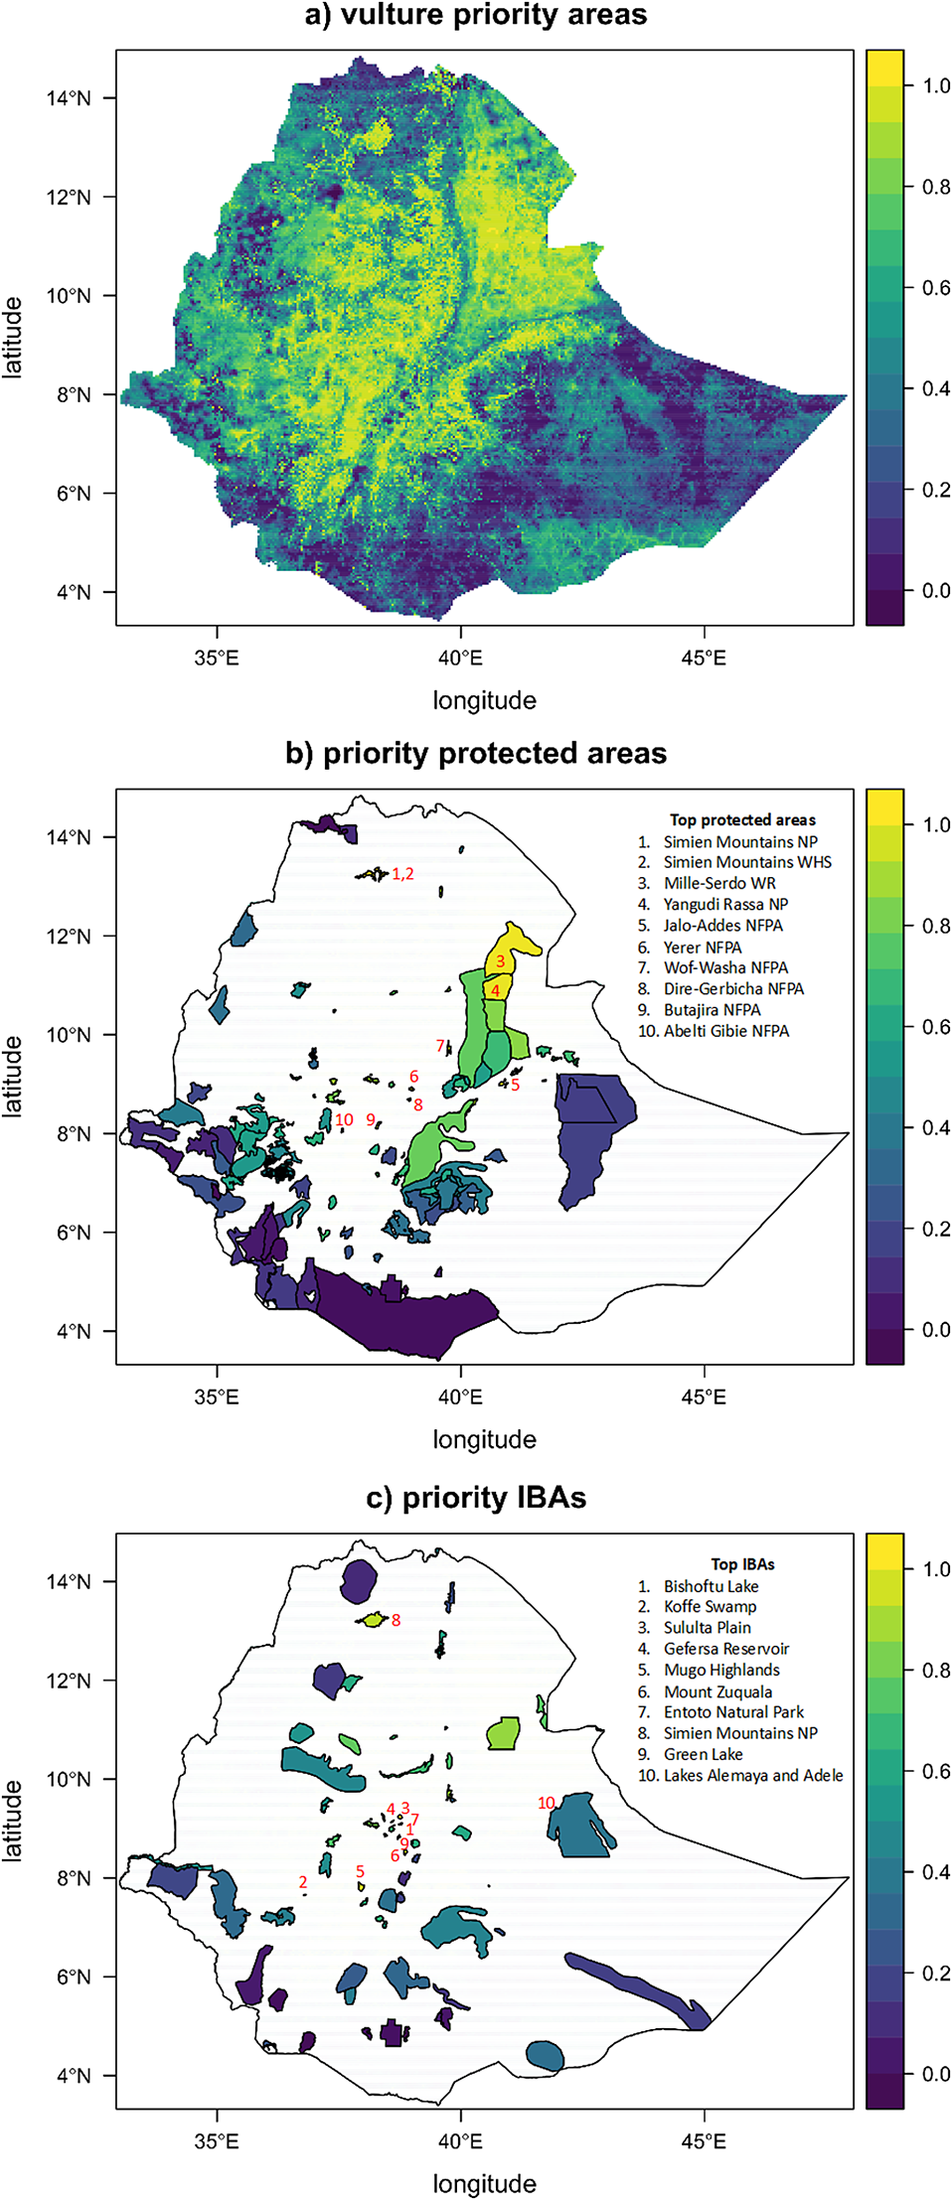
Figure 3. Spatial conservation priorities for vultures in Ethiopia. Panel a) shows the overall spatial priorities, which is the output of the zonation analysis. Panels b) and c) show the rank priority of the protected area (PAs) and Important Bird and Biodiversity Area (IBAs) networks, as well as the top-ten highest priority site. The colours of the filled polygons correspond with the scale, ranging from 0 to 1, which is a relative measure of spatial conservation importance for vultures.
Discussion
We provide the first quantitative analysis of vulture distributions in Ethiopia to identify spatial conservation priorities. We created ensemble models with up to three data sources per species to incorporate as much information as possible regarding each species’ ecological niche. Priority areas occurred broadly in the central highlands of Ethiopia, which provide particularly important habitat for Bearded, Hooded, Rüppell’s and White-backed Vultures, as well as the lowlands of north-eastern Ethiopia, which are particularly valuable for the Egyptian Vulture (Figure 1, Figure 3). One-fifth of vulture priority areas were covered by protected areas, while less than one-tenth were covered by IBAs. Species core ranges were variably protected, with the Egyptian Vulture faring best at one-third protected, followed by White-backed Vulture at one-sixth, and all other species at one-tenth. That the vast majority (i.e. approximately 80%) of priority areas for vultures in Ethiopia fall outside the protected area network is in contrast to other studies in Africa that have shown vultures persist primarily within protected areas across the continent (Thiollay Reference Thiollay2006, Virani et al. Reference Virani, Kendall, Njoroge and Thomsett2011, Pomeroy et al. Reference Pomeroy, Shaw, Opige, Kaphu, Ogada and Virani2014, Murn et al. Reference Murn, Mundy, Virani, Borello, Holloway and Thiollay2016), with exceptions for Egyptian and Hooded Vultures (Buechley et al. Reference Buechley, McGrady, Çoban and Şekercioğlu2018, Henriques et al. Reference Henriques, Granadeiro, Monteiro, Nuno, Lecoq, Cardoso, Regalla and Catry2018). Our results are strikingly similar to global Old World vulture conservation priority areas, for which one-fifth of the top-priority areas are protected and about one-tenth intersect IBAs (Santangeli et al. Reference Santangeli, Girardello, Buechley, Botha, Minin and Moilanen2019a).
The limited protection of vulture priority areas indicates that conservation actions must be effective outside the existing protected area network. As has been argued at the global level (Botha et al. Reference Botha, Andevski, Bowden, Gudka, Safford, Tavares and Williams2017, Santangeli et al. Reference Santangeli, Girardello, Buechley, Botha, Minin and Moilanen2019a), measures of broad spatial and legislative scope are likely to be necessary to conserve vultures and their respective ecosystem services. Such measures could include legislation aimed at controlling the availability and use of veterinary drugs and poisons that are drivers of vulture declines across Africa (Ogada Reference Ogada2014). Further, comprehensive environmental impact assessments should occur prior to energy infrastructure developments to evaluate and mitigate threats to vultures and other biodiversity (Santangeli et al. Reference Santangeli, Girardello, Buechley, Botha, Minin and Moilanen2019a). It will also be imperative to work closely and collaboratively with stakeholders to identify and address local issues, such as human-wildlife conflict, which could contribute to vulture declines. Given that Ethiopia has a disproportionate role in supporting vulture populations (Botha et al. Reference Botha, Andevski, Bowden, Gudka, Safford, Tavares and Williams2017, Buechley et al. Reference Buechley, Santangeli, Girardello, Neate-Clegg, Oleyar, McClure and Şekercioğlu2019, Santangeli et al. Reference Santangeli, Girardello, Buechley, Botha, Minin and Moilanen2019a), yet has among the least economic resources globally (World Bank 2019a), we call for increased international attention to and funding for vulture conservation efforts here.
An important next step to improve vulture conservation in the Horn of Africa will be a more detailed assessment of the spatial distribution of threats (Botha et al. Reference Botha, Andevski, Bowden, Gudka, Safford, Tavares and Williams2017). The use of poisons to control feral dog populations by municipalities is apparently widespread and a major danger for vulture populations (Abebe Reference Abebe2013). Further, electrocution on powerlines has been shown to kill Egyptian Vultures in neighboring Sudan (Angelov et al. Reference Angelov, Hashim and Oppel2012), and, similarly concerning levels of electrocution of vultures have been recently reported in Ethiopia (Bakari et al. Reference Bakari, Mengistu, Tesfaye, Ruffo, Oppel, Arkumarev and Nikolov2020). Ethiopia also has some of the largest wind energy facilities in Africa, with ambitious development targets to grow this sector (Asress et al. Reference Asress, Simonovic, Komarov and Stupar2013). While renewable energy expansion is generally a positive strategy for the development of Ethiopia and global environmental sustainability, poorly situated turbines and high voltage transmission lines can be highly detrimental to soaring birds and other wildlife (Barrios and Rodríguez Reference Barrios and Rodríguez2004, Sánchez-Zapata et al. Reference Sánchez-Zapata, Clavero, Carrete, DeVault, Hermoso, Losada, Polo, Sánchez-Navarro, Pérez-García, Botella, Ibáñez and Donázar2016). Climate change is also expected to severely impact the region (Soultan et al. Reference Soultan, Wikelski and Safi2019), and, given that temperature was one of the most important predictors for the occurrence of Bearded, Rüppell’s, and White-backed Vultures (Figure 2), it could be contributing to range contractions (Simmons and Jenkins Reference Simmons and Jenkins2007, Phipps et al. Reference Phipps, Diekmann, MacTavish, Mendelsohn, Naidoo, Wolter and Yarnell2017). Further, we call for a review and update of the IBA network in Ethiopia, which is outdated and largely focused on wetland and riparian areas. The vulture conservation priority areas that were identified herein could be the basis for several additional IBAs, per the A1 Global IBA Criterion for globally threatened species (BirdLife International 2020).
The predicted distributions of vultures herein indicate that Egyptian, Hooded, and White-backed Vultures favour human dominated landscapes and proximity to urban areas. The Egyptian Vulture is known to regularly congregate at refuse dumps (Tauler-Ametller et al. Reference Tauler-Ametller, Hernández-Matías, Pretus and Real2017, Buechley et al. Reference Buechley, McGrady, Çoban and Şekercioğlu2018, McGrady et al. Reference McGrady, Karelus, Rayaleh, Sarrouf Willson, Meyburg, Oli and Bildstein2019), and Hooded Vultures are known to associate with humans, particularly in West Africa and Ethiopia (Mundy et al. Reference Mundy, Bunchart, Ledger and Piper1993, Mullié et al. Reference Mullié, Couzi, Diop, Piot, Peters and Reynaud2017, Henriques et al. Reference Henriques, Granadeiro, Monteiro, Nuno, Lecoq, Cardoso, Regalla and Catry2018, Thompson et al. Reference Thompson, Barber, Bechard, Botha, Wolter, Neser, Buechley, Reading, Garbett, Hancock, Maude, Virani, Thomsett, Lee, Ogada, Barlow and Bildstein2020). In contrast, the White-backed Vulture is more widely regarded as averse to human dominated landscapes, or having already declined precipitously in them, to the point that it occurs mainly within protected areas across much of Africa (e.g. Thiollay Reference Thiollay2006, Virani et al. Reference Virani, Kendall, Njoroge and Thomsett2011, Pomeroy et al. Reference Pomeroy, Shaw, Opige, Kaphu, Ogada and Virani2014; although note that tracked immatures in southern Africa spent the majority of their time outside of protected areas (Phipps et al. Reference Phipps, Willis, Wolter and Naidoo2013). Provided that we tracked Hooded and Egyptian Vultures that were caught in the vicinity of towns, there could be some sampling bias in our models. However, these results are fully congruent with our extensive observations throughout the country. Vulture coexistence with humans in Ethiopia may be regarded as a mutualistic relationship (Gangoso et al. Reference Gangoso, Agudo, Anadon, De la Riva, Suleyman, Porter and Donazar2013, Moleón et al. Reference Moleón, Sánchez-Zapata, Margalida, Carrete, Owen-Smith and Donázar2014). Vulture ecosystem services, while rarely robustly quantified, are now widely recognized (Şekercioğlu Reference Şekercioğlu2006, Buechley and Şekercioğlu Reference Buechley and Şekercioğlu2016a,b, Devault et al. Reference Devault, Beasley, Olson, Moleón, Carrete, Margalida, Sánchez-zapata, Sekercioglu, Wenny and Whelan2016), including efficient nutrient cycling and carrion removal, reduction in greenhouse gas emissions (Morales-Reyes et al. Reference Morales-Reyes, Pérez-García, Moleón, Botella, Carrete, Lazcano, Moreno-Opo, Margalida, Donázar and Sánchez-Zapata2015, Reference Morales-Reyes, Pérez-García, Moleón, Botella, Carrete, Donázar, Cortés-Avizanda, Arrondo, Moreno-Opo, Jiménez, Margalida and Sánchez-Zapata2017), controlling problematic facultative scavengers and insects (Ogada et al. Reference Ogada, Torchin, Kinnaird and Ezenwa2012b, Buechley and Şekercioğlu Reference Buechley and Şekercioğlu2016a), and potentially limiting the spread of disease (Markandya et al. Reference Markandya, Taylor, Longo, Murty, Murty and Dhavala2008, Buechley and Şekercioğlu Reference Buechley and Şekercioğlu2016a, Şekercioğlu et al. Reference Şekercioğlu, Whenny, Whelan, Şekercioğlu, Whenny and Whelan2016, Plaza et al. Reference Plaza, Blanco and Lambertucci2020). Nonetheless, the association of some species of vultures with humans, and their reliance on human waste may constitute an ecological trap for vultures in the 21st century (Ogada et al. Reference Ogada, Keesing and Virani2012a, Buechley and Şekercioğlu Reference Buechley and Şekercioğlu2016a).
Notably, we found that the Egyptian Vulture distribution was concentrated in north-eastern Ethiopia. Other research has shown the importance of this area for the species, particularly for overwintering migrant populations (Arkumarev et al. Reference Arkumarev, Dobrev and Abebe2014, Buechley et al. Reference Buechley, McGrady, Çoban and Şekercioğlu2018). However, surveys and observations of the species in Ethiopia in the 20th century (Ash and Atkins Reference Ash and Atkins2009) indicated a more widespread distribution, with resident populations throughout the country. Our sample of occurrence records for this species was likely biased towards migrants because 13 of 15 tracked Egyptian Vultures were migrants and road surveys were done when most migrants had already arrived in Ethiopia. Nonetheless, that we had few records across much of Ethiopia indicates potential decline in the resident population in Ethiopia, and merits further investigation.
Unfortunately, we were unable to produce informative models of the distributions of Lappet-faced and White-headed Vultures, due to low sample sizes. Surveys in the last century indicated widespread distributions of both of these species in Ethiopia (Ash and Atkins Reference Ash and Atkins2009), and recent work has predicted occurrence of the latter species in Ethiopia (Murn et al. Reference Murn, Mundy, Virani, Borello, Holloway and Thiollay2016). However, these species were the least reported from citizen science observations and road surveys (Table 1). This is not unexpected, as these species are more solitary and averse to human activity. We encourage further targeted survey work on these two species to better understand their distributions, status, and priority conservation areas in the Horn of Africa. Additionally, SDMs built on telemetry and citizen science data from White backed Vulture were uninformative (AUC <0.6; Table 1). We believe this occurred because the White-backed Vulture is a generalist species that can be found across all habitats and elevations, and in both human-dominated and wild environments in Ethiopia, which made it difficult to identify strong signals of habitat association in our models.
There are several potential limitations to our data sources and analyses. In addition to the paucity of data for certain species, as discussed above, we had sparse data from the Somali Region of south-eastern Ethiopia due to security issues inhibiting access. Thus, we caution that the modelled predictions for this region are extrapolatory and should be taken as a first indication of potential areas to target further investigations. Further, we recognize that spatial sampling biases across the three data types could have influenced our models. For example, road surveys were restricted to areas proximate to roads, citizen science data tend to be concentrated in human-populated areas, and tracking data may be influenced by individual behaviour and tagging locations. We worked to address these potential biases, following recommendations in Merow et al. (Reference Merow, Smith and Silander2013), by limiting the background sample in each species-data type model to areas that were surveyed or realistically accessible to tracked individuals. To assess how robust our predictions are, we also directly quantified niche overlap between different species-data-type model predictions (Table S1), quantified uncertainty in our predictions (Figure S4, Figure S5), and deducted areas with more uncertainty in our prioritization exercise. Overall results indicated that our models were largely robust to uncertainty. Further, our models lacked some predictor variables that could be important for vulture space use (for example, the location of carcasses). We expect that predictions could thus be further refined if predictive layers existed that more accurately captured important local aspects of vulture ecology (see relevant discussion here: Efrat et al. Reference Efrat, Hatzofe and Berger-tal2020, Santangeli et al. Reference Santangeli, Girardello, Buechley, Botha, Minin and Moilanen2020).
In summary, we provide here the first detailed assessment of vulture distributions and spatial conservation priorities for one of the most important countries for vulture conservation worldwide. The low coverage of vulture priority areas by protected areas, as well as the association between vultures and human-dominated landscapes, indicates a need for actions of wide temporal and spatial scope (Botha et al. Reference Botha, Andevski, Bowden, Gudka, Safford, Tavares and Williams2017, Santangeli et al. Reference Santangeli, Girardello, Buechley, Botha, Minin and Moilanen2019a, Perrig et al. Reference Perrig, Lambertucci, Cruz, Alarcón, Plaza, Middleton, Blanco, Sánchez-Zapata, Donázar and Pauli2020). Enactment and enforcement of legislation will likely be essential to reduce the availability and use of veterinary drugs and poisons that threaten wildlife (Margalida et al. Reference Margalida, Bogliani, Bowden, Donazar, Genero, Gilbert, Karesh, Kock, Lubroth, Manteca, Naidoo, Neimanis, Sanchez-Zapata, Taggart, Vaarten, Yon, Kuiken and Green2014, Ogada Reference Ogada2014). Similarly, use of best practices and thorough implementation of environmental impact assessments prior to energy development projects are necessary. Several international conventions and frameworks exist to facilitate development and enforcement of policy relevant to vulture conservation. For example, Ethiopia is a signatory of the Convention on Biological Diversity (CBD), Convention of Migratory Species (CMS), and the Convention on the International Trade of Endangered Species of Wild Fauna and Flora (CITES), which provide guidelines to support the conservation of wildlife, including vultures. Encouragingly, in 2020 Ethiopia also became a signatory of the Raptors MoU, under CMS, which supports specific actions to reduce mortality of raptors and vultures from poisoning and energy infrastructure (Botha et al. Reference Botha, Andevski, Bowden, Gudka, Safford, Tavares and Williams2017). Such actions, if taken while considering the local social context and in a manner that aids sustainable development, would help to conserve threatened vultures and their critical ecological functions, while also benefiting many other species occurring in this biodiversity hotspot region of global importance. Further, we believe that it is imperative to reduce social and economic inequalities, promote peace, and invest in community-led initiatives in order to achieve biodiversity conservation in Ethiopia (Santangeli et al. Reference Santangeli, Girardello, Buechley, Eklund and Phipps2019b), especially provided the recent increase in social unrest and violence in the country.
Supplementary Materials
To view supplementary material for this article, please visit http://doi.org/10.1017/S0959270921000228.
Acknowledgements
We thank the Ethiopia Wildlife Conservation Authority for collaboration and research permits. We thank the Ethiopia Wildlife and Natural History Society and Addis Ababa University Department of Zoology for collaboration and technical support. Thanks to Sisay Seyfu for facilitating all work, and to Andres de la Cruz Muñoz, Juan Ramirez Roman, and Gabriel Caucal for participating in surveys. We thank Steffen Oppel, whose constructive comments helped to improve the manuscript. We are grateful to HawkWatch International, the National Geographic Society, the University of Utah, the Deutsche Forschungsgemeinschaft (DFG, German Research Foundation) under Germany’s Excellence Strategy – EXC 2117 – 422037984, the Wallace Research Foundation, The Peregrine Fund, Dutch zoos (notably Avifauna and Blijdorp), and WWF Netherlands for funding. The following HawkWatch International donors sponsored the vulture tracking project: Antczak Polich Law, Buddy Woodhouse, Circle of Life Fund, Doug and Tana Hunter, Eva Carlston Academy, Glen and Anneli Bowen, Jane Tatchell, Julia Shaw, Kirsten Collins, Nancy and John Matro, Scott and Amy Florell, SWCA Environmental Consultants, Team Kaddas, Valerie Walker, and Walter and Karen Loewenstern. AS was supported by a Finnish Academy fellowship (1307909).


 Open access