


Introduction
Inside the olfactory chamber, the olfactory sensory neurons (OSNs) of fish are directly exposed to water and its pollutants, which can interact with the dendritic terminations, affecting their integrity and functions (Sorensen & Caprio, Reference Sorensen, Caprio and Evans1998; Laberge & Hara, Reference Laberge and Hara2001; Zielinski & Hara, Reference Zielinski, Hara, Hara and Zielinski2006; Tierney et al., Reference Tierney, Baldwin, Hara, Ross, Scholz and Kennedy2010; Azizishirazi et al., Reference Azizishirazi, Dew, Bougas, Dashtban, Bernatchez and Pyle2014; Lari et al., Reference Lari, Razmara, Bogart, Azizishirazi and Pyle2019). In the olfactory mucosa covering the olfactory lamellae of fish olfactory rosette, morphologically and biochemically distinct types of OSNs are present (Hansen et al., Reference Hansen, Rolen, Anderson, Morita, Caprio and Finger2003; Zielinski & Hara, Reference Zielinski, Hara, Hara and Zielinski2006): ciliated olfactory sensory neurons (cOSNs) and microvillous olfactory sensory neurons (mOSNs), common to all vertebrates (Eisthen, Reference Eisthen1992; Zielinski & Hara, Reference Zielinski, Hara, Hara and Zielinski2006), and the crypt cells, exclusively described in cartilaginous, Polypteriformes, and teleost fish (Hansen & Finger, Reference Hansen and Finger2000; Ferrando et al., Reference Ferrando, Bottaro, Gallus, Girosi, Vacchi and Tagliafierro2006, Reference Ferrando, Bottaro, Gallus, Girosi, Vacchi and Tagliafierro2007, Reference Ferrando, Gallus, Gambardella, Amaroli, Vallarino and Tagliafierro2011). Axons emerging from OSNs converge in the olfactory nerves that innervate the glomerular layer of the olfactory bulbs (Hamdani & Døving, Reference Hamdani and Døving2007). Olfactory sensory neurons have different signaling pathways, so different pollutants could be selective in their effects, causing changes in the response of OSNs to specific odors (Dew et al., Reference Dew, Azizishirazi and Pyle2014, Reference Dew, Veldhoen, Carew, Helbing and Pyle2016).
In aquatic ecosystems, heavy metals are common anthropogenic pollutants, persistent, and toxic at very low concentrations (Azizishirazi et al., Reference Azizishirazi, Dew, Bougas, Dashtban, Bernatchez and Pyle2014). They can cause histopathological (Bettini et al., Reference Bettini, Ciani and Franceschini2006a, Reference Bettini, Ciani and Franceschini2006b; Tierney et al., Reference Tierney, Baldwin, Hara, Ross, Scholz and Kennedy2010; Lazzari et al., Reference Lazzari, Bettini, Milani, Maurizii and Franceschini2017, Reference Lazzari, Bettini, Milani, Maurizii and Franceschini2019) and functional (McIntyre et al., Reference McIntyre, Baldwi, Meador and Scholz2008; Tierney et al., Reference Tierney, Baldwin, Hara, Ross, Scholz and Kennedy2010; Dew et al., Reference Dew, Wood and Pyle2012, Reference Dew, Azizishirazi and Pyle2014, Reference Dew, Veldhoen, Carew, Helbing and Pyle2016; Hentig & Byrd-Jacobs, Reference Hentig and Byrd-Jacobs2016; Razmara et al., Reference Razmara, Imbery, Koide, Helbing, Wiseman, Gauthier, Bray, Needham, Haight, Zovoilis and Pyle2021) alterations to the olfactory system of fish, affecting various behaviors guided by olfaction, such as food searching, recognition of sexual partners, alarm cue, and predators avoidance (Scott et al., Reference Scott, Sloman, Rouleau and Wood2003; Sandahl et al., Reference Sandahl, Baldwin, Jenkins and Scholz2007; McIntyre et al., Reference McIntyre, Baldwin, Beauchamp and Scholz2012; Azizishirazi et al., Reference Azizishirazi, Dew, Bougas, Dashtban, Bernatchez and Pyle2014; Abreu et al., Reference Abreu, Giacomini, Kalueff and Barcellos2016, Reference Abreu, Giacomini, Rodriguez, Kalueff and Barcellos2017; Hentig & Byrd-Jacobs, Reference Hentig and Byrd-Jacobs2016).
Mercury is a global, bio-accumulative persistent and toxic metal, which causes a very high risk to environmental and human health (for references, see Bernhoft, Reference Bernhoft2012; Syversen & Kaur, Reference Syversen and Kaur2012; Bjørklund et al., Reference Bjørklund, Dadar, Mutter and Aaseth2017; Ha et al., Reference Ha, Basu, Bose-O'Reilly, Dórea, McSorley, Sakamoto and Chan2017; Zhu et al., Reference Zhu, Zhang and Žagar2018). It is present in the environment in consequence of both natural processes (volcanic events, forest fires, rock weathering) and human activities (Risher & De Rosa, Reference Risher and De Rosa2007). Anthropogenic sources include sources of nonoccupational exposure before mercury was replaced with safe substances (home, office, school, and health care devices: thermometers, barometer, sphygmomanometers, fluorescent bulbs, batteries, paints, inks), fossil fuel combustions, and occupational exposures (dental practice, mining activities, various industrial applications) (Bhan & Sarkar, Reference Bhan and Sarkar2005; Risher & De Rosa, Reference Risher and De Rosa2007). Mercury exists in three chemical forms: elemental mercury, known as metallic mercury, organic mercury, mainly methyl mercury, and inorganic mercury compounds, mercury salt, mainly mercuric chloride. Each is characterized by a specific profile of toxicity (Guzzi & La Porta, Reference Guzzi and La Porta2008). In addition to elemental mercury which is slightly water soluble and represents only a small portion of the total mercury in superficial freshwater, inorganic mercury together with organic mercury are the chemical forms primarily found in water, sediment, soil, and living organisms (Zhu et al., Reference Zhu, Zhang and Žagar2018). In water, both inorganic and organic mercury are found in dissolved, colloidal, and suspended phases. In nature, the different mercury chemical forms undergo complex cycling and transformations (Krabbenhoft & Rickert, Reference Krabbenhoft and Rickert1995; Gonzalez-Raymat et al., Reference Gonzalez-Raymat, Liu, Liriano, Li, Yin, Shi, Jiang and Cai2017). Several environmental models for mercury transport and fate in aquatic systems have been developed, which represent valuable decision-making tools in mercury pollution control and management (see Zhu et al., Reference Zhu, Zhang and Žagar2018). Due to mercury ubiquitous environmental presence, freshwater and seawater fish may contain large amounts of it taken through the food chain. That is why eating large amounts of fish is hazardous especially for children and the developing fetus in pregnant women (Goldman & Shannon, Reference Goldman and Shannon2001).
Mercury is a diffuse neurotoxic agent affecting fish olfaction: in the Atlantic salmon, it was observed accumulation of mercuric chloride around the borders of OSNs (Tierney et al., Reference Tierney, Baldwin, Hara, Ross, Scholz and Kennedy2010), while it caused cilia degeneration and cell death (both sensory and nonsensory) in the Indian major carp after extended exposure (15 and 30 days) to sublethal doses (Ghosh & Mandal, Reference Ghosh and Mandal2014). Unlike copper (Razmara et al., Reference Razmara, Imbery, Koide, Helbing, Wiseman, Gauthier, Bray, Needham, Haight, Zovoilis and Pyle2021), the mechanisms by which mercury affects olfaction are less known (Ribeiro et al., Reference Ribeiro, Fernandes, Carvalho, Cardoso and Turcatti1995). Indeed, nothing is reported about behavioral responses or adverse effects after short-term exposure (less than 7 days) in adult fish, so it is impossible to compare mercury effects with other metal toxicity.
In this study, we analyzed the effect of exposure to sublethal doses of mercury ions (Hg2+) in the three different types of OSNs in zebrafish (Danio rerio Hamilton, 1882). Zebrafish is a suitable model because immunohistochemical properties of its olfactory organ are extensively described in the literature (Hill et al., Reference Hill, Teraoka, Heideman and Peterson2005; Germanà et al., Reference Germanà, Paruta, Germanà, Ochoa-Erena, Montalbano and Vega2007; Gayoso et al., Reference Gayoso, Castro, Anadón and Manso2011; Braubach et al., Reference Braubach, Fine and Croll2012), and, moreover, we can compare mercury data with those concerning other metals (Lazzari et al., Reference Lazzari, Bettini, Milani, Maurizii and Franceschini2017, Reference Lazzari, Bettini, Milani, Maurizii and Franceschini2019).
Materials and Methods
Animals
The study was performed on 40 adult zebrafish. Fish of both sexes, ~6 months old and about 4 cm long were purchased from the Coral Aquarium, Bologna, Italy. They were acclimatized in tanks filled with a 1:2 mixture of dechlorinated tap and distilled water for 30 days, at 25°C in a 12:12 light–dark cycle. Automatic fish feeders distributed commercial food twice a day. All procedures were in accordance with the guidelines of European Communities Council Directive (86/609/CEE), the current Italian legislation regarding the use and care of animals, and the guidelines issued by the US National Institutes of Health. This study was approved by the Scientific Ethics Committee of the University of Bologna (protocol no. 17/79/2014).
Mercury Exposure
Cruz et al. (Reference Cruz, Leite, Pereira, Bogo, Bonan, Battistini, Campos and Morrone2013) listed some studies reporting the mercury concentration of 20 μg/L found in the aquatic environment. In their study on zebrafish larvae, Sun et al. (Reference Sun, Li, Liu and Chen2018) applied the environmentally relevant concentration of 16 μg/L Hg2+. In the present study, we decided to use Hg2+ concentrations based on the lethal concentration 50 (LC50) and not possible environmental values because they have a large range of variability (see Fleck et al., Reference Fleck, Marvin-DiPasquale, Eagles-Smith, Ackerman, Lutz, Tate, Alpers, Hall, Krabbenhoft and Eckley2016 for an estimation of the total concentration of mercury in different aquatic sites in Western North America). In the US EPA ECOTOX database (http://cfpub.epa.gov/ecotox/), LC50 for mercury chloride measured in adult zebrafish (6-month old) after 48 h exposure is >60–100 μg/L (Bresch, Reference Bresch1982). In the present study, we used three Hg2+ concentrations made from mercuric chloride (Merck, Darmstadt, Germany) dissolved in acclimatization water: two concentrations were supposed to be sublethal: low quantity (LQ), 0.25 μM of mercuric chloride, corresponding to 50 μg/L of Hg2+; medium quantity (MQ), 0.5 μM of mercuric chloride, corresponding to 100 μg/L of Hg2+. The third concentration was over the LC50 range found by Bresch (Reference Bresch1982) and Wang et al. (Reference Wang, Liang, Li and Chang2013a): high quantity (HQ), 1 μM of mercuric chloride, corresponding to 200 μg/L of Hg2+. However, Ung et al. (Reference Ung, Lam, Hlaing, Winata, Korzh, Mathavan and Gong2010) determined that a 4-day exposure to 300 μg/L of mercuric chloride (~220 μg/L of Hg2+) induces mortality in less than 50% of adult zebrafish (30%). Due to a certain discrepancy in lethal values in literature (Vutukuru & Basani, Reference Vutukuru and Basani2013; Wang et al., Reference Wang, Liang, Li and Chang2013a; Macirella et al., Reference Macirella, Guardia, Pellegrino, Bernabò, Tronci, Ebbesson, Sesti, Tripepi and Brunelli2016; Amorim et al., Reference Amorim, Fernandes, Vasconcelos and Teles2017), we decided to take into account also the concentration of 1 μM HgCl2. Each of three 10 L tanks containing 50, 100, and 200 μg/L of Hg2+ respectively, housed 10 fish. According to a static/renewal system, fish were moved to new tanks containing freshly prepared Hg2+ solutions every 24 h. The effect of the three concentrations of Hg2+ on olfactory mucosa was evaluated in fish sacrificed after 4-day (96 h) exposure, according to standard procedure in acute toxicity tests. Ten control fish were hosted in a tank containing acclimatization water, changed every 24 h. Control animals were sacrificed at the same time as mercury-exposed fish. Table 1 reports representative values of water parameters for acclimatization, treatment, and control tanks.
Table 1. Water Parameters of Acclimation, Control, and Hg2+ Exposure Tanks.

dH, degree of hardness; GH, general hardness; KH, carbonate hardness.
Tissue
Zebrafish, previously anesthetized with 0.1% 3-aminobenzoic acid ethyl ester (MS-222, Sigma, St. Louis MO, USA), were sacrificed by decapitation. Brains were exposed after dorsal cranium removal. Heads were fixed by immersion in a modified Bouin's fixative solution (see Lazzari et al., Reference Lazzari, Bettini, Milani, Maurizii and Franceschini2019) for 24 h at room temperature. After multiple extended 0.1 M phosphate buffer washes, specimens were decalcified in 0.25 M buffered EDTA, pH 7.4, for 9 days at room temperature, dehydrated, and then embedded in Paraplast Plus (Leica Biosystems, Richmond, IL, USA; melting point 55–57°C). Five μm-thick serial frontal sections were collected on silanized slides (Sigma). Some sections were colored with hematoxylin and eosin. Immunohistochemical detection was carried out on adjacent slides.
Immunohistochemistry
Details of the method are reported in Lazzari et al. (Reference Lazzari, Bettini, Milani, Maurizii and Franceschini2017). Briefly, sections were deparaffinized, rehydrated, immersed in 1% H2O2 for endogenous peroxidase blocking, and incubated separately with six primary antibodies, in a moist chamber on an orbital shaker at 4°C, overnight: (a) rabbit polyclonal anti-calretinin (AB5054; Chemicon International, Temecula, CA, USA; used dilution 1:1,000), which in zebrafish detects a heterogeneous population of ciliated and microvillous olfactory neurons (Bettini et al., Reference Bettini, Lazzari, Ferrando, Gallus and Franceschini2016); (b) rabbit polyclonal anti-Gα olf (sc-385; Santa Cruz Biotechnology, Santa Cruz, CA, USA; used dilution 1:500), which is specific for ciliated olfactory neurons (Gayoso et al., Reference Gayoso, Castro, Anadón and Manso2011; Braubach et al., Reference Braubach, Fine and Croll2012); (c) rabbit polyclonal anti-transient receptor potential cation channel, subfamily C, member 2 (anti-TRPC2; LS-C95010; LifeSpan BioSciences, Seattle, WA, USA; used dilution 1:200), a marker for microvillous olfactory neurons (Bettini et al., Reference Bettini, Lazzari, Ferrando, Gallus and Franceschini2016); (d) rabbit polyclonal anti-tyrosine protein kinase A (anti-TrkA; sc-118; Santa Cruz Biotechnology; used dilution 1:100), which marks olfactory crypt cells in zebrafish (Ahuja et al., Reference Ahuja, Ivandić, Saltürk, Oka, Nadler and Korsching2013; Bettini et al., Reference Bettini, Lazzari, Ferrando, Gallus and Franceschini2016); (e) mouse monoclonal anti-human neuronal protein HuC/HuD (anti-HuC/D; Clone 16A11; A-21271; Molecular Probes, Eugene, OR, USA; used dilution 1:100), a nuclear marker of immature and mature neurons (Iqbal & Byrd-Jacobs, Reference Iqbal and Byrd-Jacobs2010; Bettini et al., Reference Bettini, Lazzari, Ferrando, Gallus and Franceschini2016); (f) monoclonal mouse anti-proliferating cell nuclear antigen (anti-PCNA; Clone PC10; P 8825; Sigma; used dilution 1:500), which detects dividing cells (Iqbal & Byrd-Jacobs, Reference Iqbal and Byrd-Jacobs2010; Bettini et al., Reference Bettini, Lazzari, Ferrando, Gallus and Franceschini2016). Anti-TRPC2 is specifically developed against zebrafish antigens. All the other antibodies here applied were previously successfully tested on zebrafish olfactory organs by other authors. The sections were incubated in the secondary antibody for 1 h 30 min at room temperature: HRP-conjugated goat anti-rabbit IgG (PI-1000; Vector Laboratories, Burlingame, CA, USA; used dilution 1:100) for polyclonal primary antibodies, and HRP-conjugated goat anti-mouse IgG (A4416; Sigma; used dilution 1:100) for the monoclonal primary antibody. The immunoreaction was revealed with 0.1% 3,3-diaminobenzidine (DAB; Sigma) as substrate. Sections from untreated fish served as positive controls. Negative controls for the specificity of the immunostaining consisted in exclusion of primary antibodies replaced with 3% normal goat serum.
Image Acquisition, Quantification, and Statistical Analysis
Except for PCNA, only sensory areas of the lamellae were sampled. Comparisons between fish were made selecting central lamellae from similar sections of the olfactory organ as it appears in frontal sections of the head (Fig. 1). Bright-field images of the olfactory organ were taken using an Olympus BH-2 microscope (Olympus Italia, Segrate, Italy) equipped with a BEL BlackL 5,000 digital camera (BEL Engineering, Monza, Italy). Light conditions were the same throughout acquired images. Micrographs were assembled with Adobe Photoshop CS3 (Adobe Systems, San Jose, CA, USA). Image processing was realized without content alteration. ImageJ 1.52o software (https://imagej.nih.gov/ij/) was employed in measurements of sensory lamellae. In anti-calretinin immunostained sections, the thickness was measured from the epithelial basal lamina to the apical surface, excluding cilia and microvilli. Both labeling pattern and the presence of long cilia on the surface of nonsensory areas were used as characteristics to distinguish between sensory and nonsensory epithelial areas. We measured the areas (μ 2) covered by sensory and nonsensory epithelia in three lamellae per section using ImageJ 1.52o software, then we calculated and averaged the ratios of sensory to nonsensory epithelium areas.

Fig. 1. Morphological analysis of olfactory rosette as it appears in zebrafish head sectioned by frontal planes. (a–d) Hematoxylin–eosin-stained semi-serial frontal sections separated by 100 μm at progressively more ventral planes. Asterisks indicate the region of the olfactory rosette examined for PCNA+-cells counting, from the center of the organ to the dotted line representing the border between the sensory and nonsensory subregions. (a,b) Lamellae in the dorsal region of the olfactory rosette. (c,d) Lamellae in the ventral region of the olfactory rosette. A, anterior; L, lateral; M, medial; P, posterior. Scale bar: 100 μm.
A physical disector method was applied for evaluating the densities of TrkA-positive cells (Bettini et al., Reference Bettini, Lazzari, Ferrando, Gallus and Franceschini2016) and PCNA-positive cells. Proliferating cells were counted in the central rosette, from the interlamellar curves to the sensory/nonsensory borders of each lamella (Fig. 1), while the outer region was not considered, being not involved in neurogenesis (Bayramli et al., Reference Bayramli, Kocagöz, Sakizli and Fuss2017). Anti-Gα olf, anti-TRPC2, and anti-HuC/D immunostaining patterns did not permit cell discrimination and counting (see also Bettini et al., Reference Bettini, Lazzari, Ferrando, Gallus and Franceschini2016; Lazzari et al., Reference Lazzari, Bettini, Milani, Maurizii and Franceschini2017, Reference Lazzari, Bettini, Milani, Maurizii and Franceschini2019), so we evaluated the Optical Density (OD) since the immunostaining intensity can be considered as an indirect index of the number of immunopositive cells (Iqbal & Byrd-Jacobs, Reference Iqbal and Byrd-Jacobs2010). In olfactory lamellae, average gray values of sensory regions and background-unstained zones were obtained by ImageJ analysis. The OD was then calculated as the logarithm of the ratio between gray values of background and sensory Region Of Interest.
In all measurements, data were obtained and averaged from three lamellae per section. For each antibody tested, mean values of fish groups were compared by ANOVA and LSD post hoc test. Using Excel 2016 (Microsoft Corporation, Redmond, WA, USA), bar graphs of mean values ± standard errors were obtained.
Results
Exposure of zebrafish to the highest Hg2+ ion concentration for 96 h caused one fish death out of a sample of ten. At the highest concentrations, the only appreciable micro-anatomical/histological effect was an increase in the unicellular mucous glands opening onto the luminal surface of the olfactory lamellae (Fig. 2). Instead, tissue disruption and metaplasia were not detected in the olfactory lamellae that also maintained their spatial arrangement. Olfactory rosettes retained their morphology. In hematoxylin eosin-stained sections, light microscopy analysis of the lamellae with high magnification revealed that even the highest mercury concentration applied did not cause removal or significant reduction of cilia (Fig. 3).

Fig. 2. Olfactory lamellae of zebrafish stained with hematoxylin–eosin. (a) Control fish. (b) Fish exposed to 200 μg/L Hg2+. Exposure to high mercury concentration caused an increase in the number of unicellular mucous glands opening into the luminal surface of the olfactory lamellae. Olfactory lamellae retain their structural integrity in fish exposed to high mercury concentration. Scale bar = 50 μm.

Fig. 3. High magnification images of olfactory lamellae epithelium stained with hematoxylin–eosin. (a) Control fish. (b) Fish exposed to 200 μg/L Hg2+. Cilia are still present in the epithelium of olfactory lamellae exposed to high mercury concentration. Scale bar = 50 μm.
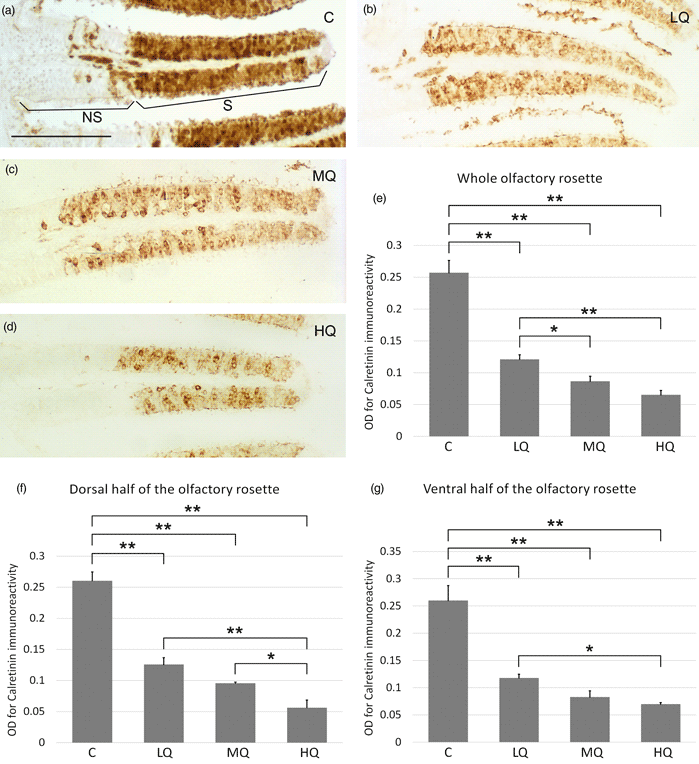
Incubation with anti-calretinin antibody that stains cell bodies and dendrites of both mature cOSNs and mOSNs, resulted in clear immunopositivity ranging from the basal to the apical layers of the olfactory epithelium (Figs. 4a–4d). When the whole olfactory rosette was examined, the OD of control was statistically greater than ODs related to the three Hg2+ concentrations. Conversely, in the comparison between the three metal concentrations, only OD for LQ was significantly greater than OD for HQ (Fig. 4e). In the dorsal half of the olfactory rosette, OD analysis revealed a condition similar to the whole rosette, with the addition of a significantly higher OD value for MQ compared to HQ (Fig. 4f). In the ventral half of the olfactory rosette, OD resembled what is found in the whole organ (Fig. 4g). Image analysis of calretinin immunostained sections permits to evaluate two additional morphometric parameters in the olfactory lamellae: the thickness of the sensory epithelium and the ratio between sensory and nonsensory epithelium areas. Image analysis of the entire olfactory rosette, as well as of each dorsal and ventral half, showed no significant differences in the ratio sensory/nonsensory areas of the olfactory lamellae among the four groups of fish (Figs. 5a–5c). Regarding the epithelium thickness, the value at HQ appeared significantly decreased compared to control, LQ, and MQ not only in the entire rosette but also in each dorsal and ventral half (Figs. 6a–6c). Moreover, in the whole rosette, the thickness of the MQ group was significantly decreased compared to control (Fig. 6a). In the dorsal half of the olfactory rosette, epithelium thickness of LQ, MQ, and HQ groups appeared significantly lower than in control (Fig. 6b).
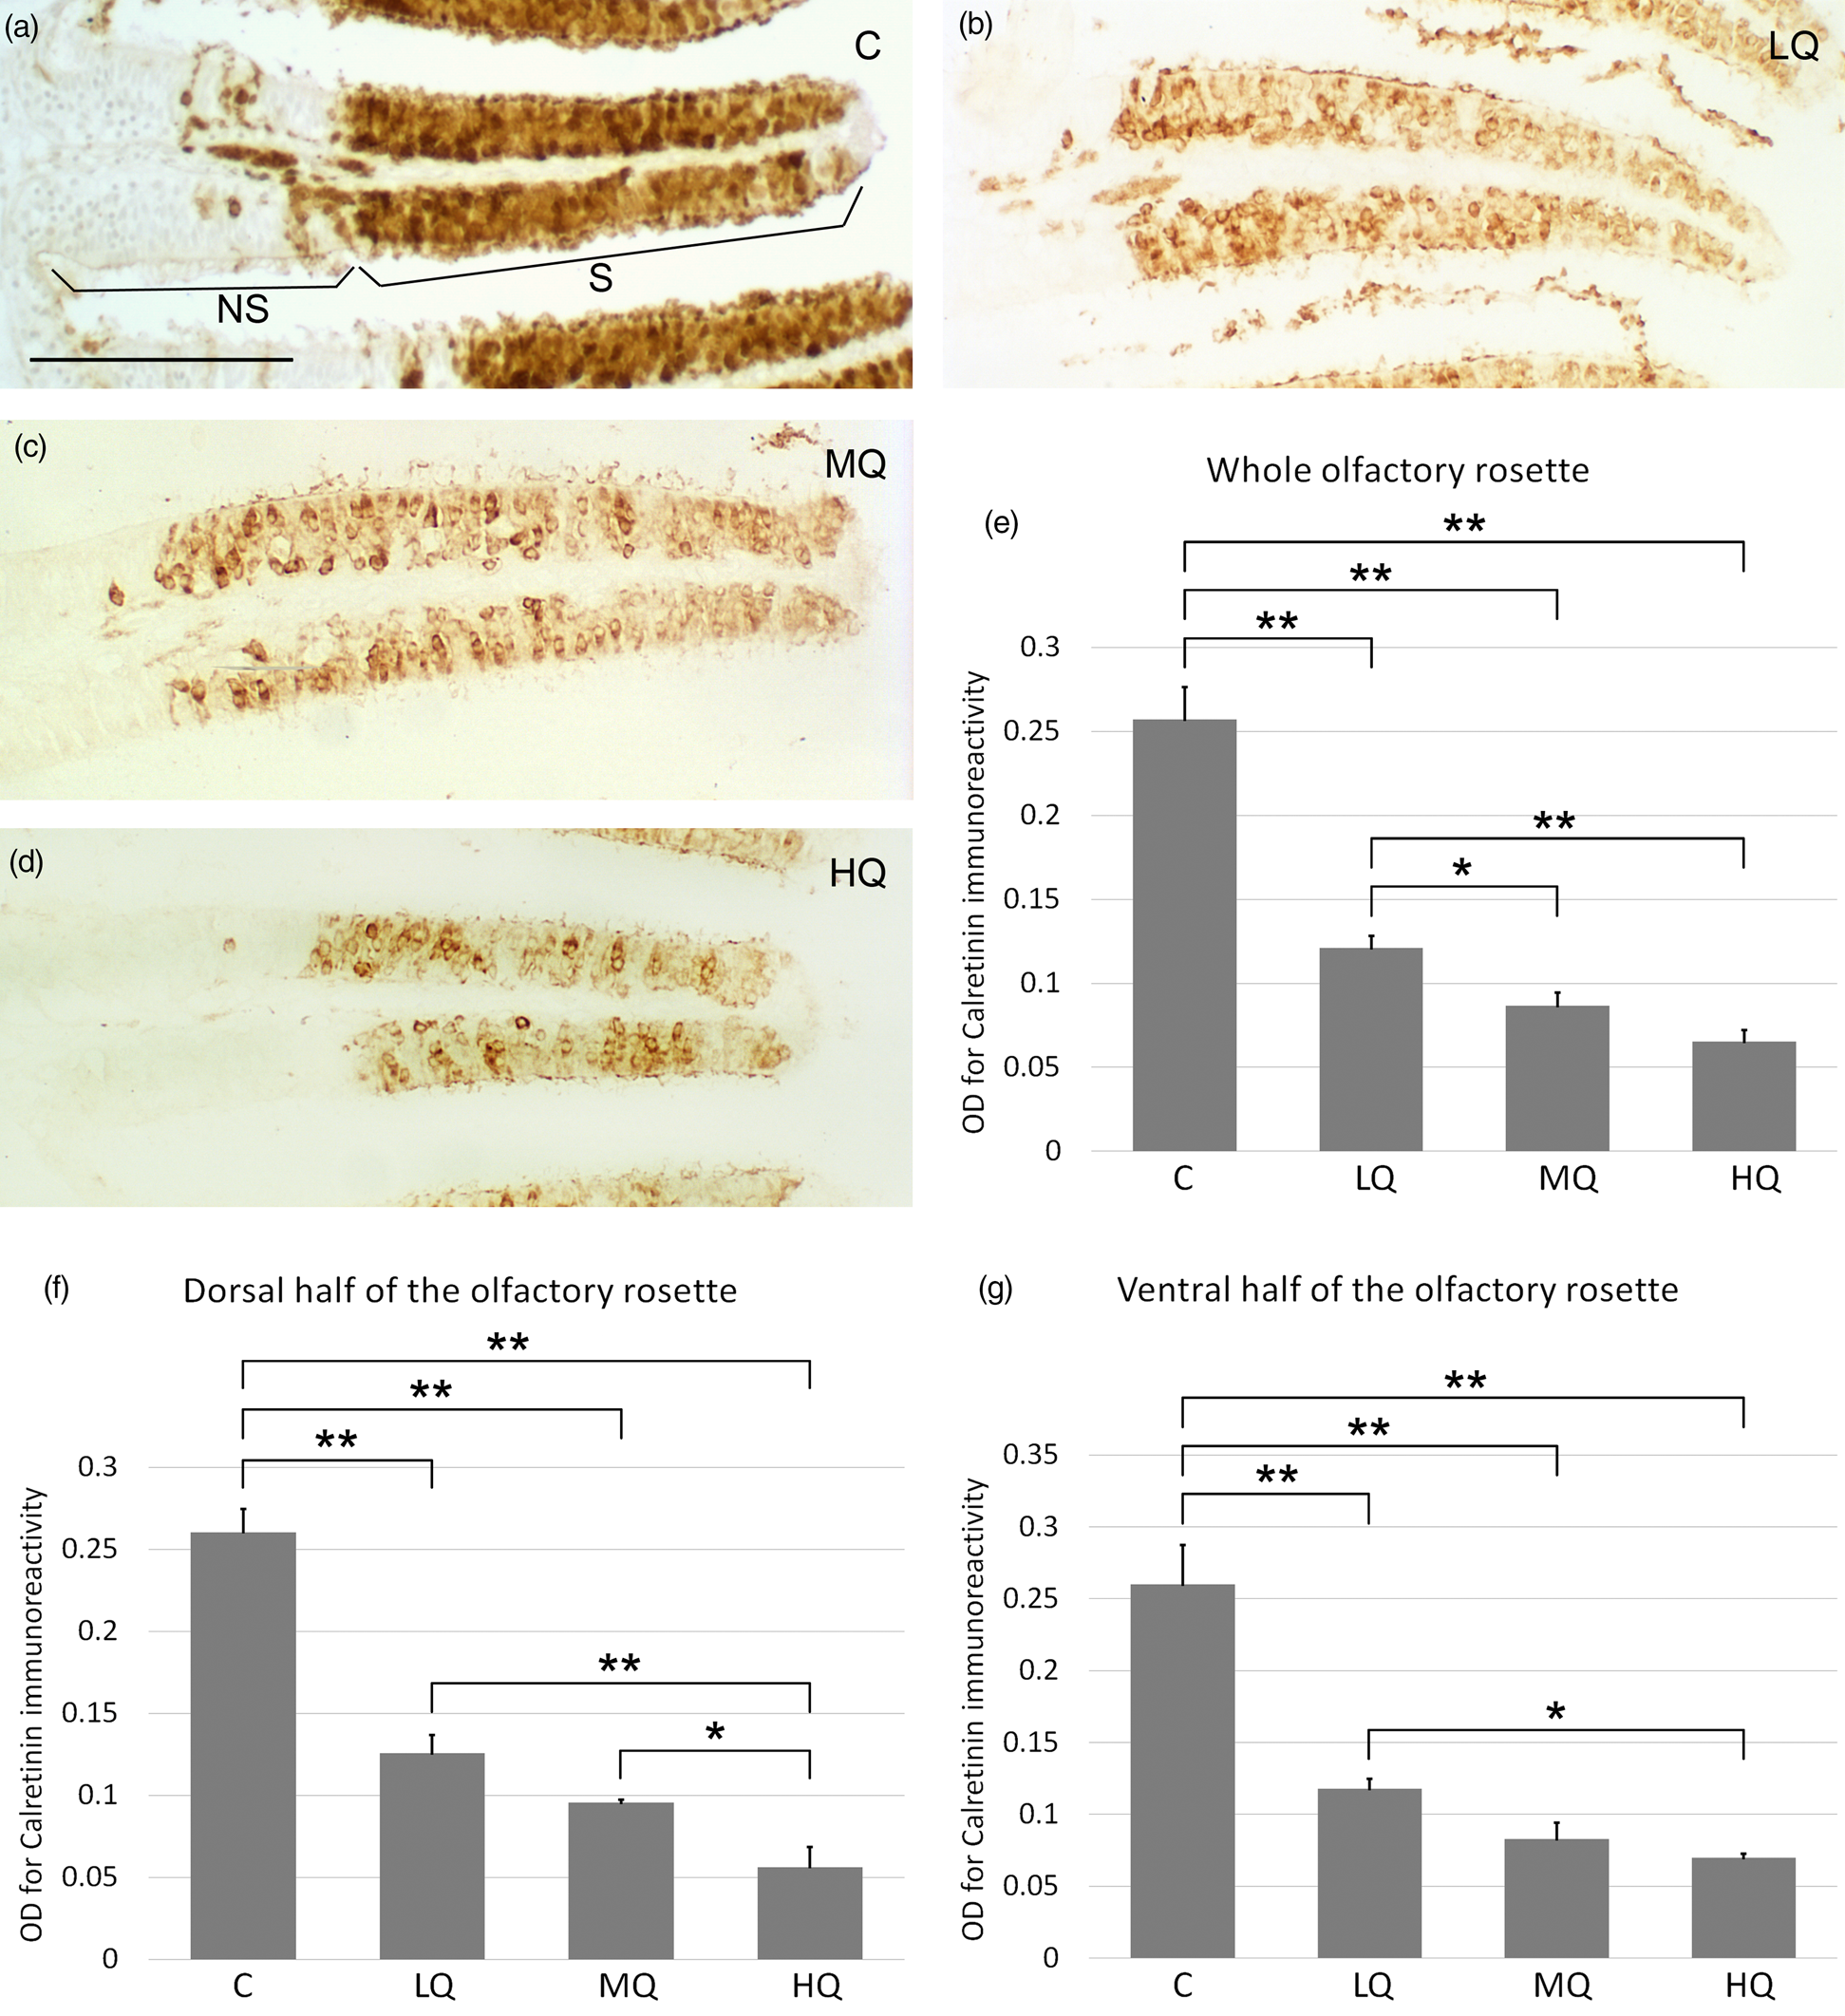
Fig. 4. Calretinin immunohistochemistry in zebrafish olfactory epithelium before and after 50, 100, and 200 μg/L Hg2+ exposure. (a) Heavy anti-calretinin immunoreaction stains the sensory area (S) of the olfactory lamellae of control fish. The nonsensory region (NS) of the lamellae appears unstained, except for some scattered cells (even if the two areas are well distinguished, there is no barrier between them, so some sensory cells can migrate and differentiate in the adjacent nonsensory region). (b) Representative micrograph of lamellae exposed to 50 μg/L of Hg2+. (c) Representative micrograph of lamellae exposed to 100 μg/L of Hg2+. (d) Representative micrograph of lamellae exposed to 200 μg/L of Hg2+. Scale bar = 50 μm. (e) Optical density analysis of the olfactory epithelium in the whole olfactory rosette. (f) Optical density analysis of the olfactory epithelium in lamellae of the dorsal half of the olfactory rosette. (g) Optical density analysis of the olfactory epithelium covering lamellae of the ventral portion of the olfactory rosette. C, control, 0 μg/L Hg2+; LQ, low quantity, 50 μg/L Hg2+; MQ, medium quantity, 100 μg/L Hg2+; HQ, high quantity, 200 μg/L Hg2+. Asterisks indicate significant differences: *, p < 0.05; **, p < 0.01.

Fig. 5. Ratio between sensory and nonsensory areas of the epithelium covering the lamellae in the olfactory rosette of zebrafish, evaluated by means of the calretinin immunoreactivity before and after 50, 100, and 200 μg/L Hg2+ exposure. (a) Ratio between sensory and nonsensory areas of the epithelium covering the lamellae in the whole olfactory rosette. (b) Ratio between sensory and nonsensory areas of the epithelium overlaying the lamellae in the dorsal half of the olfactory rosette. (c) Ratio between nonsensory and sensory areas of the epithelium covering the lamellae in the ventral half of the olfactory rosette. C, control, 0 μg/L Hg2+; LQ, low quantity, 50 μg/L Hg2+; MQ, medium quantity, 100 μg/L Hg2+; HQ, high quantity, 200 μg/L Hg2+.

Fig. 6. Sensory epithelium thickness in the zebrafish olfactory epithelium, evaluated by means of calretinin immunoreactivity before and after 50, 100, and 200 μg/L Hg2+ exposure. (a) Sensory epithelium thickness in the lamellae of the whole olfactory rosette. (b) Sensory epithelium thickness in the lamellae of the dorsal region of the olfactory rosette. (c) Sensory epithelium thickness in the lamellae of the ventral region of the olfactory rosette. C, control, 0 μg/L Hg2+; LQ, low quantity, 50 μg/L Hg2+; MQ, medium quantity, 100 μg/L Hg2+; HQ, high quantity, 200 μg/L Hg2+. Asterisks indicate significant differences: *, p < 0.05; **, p < 0.01.
At the free surface of the olfactory epithelium, anti-Gα olf antibody marked apical dendrite endings and cilia of cOSNs (Figs. 7a–7d). When the entire olfactory rosette was evaluated, HQ and MQ showed OD values significantly decreased compared to control and LQ (Fig. 7e). In the dorsal half of the olfactory rosette, OD values repeat the condition found in the entire organ (Fig. 7f). In the ventral half of the olfactory rosette, OD values showed no statistically relevant difference (Fig. 7g).

Fig. 7. Gα olf immunohistochemistry in zebrafish olfactory epithelium before and after 50, 100, and 200 μg/L Hg2+ treatment. (a) In the olfactory lamellae of control fish, the receptor cell knobs placed in the superficial zone of the sensory epithelium show different Gα olf immunostaining intensity. (b) Representative micrograph of lamellae exposed to 50 μg/L of Hg2+.(c) Representative micrograph of lamellae exposed to 100 μg/L of Hg2+. (d) Representative micrograph of lamellae exposed to 200 μg/L of Hg2+. Scale bar = 50 μm. (e) Optical density analysis of the olfactory epithelium surface in the whole olfactory rosette. (f) Optical density analysis of the olfactory epithelium surface in the lamellae of the dorsal area of the olfactory rosette. (g) Optical density analysis of the sensory epithelial surface in the lamellae of the ventral area of the olfactory rosette. C, control, 0 μg/L Hg2+; LQ, low quantity, 50 μg/L Hg2+; MQ, medium quantity, 100 μg/L Hg2+; HQ, high quantity, 200 μg/L Hg2+. Asterisks indicate significant differences: *, p < 0.05; **, p < 0.01.
Anti-TRPC2 antibody-stained dendritic apical knobs and microvilli of mOSNs at the apical region of the sensory epithelium of the olfactory rosettes (Figs. 8a–8d). In the whole olfactory rosette, as well as in both its dorsal and ventral halves, mercury exposure resulted in lower OD values than control (Figs. 8e–8g). In the entire rosette and its dorsal half, OD for HQ was statistically lower than values for both MQ and LC (Figs. 8e, 8f). In the ventral half of the olfactory rosette, OD at HQ was significantly lower than LQ only (Fig. 8g).

Fig. 8. TRPC2 immunohistochemistry in zebrafish olfactory epithelium before and after 50, 100, and 200 μg/L Hg2+ exposure. (a) In the sensory areas of the olfactory lamellae of control fish, the apical region of the olfactory epithelium contains the receptor cell endings, which are stained by anti-TRPC2 antibody. (b) Representative micrograph of lamellae exposed to 50 μg/L of Hg2+. (c) Representative micrograph of lamellae exposed to 100 μg/L of Hg2+. (d) Representative micrograph of lamellae exposed to 200 μg/L of Hg2+. Scale bar = 50 μm. (e) Optical density analysis of the olfactory epithelium surface in the whole olfactory rosette. (f) Optical density analysis of the olfactory epithelium surface in the lamellae of the dorsal half of the olfactory rosette. (g) Optical density analysis of the olfactory epithelium surface in the lamellae of the ventral half of the olfactory rosette. C, control, 0 μg/L Hg2+; LQ, low quantity, 50 μg/L Hg2+; MQ, medium quantity, 100 μg/L Hg2+; HQ, high quantity, 200 μg/L Hg2+. Asterisks indicate significant differences: *, p < 0.05; **, p < 0.01.
Anti-TrkA antibody clearly stained crypt cells, big neurons placed in the olfactory epithelium region close to the olfactory lamella surface (Figs. 9a–9d). In the whole olfactory rosette, crypt cell number for MQ and HQ was lower compared to control and LQ (Fig. 9e). In the dorsal half of the olfactory rosette, both MQ and HQ groups show a crypt cell density significantly smaller than in the LQ group (Fig. 9f). Ventrally, cell density showed a similar situation, with values for MQ and HQ lower than control and progressively decreasing with more severe exposure conditions (Fig. 9g).

Fig. 9. TrkA immunohistochemistry in zebrafish olfactory epithelium before and after 50, 100, and 200 μg/L Hg2+ treatment. (a) In olfactory lamellae of control fish, immunostained crypt cells are placed in the superficial layer of the sensory area. (b) Representative micrograph of lamellae exposed to 50 μg/L of Hg2+.(c) Representative micrograph of lamellae exposed to 100 μg/L of Hg2+. (d) Representative micrograph of lamellae exposed to 200 μg/L of Hg2+. Scale bar = 50 μm. (e) Density of crypt cells in lamellae of the whole olfactory rosette. (f) Density of crypt cells in lamellae of the dorsal region of the olfactory rosette. (g) Density of crypt cells in lamellae of the ventral region of the olfactory rosette. C, control, 0 μg/L Hg2+; LQ, low quantity, 50 μg/L Hg2+; MQ, medium quantity, 100 μg/L Hg2+; HQ, high quantity, 200 μg/L Hg2+. Asterisks indicate significant differences: *, p < 0.05; **, p < 0.01.
Anti-HuC/D antibody, specific for both mature and immature neurons, stained the olfactory epithelium from the basal to the apical layer (Figs. 10a–10d). In the whole rosette, as well as in both its dorsal and ventral halves, no significant change in OD was observed between the four fish groups (Figs. 10e–10g).

Fig. 10. HuC/D immunohistochemistry in zebrafish olfactory epithelium before and after 50, 100, and 200 μg/L Hg2+ exposure. (a) In control fish, all the neurons located in the sensory regions of the olfactory lamellae show clear immunopositive cell bodies. (b) Representative micrograph of lamellae exposed to 50 μg/L of Hg2+.(c) Representative micrograph of lamellae exposed to 100 μg/L of Hg2+. (d) Representative micrograph of lamellae exposed to 200 μg/L of Hg2+. Scale bar = 50 μm. (e) Optical density analysis of the olfactory epithelium overlaying lamellae in the whole olfactory rosette. (f) Optical density analysis of the olfactory epithelium in the dorsal area of the olfactory rosette. (g) Optical density analysis of the olfactory epithelium in the ventral area of the olfactory rosette. C, control, 0 μg/L Hg2+; LQ, low quantity, 50 μg/L Hg2+; MQ, medium quantity, 100 μg/L Hg2+; HQ, high quantity, 200 μg/L Hg2+.
In the olfactory lamellae, anti-PCNA stained cells undergoing mitotic events reside specifically in the regions bordering the sensory epithelium and also in its basal layer (Figs. 11a–11d). In the whole rosette, as well as in its dorsal half, exposure to Hg2+ showed no significant differences between the four groups of fish (Figs. 11e, 11f). When the statistical analysis was restricted to the ventral half of the rosette, Hg2+ exposure resulted in a significant increase of mitotic cell density between HQ and the three other groups in the basal layer of the sensory region, while interlamellar curves and the border between sensory and nonsensory epithelium appeared not to be affected (Fig. 11g).

Fig. 11. PCNA immunohistochemistry in zebrafish olfactory epithelium before and after 50, 100, and 200 μg/L Hg2+ treatment. (a) In olfactory lamellae of control specimen, mitotic cells are visible in the sensory area of the olfactory epithelium. (b) Representative micrograph of lamellae exposed to 50 μg/L of Hg2+. (c) Representative micrograph of lamellae exposed to 100 μg/L of Hg2+. (d) Representative micrograph of lamellae exposed to 200 μg/L of Hg2+. Scale bar = 50 μm. (e) Density of dividing cells in the olfactory epithelium covering lamellae in the whole olfactory rosette. Dark gray bars represent the density of PCNA+-cells in the basal layer of the olfactory epithelium, while light gray bars represent the density of PCNA+-cells in interlamellar curves and the border between sensory and nonsensory regions. (f) Density of dividing cells in the olfactory epithelium of the dorsal half of the olfactory rosette. (g) Density of dividing cells in the olfactory epithelium of the ventral half of the olfactory rosette. C, control, 0 μg/L Hg2+; LQ, low quantity, 50 μg/L Hg2+; MQ, medium quantity, 100 μg/L Hg2+; HQ, high quantity, 200 μg/L Hg2+. Asterisks indicate significant differences: *, p < 0.05; **, p < 0.01.
Discussion
In the olfactory epithelium of zebrafish, the immunohistochemical markers investigated allowed the identification of three main populations of OSNs with differential response to Hg2+ ions at different concentrations. In the whole olfactory rosette, the OD of G α olf, indicative for cOSNs, results significantly reduced compared to control only for MQ (22%) and HQ (30%). When compared to each other, the OD of cOSNs at the three used Hg2+ concentrations shows values for MQ and HQ significantly lower than LQ (17 and 26%, respectively), indicative for dose dependency. The response of cOSNs to MQ and HQ exposure results dose-independent since OD differences between MQ and HQ turn out to be statistically nonsignificant. The response of cOSNs appears dose-independent also for Ni2+ exposure, as previously reported (Lazzari et al., Reference Lazzari, Bettini, Milani, Maurizii and Franceschini2019). When the dorsal and ventral half of the olfactory rosette are separately evaluated after Hg2+ exposure, the condition of the OD for the dorsal region resembles the outcome for the entire organ. On the contrary, the ventral region of the olfactory rosette shows no significant differences between the four groups of fish. The reasons, as well as the functional relevance of these regional differences in the olfactory organ, are still unclear and require detailed studies. A hypothesis could involve different dynamics of water circulation inside the olfactory chamber, which could differentially expose OSNs to pollutants dissolved in the water. Indeed, in the ventral region of the olfactory rosette, cOSNs could be somehow less exposed to pollutants, as, for example, the water flow entering the olfactory chamber encounters first the lamellae of the dorsal half of the olfactory rosette. Also, different subpopulations of cOSNs, having different sensitivity to Hg2+ ions, may be present in different regions of the olfactory organ. By comparing the results on Ni2+ and Hg2+ exposures, we may suppose that cOSNs have higher Ni2+ susceptibility in the ventral zone of the olfactory rosette, whereas Hg2+ susceptibility prevails in the dorsal zone (Lazzari et al., Reference Lazzari, Bettini, Milani, Maurizii and Franceschini2019). Subpopulations of olfactory neurons appear to exist also in other fish species as in the case of crypt cells in Poecilia reticulata (Bettini et al., Reference Bettini, Milani, Lazzari, Maurizii and Franceschini2017).
In the whole olfactory rosette after Hg2+ exposure, OD for TRPC2, indicative for mOSNs, shows a statistically significant decrease at each metal concentration tested, with a mean value of 49% compared to control. OD values for LQ and MQ are statistically equivalent, but both of them show relevant dose effects compared to HQ. Therefore, similarly to that obtained for Gα olf (cOSNs), the response for TRPC2 (mOSNs) is greater in the ventral region. The comparison between mean OD values for Gα olf and TRPC2 suggests that mOSNs are more sensitive to Hg2+ exposure than cOSNs. Since, instead, cOSNs are more susceptible than mOSNs when exposed to Cu2+ and Ni2+ (Lazzari et al., Reference Lazzari, Bettini, Milani, Maurizii and Franceschini2017, Reference Lazzari, Bettini, Milani, Maurizii and Franceschini2019), this new finding suggests a difference in the response of OSNs to different heavy metals.
Hentig & Byrd-Jacobs (Reference Hentig and Byrd-Jacobs2016) studied the effects of zinc on zebrafish OSNs with both morphological and functional approaches, showing differential impairment of fish OSN classes. In particular, ultrastructural analysis of epithelial surface with scanning electron microscopy showed that cOSNs are heavily affected, whereas mOSNs generally have no or smaller damage. Behavioral findings were in accordance with morphological evidence. In fact, after zinc exposure, the sensibility to amino acids, detected by mOSNs and initiating feeding behavior, was restored more quickly than the response to bile salts, detected by cOSNs and related to social cues. As suggested by Hentig & Byrd-Jacobs (Reference Hentig and Byrd-Jacobs2016), mOSNs may be considered a highly protected component of the olfactory system because they are connected to feeding response and satisfy an immediate need for the individual; instead, cOSNs, that mediate social behavior, may be seen to meet a less urgent necessity for individual survival and may therefore be more subject to damage. Thus, the observed variation can be seen as the outcome of diverse evolutionary forces affecting the OSN populations differently.
Differential impairment of fish OSN classes, even if with opposite findings, was reported applying a functional approach based on electro-olfactograms (EOG) after nickel exposure (Dew et al., Reference Dew, Azizishirazi and Pyle2014). EOG study on fathead minnows (Pimephales promelas) and yellow perch (Perca flavescens) shows that, in both species, nickel impairs mOSN function whereas there was no significant alteration of cOSN activity. The observed impairment caused by Ni on mOSN function could still represent a success for the individual if it forced fish to swim away from polluted areas in search of food. Based on the above reported functional studies, we may suggest that the preservation of mOSN activity cannot be considered a general feature but can vary after exposure to different metals and/or if considering different fish species.
The results with EOG on nickel exposure of Dew et al. (Reference Dew, Azizishirazi and Pyle2014) are in contrast with our findings in zebrafish (Lazzari et al., Reference Lazzari, Bettini, Milani, Maurizii and Franceschini2019), since immunohistochemistry revealed that both mOSNs and cOSNs are affected by Ni exposure, with OD reduction for Gα olf (specific for cOSNs) greater than OD reduction for TRPC2 (specific for mOSNs) (Lazzari et al., Reference Lazzari, Bettini, Milani, Maurizii and Franceschini2019). As a possible explanation for the observed difference between immunohistochemical and EOG results, we may suggest that, after metal exposure, OD reduction for each antigen can have a specific threshold beyond which a functional damage occurs. At the concentrations of 0.1 and 0.5 mg/L Ni2+ used by Dew et al. (Reference Dew, Azizishirazi and Pyle2014) and Lazzari et al. (Reference Lazzari, Bettini, Milani, Maurizii and Franceschini2019), both Gα olf and TRPC2 markers show a clear reduction of their OD values, but, after Ni2+ exposure, OD reduction for TRPC2 might exceed its damage-threshold value thus that EOG could indeed reveal alterations in mOSN activities. On the contrary, at the same Ni2+ concentrations, the reduction of OD for Gα olf might remain below its damage-threshold with consequently no effects detected in cOSN functions by EOG.
In immunohistochemical analysis, we reported that cOSNs appear more susceptible to Ni2+ than mOSNs because cOSNs have a greater percentage decrease of OD, compared to their control value, than mOSNs. Nevertheless, this percentage shift might be not sufficient to trigger functional alterations in cOSNs. Instead, in mOSNs, a smaller reduction of OD for Gα olf could be sufficient to exceed the damage-threshold value and generate functional damage. Interestingly, EOG recordings on copper-exposed fish (Dew et al., Reference Dew, Azizishirazi and Pyle2014) are in accordance with the histological analysis in goldfish (Kolmakov et al., Reference Kolmakov, Hubbard, Lopes and Canario2009) and zebrafish (Lazzari et al., Reference Lazzari, Bettini, Milani, Maurizii and Franceschini2017), with copper specifically affecting cOSNs. Taking all these observations into consideration, we believe that, in studies on metal toxicity, attention must be paid when comparing data obtained with the two types of investigations, since the changes detected by immunohistochemical analysis cannot be always directly compared to functional results. For completeness, it should be mentioned that incongruities among EOG studies also exist (Sandahl et al., Reference Sandahl, Baldwin, Jenkins and Scholz2007; Baldwin et al., Reference Baldwin, Tatara and Scholz2011). Differences in technical approaches, ions concentrations, exposition times, water chemistry, and intrinsic differences among fish species can explain the discrepancy reported in different electrophysiological investigations (Dew et al., Reference Dew, Wood and Pyle2012, Reference Dew, Azizishirazi and Pyle2014; Lari et al., Reference Lari, Razmara, Bogart, Azizishirazi and Pyle2019).
Another problem concerns the significance of the decrease in immunostaining intensity observed by densitometric analysis at the level of the apical processes of OSNs. This decrement may be indirect evidence of the reduction in the number of OSNs, therefore indicative of cell death. However, OD decrement could also derive from both a reduction in apical process number and a decrease in the expression of the protein chosen as a molecular marker. In the Indian major carp (Labeo rohita) exposed to sublethal concentrations of HgCl2, Ghosh & Mandal (Reference Ghosh and Mandal2014) analyzed the apical surface of the olfactory epithelium by scanning electron microscopy. These authors report toxicity responses in fish olfactory epithelium, in particular clumping and loss of cilia. Damage and loss of cilia with retention of microvilli were also described by Ribeiro et al. (Reference Ribeiro, Fernandes, Carvalho, Cardoso and Turcatti1995) in Trichomycterus brasiliensis after Hg2+ exposure and by Kolmakov et al. (Reference Kolmakov, Hubbard, Lopes and Canario2009) in goldfish after Cu2+ treatment. However, ultrastructural studies on zebrafish olfactory epithelium exposed to Hg2+ ions are still missing. These morphological studies are important since they could prove whether, also in zebrafish, exposure to mercury leads to cilia and/or microvilli reduction or complete disappearance of apical cell processes with probable cell death. In our immunohistochemical analysis, cell cilia are clearly present and stained in the apical/luminal surface of the olfactory epithelium. Therefore, in zebrafish exposed to the Hg2+ concentration tested, a reduction in Gα olf and TRPC2 expression could explain the decrement in OD values for these two markers on the still visible apical processes. This hypothesis would be in line with studies reporting that Cu2+ exposure could cause epigenetic modifications (Tilton et al., Reference Tilton, Tilton, Bammler, Beyer, Farin, Stapleton and Gallagher2008) and down-regulation of transcription of genes involved in olfactory signal transduction (Wang et al., Reference Wang, Bammler, Beyer and Gallagher2013b) without morphological damages and cell death. However, since, in the present study, Hg2+ exposure is also linked to a reduction in epithelium thickness and cell proliferation activity, we suggest that the reduction in the marker expressions can be in part related to cell death, as we hypothesized in a previous study on Cu2+ exposure (Lazzari et al., Reference Lazzari, Bettini, Milani, Maurizii and Franceschini2017).
Crypt cells are the third main population of OSNs located in the sensory epithelium covering the olfactory lamellae of fish olfactory rosette (Hansen & Zeiske, Reference Hansen and Zeiske1998; Hansen & Finger, Reference Hansen and Finger2000; Ferrando et al., Reference Ferrando, Bottaro, Gallus, Girosi, Vacchi and Tagliafierro2006; Lazzari et al., Reference Lazzari, Bettini, Ciani and Franceschini2007; Gayoso et al., Reference Gayoso, Castro, Anadón and Manso2011, Reference Gayoso, Castro, Anadón and Manso2012). This cell type is not present in the olfactory epithelium of tetrapods. For the localization of crypt cells, TrkA is the molecular marker now recognized as being specific for crypt cells of zebrafish (Catania et al., Reference Catania, Germanà, Laurà, Gonzalez-Martinez, Ciriaco and Vega2003; Ahuja et al., Reference Ahuja, Ivandić, Saltürk, Oka, Nadler and Korsching2013; Bettini et al., Reference Bettini, Lazzari, Ferrando, Gallus and Franceschini2016). Therefore, we used anti-TrkA in our studies on the cytological effects of heavy metals on crypt cells (Bettini et al., Reference Bettini, Lazzari, Ferrando, Gallus and Franceschini2016; Lazzari et al., Reference Lazzari, Bettini, Milani, Maurizii and Franceschini2017, Reference Lazzari, Bettini, Milani, Maurizii and Franceschini2019, present study). In the whole olfactory rosette, exposure to MQ and HQ Hg2+ causes a great decrease in crypt cell density, respectively of 49 and 67% compared to control. In the comparisons between each other, the cell density at the three Hg2+ concentrations applied shows values at MQ and HQ statistically lower than LQ (51 and 69%, respectively), indicating dose dependence. Conversely, when MQ and HQ exposure were compared, crypt cell density appears not significantly different, thus excluding dose dependence. Mercury concentration between LQ and MQ, and higher than HQ would be useful to investigate the existence of other dose-dependence conditions. When the dorsal and ventral regions of the olfactory rosette are examined separately, Hg2+ exposure affects both regions. However, a greater reduction appears in the ventral zone, with crypt cell densities at MQ and HQ of 56 and 75% lower than control, respectively. These density values, even lower than the measures for the whole olfactory rosette, indicate that the ventral half of the olfactory organ is severely affected by Hg2+ ions. Previous studies evaluated the response of crypt cells to Cu2+ and Ni2+ exposures (Lazzari et al., Reference Lazzari, Bettini, Milani, Maurizii and Franceschini2017, Reference Lazzari, Bettini, Milani, Maurizii and Franceschini2019). In both studies, the statistical analysis does not support any significant difference after metal exposure. Therefore, the conclusion was that Cu2+ and Ni2+, at least at the tested concentrations, do not seem to affect crypt cells (Lazzari et al., Reference Lazzari, Bettini, Milani, Maurizii and Franceschini2017, Reference Lazzari, Bettini, Milani, Maurizii and Franceschini2019). In these studies on Cu2+ and Ni2+ exposure, the authors hypothesized that the specific morphology of crypt cells can account for the lack of harmful effects on these cells. cOSNs and mOSNs have their cilia and microvilli arising from the dendritic apical region of the receptor neurons and are directly exposed to the water flux at the surface of the olfactory epithelium. This condition may account for the great susceptibility of cilia and microvilli to water pollutants. On the contrary, in crypt cells, both cilia and microvilli are present, but not directly immersed in the water flux inside the olfactory chamber (Lazzari et al., Reference Lazzari, Bettini, Ciani and Franceschini2007). In crypt cells, their cytoplasmic processes are included in a deep cavity at the apical zone of the cell. The narrow crypt hole opening into the olfactory chamber could be responsible for limiting the passage of substances, pollutants included, towards the inner cilia and microvilli. In the present study, a clear effect on crypt cells density could be related to a higher toxicity of mercury compared to copper and nickel.
In vertebrate olfactory epithelium, OSNs have a limited life span. Throughout life, mitotic proliferation takes place in the basal layer of the olfactory epithelium and next cell differentiation gives rise to new neurons substituting dead OSNs (Graziadei & Graziadei, Reference Graziadei and Monti Graziadei1979; Bettini et al., Reference Bettini, Ciani and Franceschini2006a). Under normal conditions, OSN populations remain unvaried because mature OSNs downregulate proliferation and differentiation that would substitute deceased elements (Wu et al., Reference Wu, Ivkovie, Murray, Jaramillo, Lyons, Johnson and Calof2003). In the olfactory epithelium exposed to Hg2+, the OD for HuC/D, indicative for the total neuronal population including undifferentiated elements, remains statistically constant revealing that substitution of dead cells is still working properly. On the other hand, the density of proliferating cells measured by anti-PCNA immunohistochemistry shows a tendency to increase that becomes statistically relevant only in the ventral half of the olfactory rosette where OD of TRPC2 and TrkA show a significant reduction. These immunohistochemical analyses appear to support each other in suggesting that a certain degree of cell death occurs in the populations of mature OSNs after Hg2+ exposure.
Another consideration regards the regions involved in active neurogenesis. Bayramli et al. (Reference Bayramli, Kocagöz, Sakizli and Fuss2017) and Calvo-Ochoa et al. (Reference Calvo-Ochoa, Byrd-Jacobs and Fuss2021) reported that the main sites of the proliferation of new olfactory neurons are the interlamellar curve and the sensory/nonsensory border, while the sensory epithelium does not contribute to constitutive cell turnover. mOSNs and cOSNs originate from both marginal sites; nonetheless, cOSNs seem to be prevalently generated in the interlamellar site, while mOSNs in the sensory/nonsensory border (Bayramli et al., Reference Bayramli, Kocagöz, Sakizli and Fuss2017). As a consequence, we could expect some density variations in the two parts of the olfactory organ, to regenerate the cOSNs lost in the dorsal rosette and the mOSNs in the ventral one. However, we did not observe a significant difference among treatments in the proliferative activity in these regions, while the increment is statistically evident in the basal layer of the sensory epithelium. Our finding is in line with Calvo-Ochoa et al. (Reference Calvo-Ochoa, Byrd-Jacobs and Fuss2021), who reported that, under regenerative conditions in response to damage, the horizontal basal cells (HBCs) in the basal layer of the olfactory sensory epithelium, normally dormant, are activated and start proliferating to expand the population of globose basal progenitor cells (GBCs).
We analyzed three types of OSNs that are intermingled in the OE. However, in zebrafish, it is known that different olfactory receptors segregate into distinct spatial subdomains (Weth et al., Reference Weth, Nadler and Korsching1996), and, recently, Ahuja et al. (Reference Ahuja, Reichel, Kowatschew, Syed, Kotagiri, Oka, Weth and Korsching2018) showed also distinctly different expression zones for some zebrafish V2R-related OlfC receptors. It could be interesting, even if beyond the scope of the present study, to analyze the effects of toxicants on the different subdomains, examining also if the migration of progenitors from the proliferative zones follows different pathways, as observed by Bayramli et al. (Reference Bayramli, Kocagöz, Sakizli and Fuss2017).
In previous studies on the effects of metal exposure, zebrafish (30 μg/L Cu2+, Lazzari et al., Reference Lazzari, Bettini, Milani, Maurizii and Franceschini2017, 0.1, 0.5, and 1 mg/L Ni2+, Lazzari et al., Reference Lazzari, Bettini, Milani, Maurizii and Franceschini2019) and Tilapia mariae (20 μg/L Cu2+, Bettini et al., Reference Bettini, Ciani and Franceschini2006b) preserved the structure of their olfactory rosettes and olfactory lamellae. Higher Cu2+ concentration gave rise to evident alterations in the olfactory epithelium of T. mariae (40 μg/L, Bettini et al., Reference Bettini, Ciani and Franceschini2006b) and in goldfish (0.05–6 mM, Kolmakov et al., Reference Kolmakov, Hubbard, Lopes and Canario2009). At present, information on morphological (histological and ultrastructural) effects of HgCl2 exposure in fish is restricted to Indian major carp, Labeo rohita (66 and 132 μg/L for 15 and 30-day exposure, Ghosh & Mandal, Reference Ghosh and Mandal2014). Further histological and ultrastructural studies can add more detailed information about the reaction of zebrafish OSNs to Hg2+ exposure. According to Ghosh & Mandal (Reference Ghosh and Mandal2014), we found that mercury exposure causes a proliferation and enlargement of round mucous cells in the olfactory epithelium of zebrafish. Most of them are opening to the luminal surface of the epithelium, showing that an enhancement in mucous secretion occurs. Acetylcholine secretion may be responsible for the upregulation of mucous secretion (Inglis et al., Reference Inglis, Corboz, Taylor and Ballard1997). Mucous film over the olfactory epithelium surface has the function of binding odorants and ions involved in the transduction of olfactory signals. However, when the mucous layer becomes excessive, it prevents pollutants from directly contacting the epithelial surface and decreases toxicity effects (Ghosh & Mandal, Reference Ghosh and Mandal2014), and the mucous can also bind and eliminate heavy metals from the system (Ray et al., Reference Ray, Ghosh and Mandal2012).
In the olfactory organ of Indian major carp, another manifestation of toxic effect is the significant increase of the olfactory epithelium thickness due to hyperplasia of basal cells and the appearance of vacuoles (Ghosh & Mandal, Reference Ghosh and Mandal2014). At the higher concentration tested (132 μg/L for 30 days), Ghosh & Mandal (Reference Ghosh and Mandal2014) found severe decrement of OSNs and tissue alteration with epithelium thickening due to hyperplasia of epithelial basal cells unable to differentiate in new OSNs and cyst formation. In the olfactory epithelium of zebrafish, as indicated by a limited increase in the density of anti-PCNA immunopositive cells, we suggest that mercury exposure affects less the normal cell cycle regulation. In zebrafish, the decrease in the OD for calretinin, which is indicative for a heterogeneous population of mature cOSNs and mOSNs, is in agreement with the decrease in OD for Gα olf and TRPC2.
Although no specific study is at present available on the effects of Hg2+ on nonneuronal cells of the olfactory epithelium, the lack of severe histological alterations throughout tissue appears in favor of a predominant involvement of OSNs, at least at the Hg2+ concentration tested. This is in agreement with previous studies on the effect of Cu2+ and Ni2+ on zebrafish olfactory organs (Lazzari et al., Reference Lazzari, Bettini, Milani, Maurizii and Franceschini2017, Reference Lazzari, Bettini, Milani, Maurizii and Franceschini2019). As for Ni2+ exposure, in contrast to Cu2+ treatment, zebrafish olfactory epithelium does not show any increase in sensory area compared to control by the action of Hg2+. Behavioral and electrophysiological studies of Cu2+ action in Colorado pikeminnow (Ptychocheilus lucius) (Beyers & Farmer, Reference Beyers and Farmer2001) and fathead minnow (Pimephales promelas) (Dew et al., Reference Dew, Wood and Pyle2012) suggested that sensory area growth was associated with functional recovery. In this respect, new specific studies could clarify existence, extension, and process of neuronal recovery following Hg2+ treatment.
In our experiments, according to the sublethal level of the tested concentrations, only HQ exposure caused a fish mortality rate of 10%. This is consistent with a 30–35% death rate at 220 μg/L HgCl2 reported by Ung et al. (Reference Ung, Lam, Hlaing, Winata, Korzh, Mathavan and Gong2010).
Little is known about the mechanism of olfaction impairment by mercury. Passow et al. (Reference Passow, Rothstein and Clarkson1961) attributed the inhibition of active transport and other cell functions to mercury affinity for sulfhydryl groups on the cell membrane. Following mercury chloride exposure, Richetti et al. (Reference Richetti, Rosemberg, Ventura-Lima, Monserrat, Bogo and Bonan2011) hypothesize a signal transmission impairment through alterations in cholinergic transmission and in the antioxidant competence of nervous tissue.
Conclusions
The immunohistochemical analysis of the olfactory epithelium shows that Hg2+ exposure clearly affects the expression pattern of the molecular markers of the different OSN types. Interestingly, the different OSNs respond differentially to Hg2+ exposure at the sublethal concentration tested. In particular, mOSNs are the most susceptible with a mean reduction of TRPC2 OD of 49% compared to control, against a 19% decrease of Gα olf OD for cOSNs, and a 37% drop of crypt cell density measured by anti-TrkA staining. These variations show some dose-dependent effects, in particular for TRPC2 OD values. Therefore, immunohistochemical analysis differentiates OSNs by Hg2+ sensitivity: mOSNs, crypt cells, and cOSNs, going from the most susceptible to the least. These immunohistochemical results differ from studies on fish exposure to other metals, in which cOSNs resulted more susceptible than mOSNs (Kolmakov et al., Reference Kolmakov, Hubbard, Lopes and Canario2009; Dew et al., Reference Dew, Azizishirazi and Pyle2014; Ghosh & Mandal, Reference Ghosh and Mandal2014; Lazzari et al., Reference Lazzari, Bettini, Milani, Maurizii and Franceschini2017, Reference Lazzari, Bettini, Milani, Maurizii and Franceschini2019). Moreover, in zebrafish, crypt cells appeared not statistically modified by Cu2+ and Ni2+ exposures (Lazzari et al., Reference Lazzari, Bettini, Milani, Maurizii and Franceschini2017, Reference Lazzari, Bettini, Milani, Maurizii and Franceschini2019), whereas the effect of Hg2+ on crypt cells is evident also at the lowest concentration.
In zebrafish, Hg2+ exposure revealed that cOSNs were more susceptible in the dorsal region, whereas mOSNs were more affected in the ventral area; this is different from the response to Ni2+ exposure that was greater in the ventral half of zebrafish olfactory organ for both cOSNs and mOSNs (Lazzari et al., Reference Lazzari, Bettini, Milani, Maurizii and Franceschini2019). We can hypothesize that different subpopulations of receptor cells inside each main type of OSNs may be responsible for the detected regional differences. This hypothesis needs further investigation.
Despite the changes in tissue staining described in this study, immunohistochemical methods, per se, do not provide information on functional and ecological outcomes of metal exposure. Different functions characterize cOSNs, mOSNs, and crypt cells (Sato & Suzuki, Reference Sato and Suzuki2001; Hamdani & Døving, Reference Hamdani and Døving2006; Vielma et al., Reference Vielma, Ardiles, Delgado and Schmachtenberg2008; Bazáes & Schmachtenberg, Reference Bazáes and Schmachtenberg2012; Ahuja et al., Reference Ahuja, Ivandić, Saltürk, Oka, Nadler and Korsching2013; Biechl et al., Reference Biechl, Tietje, Gerlach and Wullimann2016). Various studies concern behavioral effects resulting from Cu2+ exposure (Scott & Sloman, Reference Scott and Sloman2004; Tilton et al., Reference Tilton, Bammler and Gallagher2011; Svecevičius, Reference Svecevičius2012; Poulsen et al., Reference Poulsen, Svendsen, Aarestrup and Malte2014; Sovová et al., Reference Sovová, Boyle, Sloman, Vanegas Pérez and Handy2014; da Silva Acosta et al., Reference da Silva Acosta, Danielle, Altenhofen, Luzardo, Gomes Costa, Bianchini, Bonan, Souza da Silva and Dafre2016; Simonato et al., Reference Simonato, Mela, Doria, Guiloski, Randi, Carvalho, Meletti, Silva de Assis, Bianchini and Martinez2016) and Ni2+ treatment (Dew et al., Reference Dew, Azizishirazi and Pyle2014, Reference Dew, Veldhoen, Carew, Helbing and Pyle2016). It should also be pointed out that, at present, no molecule acting as a specific activator of crypt cells is known, and this complicates the set up of behavioral investigations for this cell type. Also, when considering the behavioral implications of contaminants on the overall olfactory sensing of fish, we should remember that olfactory function impairment could reasonably derive from a combination of effects of pollutants on OSN types, on sensory integration circuits, and on effector organs (Abu Bakar et al., Reference Abu Bakar, Mohd Sata, Ramlan, Wan Ibrahim, Zulkifli, Che Abdullah, Ahmad and Amal2017; Amorim et al., Reference Amorim, Fernandes, Vasconcelos and Teles2017). Further studies analyzing transcriptomic profiles of the olfactory mucosa under different exposure conditions, as well as electro-olfactographic and behavioral effects resulting from mercury exposure, will significantly increase our knowledge about the mechanism of action of this metal in fish olfaction impairment.
Financial support
This work was supported by national public funds grant RFO2017FRANCESCHINI from the Italian Ministry of University and Research (MUR).
Conflicts of interest
The authors declare that they have no conflicts of interest.


 Open access