


Mining is among the human activities that generates the greatest environmental damage (Paraguassú et al. Reference Paraguassú, Mariangela Leite and Mendonça2019) and among the productive activities most intensive in water use (Burritt and Christ Reference Burritt and Christ2018). Water is a scarce resource in areas where there is mining activity (Santana et al. Reference Santana, Diango Montalván, Luzardo, Velasco and de Jesus2020), which may explain the growing protests against the expansion and practices of some mining companies (Taylor and Bonner Reference Taylor and Bonner2017). This is especially so in Chile, for the aridity of its mining areas, which reduces current and future availability of water for human consumption and agricultural use (Pizarro et al. Reference Pizarro, Vergara, Rodríguez and Valenzuela2010). Consequently, the economic evaluation of the impacts of mining on surface water bodies is critical to properly managing these resources and correcting the negative externalities generated.
The primary mining activity in Chile is copper, whose production reached 5.8 million fine metric tons in 2019. Furthermore, Chilean copper production represents almost a third of the world’s production (de Solminihac, Gonzales, and Cerda Reference de Solminihac, Gonzales and Cerda2018). Copper mining operations are located mainly in the northern part of the country, in places with limited water supply (Pino-Vargas, Montalvan-Díaz, and Avendaño-Jihuallanga Reference Pino-Vargas, Montalvan-Díaz and Avendaño-Jihuallanga2019). This has generated overexploitation of water resources, as the consumption of water by the mining sector can represent more than 50% of total consumption in northern Chile (Aitken et al. Reference Aitken, Rivera, Godoy-Faúndez and Holzapfel2016). However, at the national level, water consumption by the mining sector reaches only 3%, according to the General Water Directorate (Dirección General de Aguas).Footnote 1
Water pollution in mining is mainly explained by heavy metal discharges that affect water quality (Northey et al. Reference Northey, Gavin Mudd, Haque and Yellishetty2019) and erosion in exposed soils that generate sediments in surface waters (Bokar et al. Reference Bokar, Traoré, Mariko, Diallo, Traoré, Sy and Soumaré2020). In Chile, mining operations discharge arsenic and copper into surface waters. These pollutants are toxic, cumulative, and persistent, altering water quality even decades after the closure of mining operations (Baeten, Langston, and Lafreniere Reference Baeten, Langston and Lafreniere2018). Metalloids and heavy metals pollution on hydric resources imply severe risks for the ecosystem and human health (Santana Reference Santana, Diango Montalván, Luzardo, Velasco and de Jesus2020; Reis et al. Reference Reis, Leonardo Santos, de Pinho and Montes2019).
Some studies have suggested that mining discharges can explain the increase in the concentrations of copper, arsenic, and other pollutants in rivers of north-central Chile (Ribeiro et al. Reference Ribeiro, Kretschmer, Joao Nascimento and Tobias Rötting2014; Pizarro et al. Reference Pizarro, Vergara, Rodríguez and Valenzuela2010; Oyarzún et al. Reference Oyarzún, Guevara, Oyarzún, Lillo, Maturana and Higueras2006; Dittmar Reference Dittmar2004). However, it is challenging to link mining discharges to concentrations in surface waters since high concentrations could also be associated with natural conditions (Bokar et al. Reference Bokar, Traoré, Mariko, Diallo, Traoré, Sy and Soumaré2020), pollution from agriculture (Donoso, Cancino, and Magri Reference Guillermo, Cancino and Magri1999), and abandoned tail deposits from old mining activities (Oyarzún et al. Reference Oyarzún, Daniella Castillo, Nicole Kretschmer and Amezaga2012). Consequently, it is necessary to establish how mining production changes the concentrations of pollutants in water bodies to identify the damage generated by the activity (Valenzuela-Díaz et al. Reference Valenzuela-Diaz, Alvaro Navarrete-Calvo, James McPhee, Correa-Burrows and Navarro-Valdivia2020) and thus avoid attributing environmental damage to the natural conditions of the study area. This study economically evaluates the externalities to health and agricultural production caused by copper mining in the regions of Coquimbo, Valparaíso, and O’Higgins in Chile. Specifically, the effects of arsenic and copper discharges on surface water bodies are quantified through the impact pathway approach, which has been widely used in the literature to evaluate the impact of atmospheric pollutant emissions (Swärdh and Genell Reference Swärdh and Genell2020; Mardones and Mena Reference Mardones and Mena2020; Mardones and del Rio Reference Mardones and del Rio2019; Silveira et al. Reference Silveira, Peter Roebeling, Joana Ferreira, Teixeira, Borrego and Miranda2016).
Although the methods for quantifying the impacts of water use have developed significantly over the past decade, few studies have applied these methods to mining activity, as there is limited understanding of their impacts on water resources (Northey et al. Reference Northey, Cristina Madrid, Mudd and Yellishetty2018). Ossa-Moreno et al. (Reference Ossa-Moreno, Neil McIntyre, James Smart, Lall and Keir2018) state that the application of hydro-economic analysis in mining regions is scarce for lack of data, which is a general problem for hydro-economic models. However, the lack of data is particularly challenging for mining regions, as ores are typically found in remote areas with few long-term climate observations. Also, there is uncertainty about the impacts after closure of operations, difficulty in accounting for cumulative impacts, extreme events such as floods, dam failures, and infiltrations (Northey et al. Reference Northey, Gavin Mudd, Wessman-Jääskeläinen and Haque2016). In contrast, mining companies tend to be confidential about economic and environmental data at the project level. Consequently, few studies relate economics and water resources in mining, so more studies in this area are essential to improve water use.
Material and methods
Mining activity in Chile
Mining is the engine of exports in Chile and other Latin American countries (Manky Reference Manky2019). In Chile, copper production is carried out by three types of companies: large-scale mining, represented by private companies and the state company CODELCO, which contribute with 96% of national production; medium-sized mining, represented by mainly national companies that contribute 3%; and small mining that contributes 1%.Footnote 2
After identifying the main mining operations in this country (Figure 1), it is necessary to determine the mining discharges to surface waters, including their location, concentration, and effect on the receiving water body. For this, the web pages of the different mining operations, government information reported by the Pollutant Emissions and Transfer Register (Registro de Emisiones y Transferencias de Contaminantes, RETC),Footnote 3 and reports from the Superintendency of the Environment (Superintendencia del Medio Ambiente, or SMA) requested through the Transparency Portal (Portal de Transparencia) were consulted. Footnote 4 Also, information was reviewed about the concentration of pollutants in the receiving water body at the discharge points through the reports of the DGA. Footnote 5 Based on the scant information available, it was possible to determine that Coquimbo, Valparaíso, and O’Higgins regions are the only ones for which there is information that allows for the study of mining activity, wastewater discharges, and concentrations of pollutants such as arsenic and copper. Specifically, there are data for the operations of the Tres Valles mine and Panulcillo mine in the Coquimbo region, which began operations in 2011 and 1848, respectively. There are also data for the Andean Division (División Andina) of CODELCO, which began operations in 1970 in the Valparaíso region, and for the El Teniente mine in the O’Higgins region, whose industrial operations began in 1905.
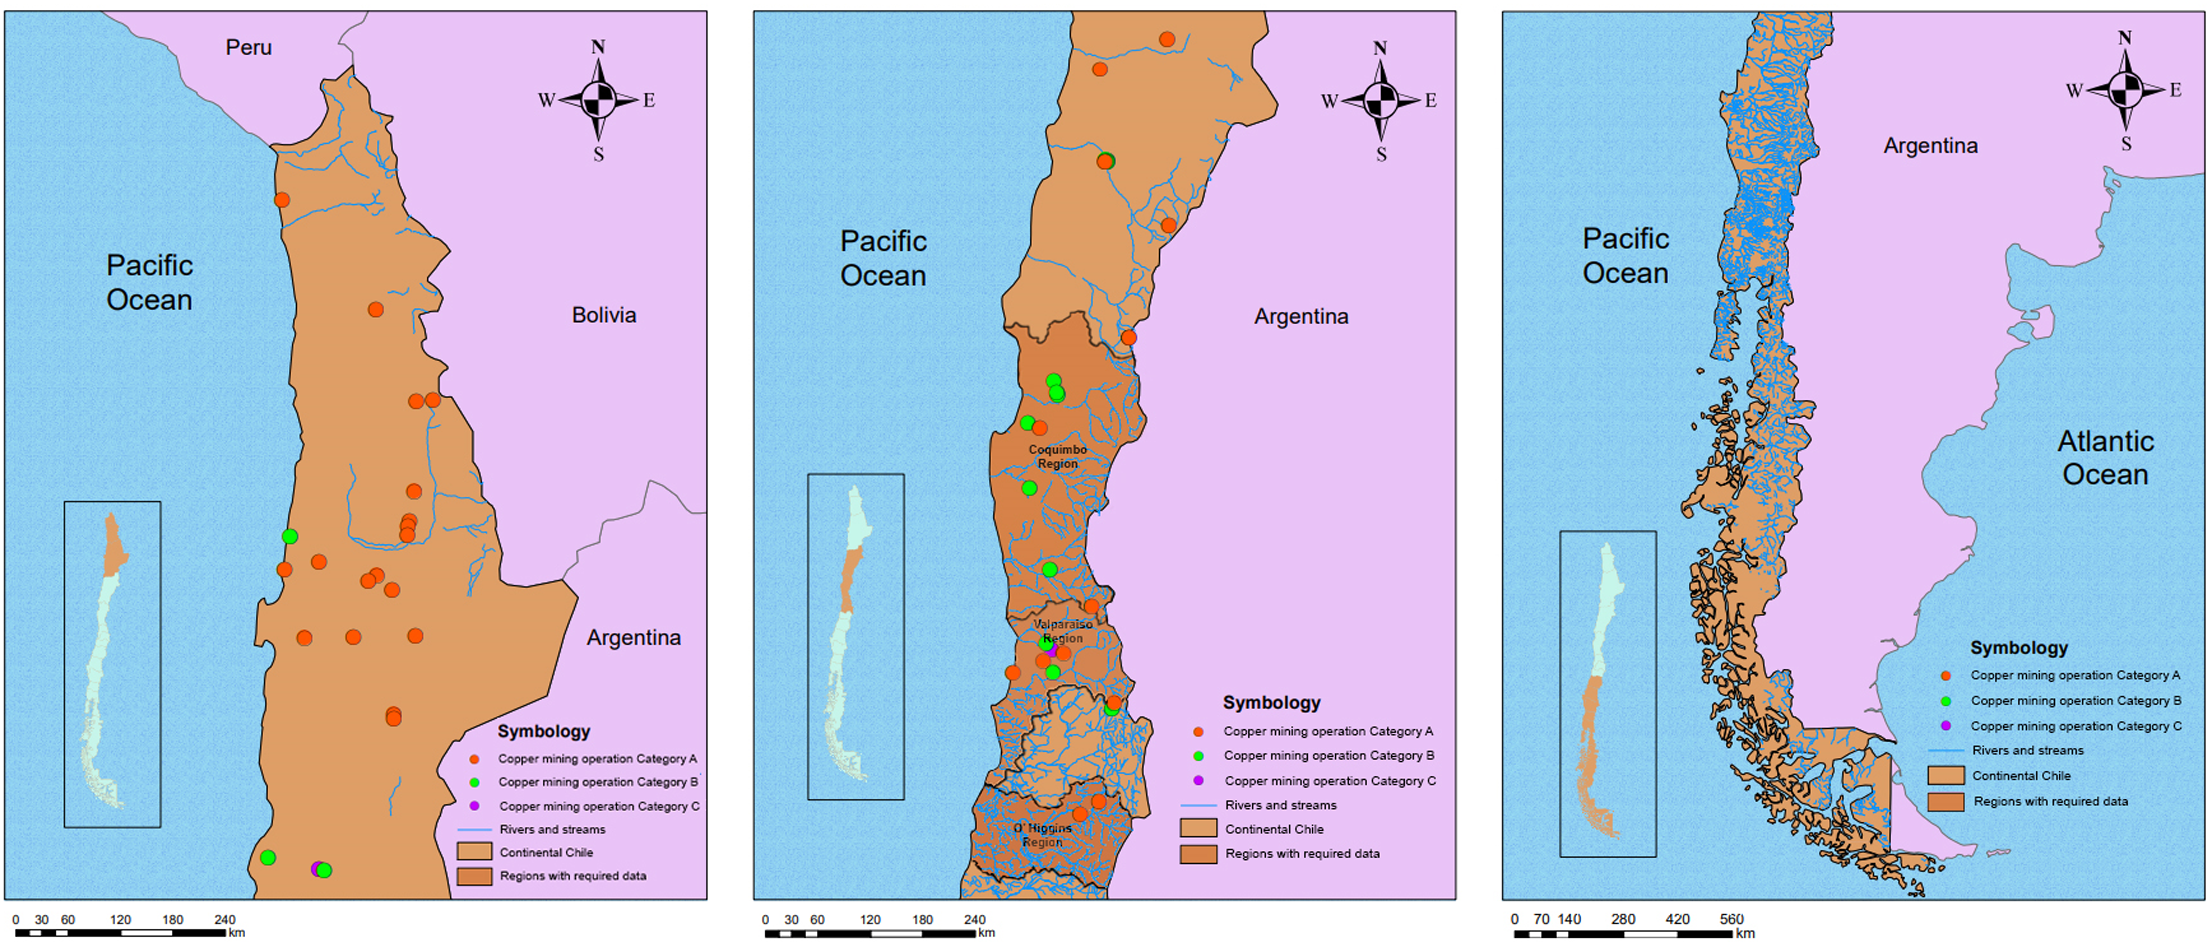
Figure 1. A geographic analysis of copper mining operations in Chile.
Mining activity and data in Coquimbo
In the Coquimbo region the total copper production was 487,396 fine metric tons in 2019. In this region, Panulcillo, Pelambres, and Carmen de Andacollo mining operations are category A, while Tres Valles, Coca-Cola, Altos de Punitaqui, 21 de Mayo, La Bocona, and Tambillos mining operations are category B.Footnote 6 Based on the review of the limited information available for all mining operations, the following conclusions can be obtained. The Tres Valles mine is located in the middle course of the Choapa River and began its production in 2010. The RETC only reports mining discharges for 2013–2018, but the SMA reports mining discharges for 2016–2018. However, in the DGA, there is no information regarding the monitoring points and data on the concentrations of pollutants in the receiving water body. Table 1 shows the tons of copper (Cu) and arsenic (As) discharged reported by the RETC and the annual average concentration (mg/l) in the discharge flow monitored by the SMA.
Table 1. Mining production and discharges of As and Cu generated by Tres Valles mine.

Source: SMA, COCHILCO, CODELCO, and RETC.
Note: Not available (NA).
The data in Table 1 allow estimating functions that relate the production of the Tres Valles (thousands of fine metric tons) to discharges of As (ton) and Cu (ton), as described in the following equations (standard errors in parentheses):
 $$\matrix{ {Discharges\;of\;As\;\left( {ton} \right) = 0.0000152{\mkern 1mu} {\rm{*}}{\mkern 1mu} Production\;\;\;{{\rm{R}}^2} = 0.6729} \cr
{\left( {0.00000475} \right)} \cr } $$
$$\matrix{ {Discharges\;of\;As\;\left( {ton} \right) = 0.0000152{\mkern 1mu} {\rm{*}}{\mkern 1mu} Production\;\;\;{{\rm{R}}^2} = 0.6729} \cr
{\left( {0.00000475} \right)} \cr } $$
 $$\matrix{ {Discharges\;of\;Cu\;\left( {ton} \right) = 0.0001897{\mkern 1mu} {\rm{*}}{\mkern 1mu} Production\;\;\;{{\rm{R}}^2} = 0.6465} \cr
{\left( {0.0000627} \right)} \cr } $$
$$\matrix{ {Discharges\;of\;Cu\;\left( {ton} \right) = 0.0001897{\mkern 1mu} {\rm{*}}{\mkern 1mu} Production\;\;\;{{\rm{R}}^2} = 0.6465} \cr
{\left( {0.0000627} \right)} \cr } $$
In Equations 1 and 2, there is a positive and statistically significant relationship between copper production (thousands of fine metric tons) and discharges (ton).
Pelambres mining company informs in its sustainability report that the operation does not discharge into surface waters.Footnote 7 However, the surface waters adjacent to the mining facility (Choapa River basin) have historically presented low pH levels and high levels of metals (Parra et al. Reference Parra, Jorge Oyarzún, Kretschmer, Meza and Oyarzún2011).
In the case of the Panulcillo mining company, there are no official data on possible discharges of As and Cu. However, a report made for the DGA determines a change in Cu concentration upstream and downstream of the Limarí River.Footnote 8 Specifically, the measurements are 0.18 mg/l upstream and 5.3 mg/l downstream; that is, 5.12 mg/l variation attributed to this mining operation. A 2016 report carried out by the National Mining Company (Empresa Nacional de Minería, ENAMI) states that copper concentrates corresponding to the Panulcillo mine is 50,000 tons, which is equivalent to approximately 180,000 fine metric tons of copper by year.Footnote 9
Following previous data, this study assumes that each fine metric ton of copper produced by the Panulcillo mining operation raises the concentrations of Cu by 0.00002844 mg/l in the waters of the Limarí River (5.12 mg/l divided by 180,000 tons). In the absence of data to establish the As concentrations contributed by the Panulcillo mining operation, data from the mining operations in the Valparaíso and O’Higgins region are used to extrapolate a relationship between As and Cu concentrations in Panulcillo.
Mining activity and available data in Valparaíso
In the Valparaíso region, there are eight mining operations, of which five correspond to copper exploitation.Footnote 10 This region contributes 3.2% to the national production of copper, with 253,135 fine metric tons in 2019.Footnote 11 The main copper mining operation in the Valparaíso region corresponds to the Andina Division of CODELCO in the Los Andes district. The Andina Division exploits this mineral in the Río Blanco underground mine and the South-South open-pit mine in the Andes mountain range at over 3,000 meters above sea level. The copper is then transported by rail to CODELCO’s Ventanas Smelter, located on the coast and north of the Puchuncaví district. The geographic locations of the wastewater discharge points were obtained from the RETC and CODELCO sustainability reports.Footnote 12
According to the information reported by CODELCO, the Andina Division carries out mining discharges in the Río Blanco, which belongs to the Aconcagua River basin. A report prepared to the DGA affirms that the points affected by the mining discharges are Central Hidroeléctrica and Río Blanco (CADE 2004). From the DGA, it is only possible to obtain geochemistry information at the Río Blanco point. The RETC does not record mining discharges from the Andina Division, while the SMA reports mining discharges from 2014 to 2018. Table 2 shows the flow rate and concentrations of Cu and As in the annual discharges generated by the Andina Division, as well as the annual averages for geochemistry, flow rate, and precipitation reported by the DGA at the discharge receiving point Río Blanco.
Table 2. Mining production, discharges, and concentrations of the Andina Division and geochemistry of the Blanco River.

Source: Based on data from COCHILCO, SMA, CODELCO, and DGA.
Note: Not available (NA).
It should be noted that there are no data on mining discharges registered in the RETC or SMA regarding other mining operations in the Valparaíso region. However, according to the SMA, Ventanas Smelter records wastewater discharges on the shores of this region between 2017 and 2019. The effects on sea waters that the Ventanas Smelter generates are not economically quantified in this study because there are no data to determine the impact on the volume of marine resources affected, extracted, and marketed, nor the cumulative effect on the population’s health due to the possible consumption of these products.
The data reported in Table 2 were used to estimate a linear regression between copper production and discharges of Cu and As on surface water bodies.Footnote 13 In Equation 3, there is a positive and statistically significant relationship between copper production (thousands of fine metric tons) and discharges of Cu (ton). In Equation 4, there is a positive and statistically significant relationship between copper production (thousands of fine metric tons) and discharges of As (ton) (standard errors in parentheses). Consequently, both equations make it possible to project As and Cu discharges from the production volume in periods with no available data, for example, 2013.
 $$\matrix{ {Discharges\;of\;Cu = 0.0038997*Production\;\;\;{R^2} = 0.05} \cr {(0.0004671)} \cr } $$
 $$\matrix{ {Discharges\;of\;As = 0.003167*Production\;\;\;{R^2} = 0.94} \cr {(0.0000425)} \cr } $$
Mining activity and available data in O’Higgins
The following mining operations are in the O’Higgins region: División El Teniente of CODELCO and Valle Central Mine. The División El Teniente owns the largest underground copper mine globally, which is in the Andes mountains range, between 2,200 and 3,200 meters above sea level. It also has a surface operation that began operations in 2012. The División El Teniente industrial complex’s primary operations are the mines and the Caletones smelter, which reached 459,744 fine metric tons of copper during 2019.Footnote 14 Valle Central Mine is in charge of processing mining tailings mainly from the División El Teniente. Table 3 shows the mining discharges (ton/year) and production (thousands of fine metric tons/year) of División El Teniente based on data obtained from the RETC and CODELCO, as well as the concentrations and precipitation recorded by the DGA at the Río Coya point.
Table 3. Mining production, discharges, concentrations, and geochemistry of the Coya River.

Source: COCHILCO, RETC, CODELCO, and DGA.
Note: Not available (NA).
Copper production (thousands of fine metric tons) is related to discharges of Cu (ton) and As (ton) through linear regressions with the data reported in Table 3. The coefficients estimated in Equations 5 and 6 are used in the impact pathway approach to determine the effects of mining production on the discharges of As and Cu. Specifically, in the years for which there is information on mining production, but there are no official discharge records.
 $$\matrix{ {Discharges\;of\;Cu = 197646.9 + 9.096003*Production - 100.1369*Year\quad {R^2} = 0.62} \hfill \cr
{\left( {52005.6} \right)\;\;\;\left( {3.197963} \right)\;\;\;\;\;\;\;\;\;\;\;\;\;\;\;\;\;\;\;\;\;\;\quad \quad \quad \quad \quad \quad \quad \quad \quad \left( {26.43251} \right)\;\;\;\;\;\;\;\;\;\;\;\;\;\;\;\;\;\;\;\;\;\;\;\;\;\;\;\;\;\;\;\;\;\;\;} \hfill \cr } $$
$$\matrix{ {Discharges\;of\;Cu = 197646.9 + 9.096003*Production - 100.1369*Year\quad {R^2} = 0.62} \hfill \cr
{\left( {52005.6} \right)\;\;\;\left( {3.197963} \right)\;\;\;\;\;\;\;\;\;\;\;\;\;\;\;\;\;\;\;\;\;\;\quad \quad \quad \quad \quad \quad \quad \quad \quad \left( {26.43251} \right)\;\;\;\;\;\;\;\;\;\;\;\;\;\;\;\;\;\;\;\;\;\;\;\;\;\;\;\;\;\;\;\;\;\;\;} \hfill \cr } $$
 $$\matrix{ {Discharges\;of\;As = 2388.8 + 0.1119063*Production - 1.210544*Year\quad {R^2} = 0.54} \hfill \cr
{\left( {749.15} \right)\;\;\left( {0.0460671} \right){\mkern 1mu} {\mkern 1mu} {\mkern 1mu} {\mkern 1mu} {\mkern 1mu} {\mkern 1mu} {\mkern 1mu} {\mkern 1mu} {\mkern 1mu} {\mkern 1mu} {\mkern 1mu} {\mkern 1mu} {\mkern 1mu} {\mkern 1mu} {\mkern 1mu} {\mkern 1mu} {\mkern 1mu} {\mkern 1mu} {\mkern 1mu} {\mkern 1mu} {\mkern 1mu} {\mkern 1mu} {\mkern 1mu} {\mkern 1mu} {\mkern 1mu} {\mkern 1mu} {\mkern 1mu} {\mkern 1mu} {\mkern 1mu} {\mkern 1mu} {\mkern 1mu} {\mkern 1mu} {\mkern 1mu} {\mkern 1mu} {\mkern 1mu} {\mkern 1mu} {\mkern 1mu} {\mkern 1mu} {\mkern 1mu} {\mkern 1mu} {\mkern 1mu} {\mkern 1mu} {\mkern 1mu} {\mkern 1mu} {\mkern 1mu} {\mkern 1mu} {\mkern 1mu} {\mkern 1mu} {\mkern 1mu} {\mkern 1mu} {\mkern 1mu} {\mkern 1mu} {\mkern 1mu} {\mkern 1mu} {\mkern 1mu} \quad \quad \quad \quad \quad \quad \quad \quad \quad \quad \quad \quad \left( {0.3807643} \right)} \hfill \cr } $$
$$\matrix{ {Discharges\;of\;As = 2388.8 + 0.1119063*Production - 1.210544*Year\quad {R^2} = 0.54} \hfill \cr
{\left( {749.15} \right)\;\;\left( {0.0460671} \right){\mkern 1mu} {\mkern 1mu} {\mkern 1mu} {\mkern 1mu} {\mkern 1mu} {\mkern 1mu} {\mkern 1mu} {\mkern 1mu} {\mkern 1mu} {\mkern 1mu} {\mkern 1mu} {\mkern 1mu} {\mkern 1mu} {\mkern 1mu} {\mkern 1mu} {\mkern 1mu} {\mkern 1mu} {\mkern 1mu} {\mkern 1mu} {\mkern 1mu} {\mkern 1mu} {\mkern 1mu} {\mkern 1mu} {\mkern 1mu} {\mkern 1mu} {\mkern 1mu} {\mkern 1mu} {\mkern 1mu} {\mkern 1mu} {\mkern 1mu} {\mkern 1mu} {\mkern 1mu} {\mkern 1mu} {\mkern 1mu} {\mkern 1mu} {\mkern 1mu} {\mkern 1mu} {\mkern 1mu} {\mkern 1mu} {\mkern 1mu} {\mkern 1mu} {\mkern 1mu} {\mkern 1mu} {\mkern 1mu} {\mkern 1mu} {\mkern 1mu} {\mkern 1mu} {\mkern 1mu} {\mkern 1mu} {\mkern 1mu} {\mkern 1mu} {\mkern 1mu} {\mkern 1mu} {\mkern 1mu} {\mkern 1mu} \quad \quad \quad \quad \quad \quad \quad \quad \quad \quad \quad \quad \left( {0.3807643} \right)} \hfill \cr } $$
Relationship between discharges and concentrations
The data reported in Tables 2 and 3 were also used to estimate panel data regressions that relate the discharges (ton) and concentrations (mg/l) of both pollutants on surface water bodies, controlling for the effect of precipitation. Specifically, in Equation 7, it is observed that there is a positive and significant relationship between discharges of Cu (ton) and concentrations of Cu (mg/l). In equation (8), there is a positive and significant relationship between discharges of As (ton) and concentrations of As (mg/l) (standard errors in parentheses).
 $$\matrix{ {Concentration{\mkern 1mu} of{\mkern 1mu} Cu{\rm{ }} = 3.2380{\rm{ }} + 0.0152*Discharges{\mkern 1mu} of{\mkern 1mu} Cu - 0.0170*Precipitation{\mkern 1mu} {R^2}{\rm{ }} = 0.43} \cr
{\left( {3.2795} \right)\;\left( {0.0053} \right)\quad \quad \quad \quad \quad \quad \quad \quad \;\left( {0.1150} \right)} \cr } $$
$$\matrix{ {Concentration{\mkern 1mu} of{\mkern 1mu} Cu{\rm{ }} = 3.2380{\rm{ }} + 0.0152*Discharges{\mkern 1mu} of{\mkern 1mu} Cu - 0.0170*Precipitation{\mkern 1mu} {R^2}{\rm{ }} = 0.43} \cr
{\left( {3.2795} \right)\;\left( {0.0053} \right)\quad \quad \quad \quad \quad \quad \quad \quad \;\left( {0.1150} \right)} \cr } $$
 $$\matrix{ {Concentration{\mkern 1mu} of{\mkern 1mu} As{\rm{ }} = 0.0368{\rm{ }} + 0.0079*Discharges\;of{\mkern 1mu} As - 0.0002*Precipitation{\mkern 1mu} {R^2}{\rm{ }} = 0.43} \cr
{\left( {0.0214} \right)\;\;\;\left( {0.0027} \right)\quad \quad \quad \quad \quad \quad \quad \quad \quad \left( {0.0007} \right)} \cr } $$
$$\matrix{ {Concentration{\mkern 1mu} of{\mkern 1mu} As{\rm{ }} = 0.0368{\rm{ }} + 0.0079*Discharges\;of{\mkern 1mu} As - 0.0002*Precipitation{\mkern 1mu} {R^2}{\rm{ }} = 0.43} \cr
{\left( {0.0214} \right)\;\;\;\left( {0.0027} \right)\quad \quad \quad \quad \quad \quad \quad \quad \quad \left( {0.0007} \right)} \cr } $$
The coefficients estimated in Equations 7 and 8 are used in the impact pathway approach to determine the effects of mining discharges on the concentrations of Cu and As, controlling for the effect of precipitation throughout the period analyzed. The previous applies to all mining operations and pollutants analyzed in this study, except for concentrations of Cu and As attributable to Panulcillo.
Area affected by mining discharges
The impact of mining operations has been studied for many years in the literature through different methodologies. For example, life cycle assessment (LCA), life cycle sustainability assessment (LCSA) (Kuipers et al. Reference Kuipers, Lauran van Oers and van der Voet2018), and the use of geographic information systems (GIS) tools help determine the extent of such pollution (Werner et al. Reference Werner, Bebbington and Gregory2019). Several empirical studies agree that the 5 km surrounding the mining exploitation would be the reference range for the impact of mining (Lessmann et al. Reference Lessmann, María Troya, Chris Funk, Valeria Ochoa-Herrera, Suárez and Encalada2019; Shen et al. Reference Shen, Cao, Tang and Deng2017; Stein et al. Reference Stein, Stein and Nix2002). Consequently, this study analyzes the 5 km closest to the mining discharge points, which allows determining the population that lives in that area and the affected agricultural properties. The analysis is carried out with GIS tools using layers of mining operations, population, watersheds, agricultural production, and mining discharge points (Figures 2–4).

Figure 2. A geographic analysis of mining operations and affected areas in the Coquimbo region.

Figure 3. A geographical analysis of mining operations and affected areas in the Valparaíso region.

Figure 4. A geographical analysis of mining operations and affected areas in the O’Higgins region.
However, the definition of the affected area depends on the dispersion of pollutants in the environment, such as ground conditions, river flow, and soil permeability. Therefore, this study performs a sensitivity analysis based on Monte Carlo simulation that explicitly incorporates the probability distribution of the statistical relationships estimated for production and discharges and also for discharges and concentrations. In addition, three scenarios are considered on the distance of the pollution impacts (1 km, 5 km, and 10 km). Although it is reasonable to think that water pollution could affect downstream areas beyond the radius of the scenarios established in the study, there is no in situ data to support this claim.
Economic valuation using the impact pathway approach
A method traditionally used to estimate the costs of environmental degradation is the impact pathway approach, which comprises a sequence of interrelated models (Swärdh and Genell Reference Swärdh and Genell2020; Silveira et al. Reference Silveira, Peter Roebeling, Joana Ferreira, Teixeira, Borrego and Miranda2016; Mardones et al. Reference Mardones, Saavedra and Jiménez2015).
To economically quantify health damage, a first model is required that estimates how changes in production from emitting sources affect emissions or discharges of pollutants. Then a second model that estimates how the change in emissions or discharges modifies environmental concentrations. Subsequently, epidemiological models are required that link changes in pollutant concentrations with morbidity and/or mortality in the affected population through dose-response (D-R) functions. Finally, health expenses and premature mortality must be economically valued. Thus, the impact pathway approach can be summarized in Equation 9:
 $$Cost = \sum\limits_j^J {\sum\limits_i^I {{V_{ji}}} } *{B_{ji}}*{P_i}*{\beta _{ji}}*{{\Delta {C_i}} \over {\Delta {E_i}}}*{{\Delta {E_i}} \over {\Delta y}},$$
where
- $Cost = $
Total cost of health damage,
$Cost = $
Total cost of health damage, -
${V_{ji}} = $
Unitary economic valuation of the health effect j associated with pollutant I,
-
${B_{ji}} = $
Base rate of cases per year of the health effect j associated with pollutant i,Footnote
15
-
${P_i} = $
Population exposed to pollutant i,
-
${\beta _{ji}} = $
D-R coefficient of health effect j associated with the concentration of pollutant i,
-
${{\Delta {C_i}} \over {\Delta {E_i}}} = $
Factor that relates changes in the concentration of pollutant i with the variation in the discharges of pollutant i, and
-
${{\Delta {E_i}} \over {\Delta y}} = $
Factor that relates changes in the discharges of pollutant i with mining production.


It is important to note that ${{\Delta {C_i}} \over {\Delta {E_i}}}$
is specific to the geographic location of the discharge since topography, river flow, or other conditions affect how a variation in discharges modifies concentrations. Similarly,
${{\Delta {C_i}} \over {\Delta {E_i}}}$
is specific to the geographic location of the discharge since topography, river flow, or other conditions affect how a variation in discharges modifies concentrations. Similarly, ${{\Delta {E_i}} \over {\Delta y}}$
is specific to each mining operation, and this relationship may vary over time due to technological progress, changes in the mineral grade, environmental regulations, and so on.
${{\Delta {E_i}} \over {\Delta y}}$
is specific to each mining operation, and this relationship may vary over time due to technological progress, changes in the mineral grade, environmental regulations, and so on.
In the case of environmental damage to agricultural production, the impact pathway approach requires determining how the change in pollutant concentrations affects the economic benefits of the agricultural production (McConnell and Bockstael Reference McConnell, Bockstael, Maler and Vincent2005), which is summarized in Equation 10:
 $$\Delta \pi = \sum\limits_k^K {\sum\limits_i ^I {\left[ {{p_k}*{{\Delta {y_k}} \over {\Delta {q_i}}} - \;{C_{{y_k}}}*{{\Delta {y_k}} \over {\Delta {q_i}}}} \right]} }* \Delta {q_i},$$
where
-
$\Delta \pi = $
Variation in the benefits of agricultural production,
-
$\hskip 5pt{p_k}\;$
= Price of agricultural product k,
-
${{\Delta {y_k}} \over {\Delta {q_i}}}$
= Change in the production of the agricultural product k associated with the change in the environmental concentration of the pollutant i,
-
${C_{{y_k}}}$
= Marginal cost of production of agricultural product k, and
-
$\Delta {q_i}\;$
= Variation in the concentration of pollutant i.


The economic valuation of changes in environmental quality seems straightforward through the impact pathway approach. However, the environmental impacts on health, crops, and the ecosystem are cumulative, incremental, and often come from different sources of pollution. For example, Figure 5 shows that the aggregation and interaction of impacts can be produced by various mining activities and other economic activities, natural conditions, or exogenous past, present, or future factors, which vary in intensity according to spatial and temporary terms (Franks et al. Reference Franks, Brereton and Moran2010). Thus, environmental impacts are difficult to identify in the real world because of the multiple causal relationships interacting simultaneously, introducing uncertainty about the dose-response functions (Silveira et al. Reference Silveira, Peter Roebeling, Joana Ferreira, Teixeira, Borrego and Miranda2016). Consequently, the impacts are not necessarily generated from a simple causal relationship, as the impact pathway approach assumes. In addition, it must be emphasized that the regressions estimated to calibrate the model do not necessarily imply causality (Havens Reference Havens1999).Footnote 16 Despite these limitations, the impact pathway approach may be the only option available to quantify the economic damages of pollution roughly.

Figure 5. Conceptual framework of the cumulative impacts of mining (Franks et al. Reference Franks, Brereton and Moran2010).
Data to estimate health damage
The population affected by the discharges from Tres Valles and Panulcillo belongs to the Salamanca and Ovalle districts. The exposed population in the Valparaíso region only lives in the districts of Los Andes and San Esteban. Finally, the population affected by the discharges of División El Teniente belongs to the districts of Requinoa, Machalí, Olivar, and Rancagua. The 2017 Census reports that these districts have a total population of 574,004 inhabitants. However, to determine the population that lives within the 5 km closest to the discharge points, GIS tools with the layers published by the Chilean Geospatial Data Infrastructure (Infraestructura de Datos Geoespaciales de Chile, IDE Chile) were used.Footnote 17 Besides, the number of houses within 5 km that receive water directly from a well, waterwheel, river, or spring is determined. Then, the average number of people by house is multiplied by the number of houses that receive water without treatment. The number of people affected in the rest of the period analyzed is calculated through the population’s growth rate in each district, obtained from the National Institute of Statistics (Instituto Nacional de Estadísticas, INE) (Table 4).
Table 4. The affected population within 5 km of the discharge points, according to the district.

The dose-response studies on health effects have established significant increases in mortality due to As in drinking water and morbidity by Cu and As. The dose-response coefficients for As and Cu are reported in Table 5. However, all the cited studies report the relative risk (RR), for which the dose-response coefficient (β) can be obtained through the following formula: $RR{\rm{\;}} = {e^{\left( {\beta* \Delta Pollutant\left( {{\rm{\mu g}}/{\rm{L}}} \right)} \right)}}$
.
$RR{\rm{\;}} = {e^{\left( {\beta* \Delta Pollutant\left( {{\rm{\mu g}}/{\rm{L}}} \right)} \right)}}$
.
Table 5. Epidemiological studies on health effects by intake of As and Cu through water.

The unit costs of each disease were obtained from the Superintendency of Health (Superintendencia de Salud) and scientific studies (López-Montecinos, Rebolledo, and Gómez Reference López-Montecinos, Rebolledo and Gómez2016), while the statistical value of life in Chile (US$3.73 million) is obtained from Mardones and Riquelme (Reference Mardones and Riquelme2018). Finally, the annual base rates for each health effect are calculated from the Department of Health Statistics and Information (Departamento de Estadísticas e Información de Salud, DEIS) and population projections from the INE.
Data to estimate agricultural damages
The affected hectares of fruit and vegetables within the 5 km closest to the mining discharge points are determined with GIS tools. For this, the maps of the Fruit Cadastre available on the website Sistema de Consulta Estadístico Territorial, and data from the agricultural census are used.Footnote 18 However, the specific crops on each affected hectare are unknown, so an estimate is based on the share of each crop in production at the district level. This procedure might overestimate the economic value of the negative impacts because the proximity to the discharge of pollutants points likely drives cultivation decisions. Still, this approximation is necessary considering the lack of data. Finally, the yield of crops is determined by the Office of Agrarian Policies (Oficina de Políticas Agrarias, ODEPA) and the Food and Agriculture Organization of the United Nations (FAO).Footnote 19 The same agricultural yield (baseline scenario) is assumed for the entire period analyzed in the affected hectares owing to the lack of information. From the data, it is concluded that there are no affected crops in the Valparaíso region (Tables 6 and 7).
Table 6. Production of affected fruits.

Table 7. Production of affected vegetables.

The average price of fruits is calculated from the export data of the National Customs Service (Servicio Nacional de Aduanas).Footnote 20 The prices of vegetables are obtained from the Observatory for Agricultural, Agrifood, and Forestry Innovation (Observatorio para la Innovación Agraria, Agroalimentaria y Forestal, OPIA).Footnote 21 These prices are available for the entire period analyzed (2013–2018). Finally, the marginal cost of each affected agricultural crop is approximated through the average costs of agricultural products available in the Chilean Input-Output Tables.
The literature of dose-response studies for agriculture has established that crops irrigated with waters that have high concentrations of As and Cu present a decrease in their yield (Yañez et al. Reference Yañez, Alfaro, Avila Carreras and Bovi Mitre2019; Sandil et al. Reference Sandil, Péter Dobosy, Füzy, Óvári and Záray2019; Martins and Mourato Reference Martins and Mourato2006). However, there is no risk to humans from consuming the edible parts of these crops (Sancha et al. Reference Sancha, Castillo, Espinoza and Mena2005; Herrera et al. Reference Herrera, Carrasco, Sandoval and Cortés2017). The impact on agricultural yields is calculated from the literature review and the available data to establish the relationship between concentrations and production. Specifically, this study assumes that irrigation with water that has a concentration of As of 1.4 mg/l implies a 31% reduction in crop yields (Yáñez et al. Reference Yañez, Alfaro, Avila Carreras and Bovi Mitre2019), while irrigation with water that has a concentration of Cu of 9.5 mg/l implies a 73% reduction in crop yields (Martins and Mourato Reference Martins and Mourato2006). These studies were chosen because they are relatively current and within the concentration range of water bodies receiving mining discharges. The selected coefficients are used as linear approximation considering the lack of data to other levels of concentration, because the coefficients of other reviewed studies did not allow obtaining the dose-response relationship given the data available in the present study. Finally, it can be mentioned that the effects of As are considered independently of the impact of Cu; thus, the total impact on crops is the sum of the effects generated by both pollutants.
Results
Coquimbo
In the Coquimbo region, the discharges from the Tres Valles and Panulcillo mining operations are analyzed. Discharges of As and Cu from Tres Valles affect certain areas in the district of Salamanca within the 5 km closest to the discharge point, and some areas of Salamanca and Illapel districts when an expansion of the influence of mining discharges up to the 10 km closest to the discharge point is considered. Discharges of As and Cu attributable to Panulcillo affect certain areas in the district of Ovalle within 5 km closest to the discharge point, and some areas of the Ovalle and Río Hurtado districts when an expansion in the influence of mining discharges up to the 10 km closest to the discharge point is considered.
Table 8 shows the environmental damage considering the different ranges of influence of the As and Cu discharges. In the scenario of 5 km, the damage to agriculture represents 97.1%, and the damage to health is only 2.9%. Health damages are relatively low owing to the small population exposed in the affected area. However, the cost of premature mortality attributed to the consumption of water with excess As represents 99.9% of the health damages. The contribution of each pollutant to the total damage is 95.1% for Cu discharges and 4.9% for As discharges.
Table 8. Environmental damages associated with discharges of As and Cu in the Coquimbo region (USD/year).

Note: The mining operations considered are Tres Valles and Panulcillo.
The total environmental damage is much lower when a distance of 1 km is considered, as there is no exposed population in the district of Ovalle, and fewer hectares of crops would be affected. When a distance of 10 km is considered, the total environmental damage increases significantly, which is mainly explained by the increase in agricultural costs due to the greater number of potentially affected hectares. However, in the three scenarios, 97.9% of agricultural damages are attributed to Cu discharges, and 99.9% of health damages are associated with premature mortality by As.
Valparaíso
The environmental externalities generated by the mining discharges of the Andina Division only include health damages since there are no agricultural activities affected by mining discharges to surface waters. The affected population corresponds to those people without access to drinking water who live in the districts of Los Andes and San Esteban.
Table 9 shows that practically 100% of health damage is attributed to premature mortality by As, while discharges of Cu produce meager costs in medical treatments. Note that Cu does not induce premature mortality, according to the literature reviewed. The results show that health damages do not increase significantly when the distance changes since the area of influence is located in the Andes mountain range, and there is a small exposed population.
Table 9. Environmental damages associated with discharges of As and Cu in the Valparaíso region (USD/year).

Note: The only mining operation considered is the Andean Division of CODELCO.
O’Higgins
The mining discharges of the División El Teniente negatively affect some crops located in the districts of Machalí, Olivar, Requínoa, and Rancagua when impacts up to 5 km from the discharge point are considered. In the case of 1 km, the affected crops are located in some areas of Machalí, Olivar, and Requínoa. For a distance of 10 km, the affected hectares increase and cover areas of Machalí, Olivar, Requínoa, Rancagua, Graneros, Doñihue, and Codegua.
Table 10 shows the environmental damage considering the different ranges of influence of the As and Cu discharges. In the scenario of 5 km, the damage to agriculture represents 99.98%, and the damage to health is only 0.02%. The contribution to total damage of each pollutant is 97.3% for Cu discharges and 2.7% for As discharges. According to the distance analyzed, there are relevant changes in the environmental damages, which is mainly explained because longer distances imply more agricultural areas potentially affected by mining discharges.
Table 10. Environmental damages associated with discharges of As and Cu in the O’Higgins region (USD/year).

Note: The only mining operation considered is the “El Teniente” Division of CODELCO.
Sensitivity analysis with Monte Carlo simulation
A Monte Carlo simulation is carried out to sensitize the results considering the contribution of each variable on the total damages of mining. The standard deviation of the parameters that statistically relate production and discharges, discharges and concentrations, the statistical value of life, and dose-response coefficients are used for the above. Thus, it is possible to obtain confidence intervals for the estimated environmental damage by region and year (Table 11).
Table 11. Sensitivity analysis of total environmental damages (USD/year).

Moreover, the analysis of variance determines that 57.5% of the variability in the results is associated with the parameter that relates discharges and concentrations of As, 28.0% with the dose-response coefficient of cancer mortality, 9.8% with the dose-response coefficient of mortality from stroke, 2.9% to the parameter that relates Cu discharges and Cu concentrations, and the remaining 1.8% to other dose-response coefficients of health effects and statistical value of life.
Conclusion
In this study, an effort is made to economically estimate the environmental damages of copper mining on surface waters in the regions of Coquimbo, Valparaíso, and O’Higgins, Chile. Because of the scarcity of data, only the discharges of As and Cu from some mining operations are evaluated since other mining operations do not report discharges or there are no official records.
The results obtained through the impact pathway approach show that the higher environmental costs of mining discharges are associated with negative impacts on agriculture (97.6%), especially by the increase in concentrations of Cu. This is because discharges of Cu are much greater than discharges of As, and because the dose-response functions for Cu concentrations imply a greater decrease in the yield of crops. Also, damage to fruit crops is greater than damage to vegetable crops, which is mainly associated with the higher market price of fruits, as the number of hectares affected is similar and even higher in some vegetables. Moreover, 2.4% of the environmental cost is explained by health damage, mainly associated with premature mortality induced by the intake of As through polluted water and marginally associated with diseases caused by the intake of Cu and As.
A sensitivity analysis shows that 57.5% of the variability in the results is associated with the parameter that relates discharges and concentrations of As, and 28.0% with the dose-response coefficient of cancer mortality. The previous demonstrates the need to collect data to estimate more precise functions between discharges and concentrations in rivers where mining wastewater discharges are carried out and long-term epidemiological studies to identify cumulative impacts on the exposed population.
When comparing the environmental damages to the copper sales in the analyzed mining operations, it is concluded that the relative shares are low in the scenario that assumes an impact of up to 5 km. Specifically, the percentages are 0.43%, 0.26%, and 0.0001% in the regions of Coquimbo, O’Higgins, and Valparaíso, increasing to 0.70%, 0.39%, and 0.0001% in the scenario of 10 km. The previous implies that the mining operations could perfectly compensate the affected economic agents and exposed population for their damage to surface waters, without the risk of the economic unfeasibility of these operations. To contextualize these percentages, a mining royalty project equivalent to 3% of mining sales is currently being discussed in the Chilean Parliament.
This study’s estimation of environmental damage could help construct cost-benefit indicators or socially evaluate public or private investments that avoid environmental damage in surface waters. It could also be a crucial instrument for solving the growing conflicts among local communities, national authorities, and multinational extractive companies (Maillet et al. Reference Maillet, Mathilde Allain, Felipe Irarrázabal, Stamm and Viveros2021). However, it is necessary to clarify that this study has quantified only reported discharges and does not consider possible unreported or illegal discharges, which could substantially increase estimated costs. Neither impacts associated with extreme events such as floods, infiltrations, overflow of tailings dams are considered.
Acknowledgments
This research was partially supported by ANID/FONDAP/15130015, Water Research Center for Agriculture and Mining (CRHIAM) at the University of Concepción, Chile.


 Open access