3 results
Factors associated with high influenza vaccination among healthcare workers in Tennessee acute-care hospitals, 2014–2022
- Ashley Gambrell, Raquel Villegas, Christopher Wilson, Simone Godwin
-
- Journal:
- Antimicrobial Stewardship & Healthcare Epidemiology / Volume 3 / Issue S2 / June 2023
- Published online by Cambridge University Press:
- 29 September 2023, p. s73
-
- Article
-
- You have access Access
- Open access
- Export citation
-
Background: Healthcare workers (HCWs) are at increased risk of influenza exposure and represent a potential transmission source. The Department of Health and Human Services (HHS) set a goal for 2020 to have 90% of all HCWs in acute-care hospitals (ACHs) vaccinated. Vaccination against influenza decreases symptomatic illness and absenteeism and protects HCWs and their contacts. We assessed characteristics of facility intervention programs based on their success in meeting this benchmark. Methods: Data from the NHSN were utilized, including answers to the Annual Flu Survey for 2014–2022 and the rate of vaccine compliance by facility. Flu surveys detail facility-specific programs implemented for each influenza season, from October to March. We used SAS version 9.4 software for univariate analyses to determine factors significantly associated with meeting the HHS benchmark target of ≥90% vaccination among all HCWs, split into categories for employees, students or volunteers, and licensed independent practitioners. Facilities were excluded if they were not ACHs or Critical Access Hospitals (CAH), did not complete the Annual Flu Survey for at least 1 year, or required vaccination as a condition of employment. Results: From 2014 to 2022, 745 surveys were completed. Overall, 48.58% of respondents succeeded in meeting the HHS benchmark. Also, 306 surveys completed noted that their facility did not require influenza vaccination. Among those, only 19.93% respondents succeeded. Moreover, 80.33% of successful respondents for all HCWs required personal protective equipment (PPE) upon vaccination refusal compared to 34.29% of unsuccessful respondents (P < .0001). Furthermore, 98.36% successful respondents required documentation of offsite vaccination, compared to 89.39% of unsuccessful respondents (P = .027). For employees, 64.56% of successful respondents tracked vaccination rates in some or all units compared to 45.81% of unsuccessful respondents (P = .004). Also, 63.29% successful respondents had visible vaccination of leadership, compared to 43.61% of unsuccessful respondents (P = .003). Furthermore, 86.08% of successful respondents had mobile vaccination carts, compared to 73.57% unsuccessful respondents (P = .023). For the student- or volunteer-specific benchmark, 24.59% of successful respondents provided vaccination incentives compared to 14.63% of unsuccessful respondents (P = .035). Conclusions: Facilities with ≥90% vaccination among HCWs were more likely to require PPE after vaccination refusal and documentation for offsite vaccination. Other strategies for vaccination were differentially associated by employee type for Tennessee facilities. For future outreach, a multipronged approach is more likely to be successful in addressing vaccine uptake among employees with lagging rates. Strategies for influenza vaccine uptake could also improve other occupational vaccinations. More research is needed on the barriers to vaccination among HCWs specifically.
Disclosures: None
Comparison of clinical antibiotic susceptibility testing interpretations to CLSI standard interpretations
- Erin Hitchingham, Ashley Gambrell, Raquel Villegas, Daniel Muleta
-
- Journal:
- Antimicrobial Stewardship & Healthcare Epidemiology / Volume 3 / Issue S2 / June 2023
- Published online by Cambridge University Press:
- 29 September 2023, p. s114
-
- Article
-
- You have access Access
- Open access
- Export citation
-
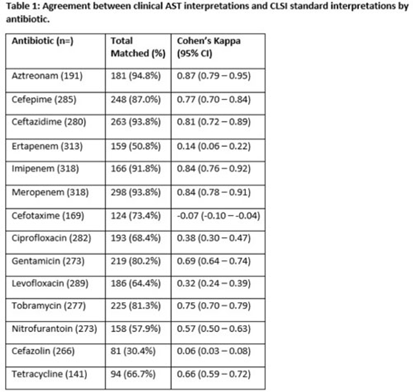
Background: Clinical antibiotic susceptibility testing (AST) interpretations based on minimum inhibitory concentrations (MIC) breakpoints are important for both clinical decision making and some reportable condition criteria. Standardization of MIC breakpoints across clinical laboratories is lacking; AST instruments are often validated for outdated Clinical and Laboratory Standards Institute (CLSI) MIC breakpoint guidelines. In this study, we analyzed the agreement between the reported clinical laboratory AST interpretations and the guideline CLSI interpretation. Methods: Clinical laboratory AST data collected from the Multisite Gram-Negative Surveillance Initiative (MuGSI) carbapenem-resistant Enterobacterales (CRE) surveillance program in Tennessee between 2019 and 2021 were utilized. MIC values from the clinical instrument were used to calculate CLSI standard interpretations following the 2019–2021 CLSI M100 guidelines. Agreement between the clinical laboratory and CLSI interpretations of the reported MIC values were measured using a weighted Cohen κ calculated in SAS version 9.4 software. Total matches were isolates with identical CLSI and clinical laboratory interpretations. Results: In total, 14 antibiotics were assessed. Of those, 9 antibiotics had at least moderate agreement (κ > 0.41) between interpretations. Agreement between the clinical laboratory and the CLSI interpretations were near perfect (κ > 0.81) for 3 antibiotics. Agreement between the clinical laboratory and the CLSI interpretations were poor for cefazolin (0.06) and ertapenem (0.14). Cefotaxime (−0.07) was the only antibiotic that suggested no agreement. Conclusions: Of the antibiotics included in the analysis, 36% had less than moderate agreement between clinical laboratory and CLSI AST interpretations. Given the increases in antimicrobial resistance globally and the emphasis placed on antibiotic stewardship, standardization across clinical AST panels should be prioritized. Inconsistencies have the potential to contribute to inappropriate antibiotic use in addition to under- or overidentification of reportable conditions, including CRE.
Disclosures: None
Identifying COVID-19 clusters in Tennessee long-term care facilities based on weekly staff vaccination rates
- Marissa Turner, Ashley Gambrell, Erin Hitchingham, Simone Godwin
-
- Journal:
- Antimicrobial Stewardship & Healthcare Epidemiology / Volume 3 / Issue S2 / June 2023
- Published online by Cambridge University Press:
- 29 September 2023, p. s52
-
- Article
-
- You have access Access
- Open access
- Export citation
-
Background: In September 2021, the CMS mandated that long-term care facility (LTCF) healthcare workers be vaccinated for COVID-19 unless medically or religiously exempt. Vaccinating healthcare workers reduces transmission of COVID-19 among patients and workers, reducing the risk of illness among residents and patients. We examined the relationship between COVID-19 clusters and staff vaccination rates in Tennessee LTCFs. Methods: COVID-19 cluster data were collected using REDCap from January 3, 2021, to September 25, 2022, and LTCF vaccination rates were collected from the NHSN. Clusters were identified in facilities with 2 or more cases. The staff vaccination rate 2 weeks prior to the cluster was used, accounting for the lag time between vaccination dose and reaching full immunity. We selected 75% as the critical immunization threshold. The facility case rate was calculated per 100 beds. A test was performed to determine whether reaching the critical vaccination threshold was associated with cluster occurrence. The relationship between vaccination rate and case number was tested using Pearson correlation. Statistical analyses were conducted using SAS version 9.4 software. Results: The average staff vaccination rate when NHSN first required long-term care facilities to report rates rose from 47% in June 2021 to 83% in September 2022. In total, 806 clusters were identified with 20,868 combined weeks from all facilities being reported after merging facilities’ weekly vaccine percentage rates with cluster data. Most weeks from all facilities did not identify a cluster (n = 20,064, 96.15%) and did not meet the critical immunization threshold (n = 11,050, 52.95%). The association between a cluster occurring and a facility meeting the threshold was significant (χ2 = 5.41; df = 1; P 95% CI, .7327–.9740). The Pearson correlation coefficient between vaccination rate and case number was 0.05560 (P = .2894). Conclusions: There was a significant association between facilities not reaching the immunization threshold and presence of a COVID-19 cluster. The facility case rate was not correlated with staff vaccination rate; however, a limitation of this analysis was that resident vaccination was not tested. Another limitation was that medical and religious exemptions could not be differentiated. Healthcare staff should consider getting vaccinated, if able, to reduce the risk of COVID-19 and to keep staff and residents safe from COVID-19.
Disclosures: None