2 results
Sociodemographic Factors, Cycle Threshold Values, and Clinical Outcomes of COVID-19
-
- Journal:
- Antimicrobial Stewardship & Healthcare Epidemiology / Volume 1 / Issue S1 / July 2021
- Published online by Cambridge University Press:
- 29 July 2021, pp. s18-s19
-
- Article
-
- You have access
- Open access
- Export citation
-
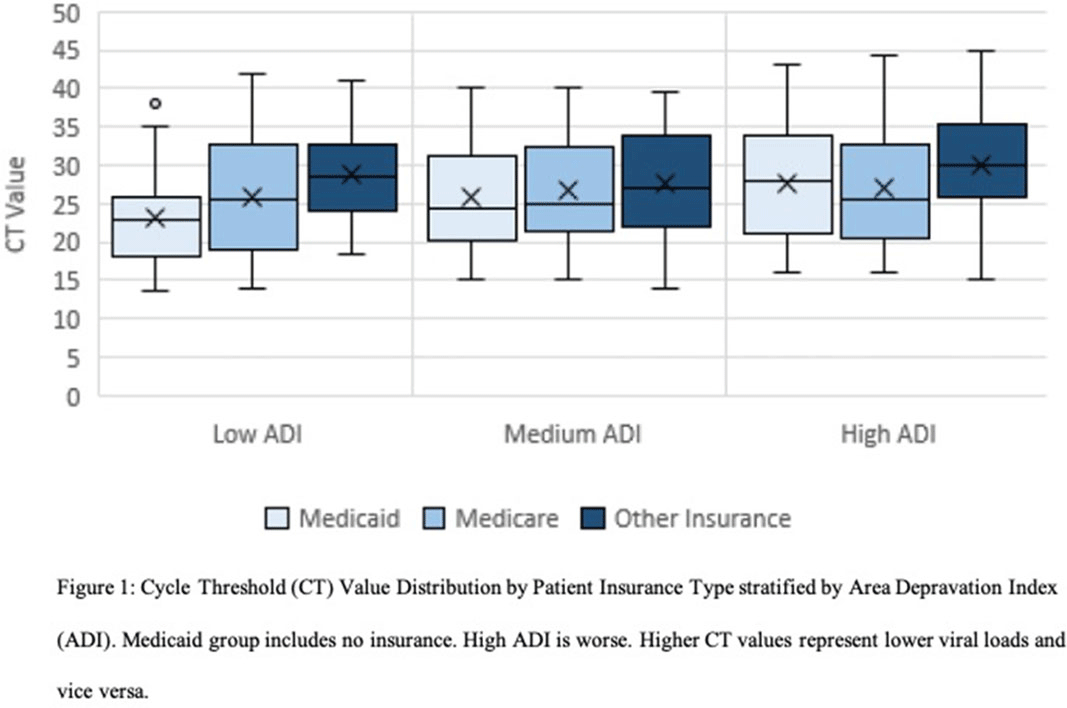
Background: The gold standard for diagnosis of COVID-19 has been SARS-CoV-2 detection by reverse-transcriptase-quantitative polymerase chain reaction (RT-qPCR), which provides a semiquantitative indicator of viral load (cycle threshold, Ct). Our research group previously described how African American race and poverty were associated with an increased likelihood of hospitalization due to COVID-19. We sought to characterize the relationship between Ct values and clinical outcomes while controlling for sociodemographic factors. Methods: We conducted a cross-sectional study of SARS-CoV-2–positive patients admitted to Froedtert Health between March 16 and June 1, 2020. Ct values were obtained by direct interrogation of either cobas SARS-CoV-2 or Cepheid Xpert Xpress platforms. Patient demographics, comorbidities, symptoms at admission, health insurance, and hospital course were collected using electronic medical records. A proxy for socioeconomic disadvantage, area-deprivation index (ADI), was assigned using ZIP codes. Multivariate models were performed to assess associations between Ct values and clinical outcomes while controlling for ADI, race, and type of insurance. Results: Overall, 302 patients were included. The mean age was 60.89 years (SD, 18.2); 161 (53%) were men, 177 (58%) were African Americans; and 156 (51%) had Medicaid or were uninsured. Of the 302 inpatients, 158 (52%) required admission to the ICU, 199 (65.9%) were discharged to home, 49 (16.2%) were discharged to a nursing home, and 54 (17.9%) died. Lower Ct values (higher viral load) were associated with Medicaid or lack of insurance (coefficient, −2.88, 95% confidence interval [CI], −4.96 to −0.79, P = .007) and age >60 years old (coefficient, −2.98, 95% CI −4.87 to −1.08, P = .002). Contrary to what was expected, higher CT values (lower viral load) were associated with higher ADI scores (coefficient, 2.62, 95% CI, 0.52–4.85; P = .017). However, when patients were stratified into low, medium, and high ADI, those with Medicaid or no insurance had the lowest mean Ct values (23.3, 25.9, and 27.6, respectively) compared to Medicare or other insurance (Figure 1). Body mass index (odds ratio [OR], 1.04; 95% CI, 1.02–1.07; P = .001) and male sex (OR, 2.15; 95% CI, 1.28–3.60; P = .004) were independently associated with ICU admission. Every increase of a CT point (OR, 0.90; 95% CI, 0.85–0.95; p <0.001) and age >60 years old (OR 2.62, 95% CI; 1.14-6.04; p=0.023) was associated with death. Conclusions: In this cross-sectional study of adults tested for COVID-19 in a large midwestern academic health system, lower Ct values were independently associated with poverty and age >60 years old.
Funding: No
Disclosures: None
Figure 1.

Coronavirus in Wisconsin Nursing Homes: A Longitudinal Analysis of the First 10 Months of the Pandemic
-
- Journal:
- Antimicrobial Stewardship & Healthcare Epidemiology / Volume 1 / Issue S1 / July 2021
- Published online by Cambridge University Press:
- 29 July 2021, pp. s11-s12
-
- Article
-
- You have access
- Open access
- Export citation
-
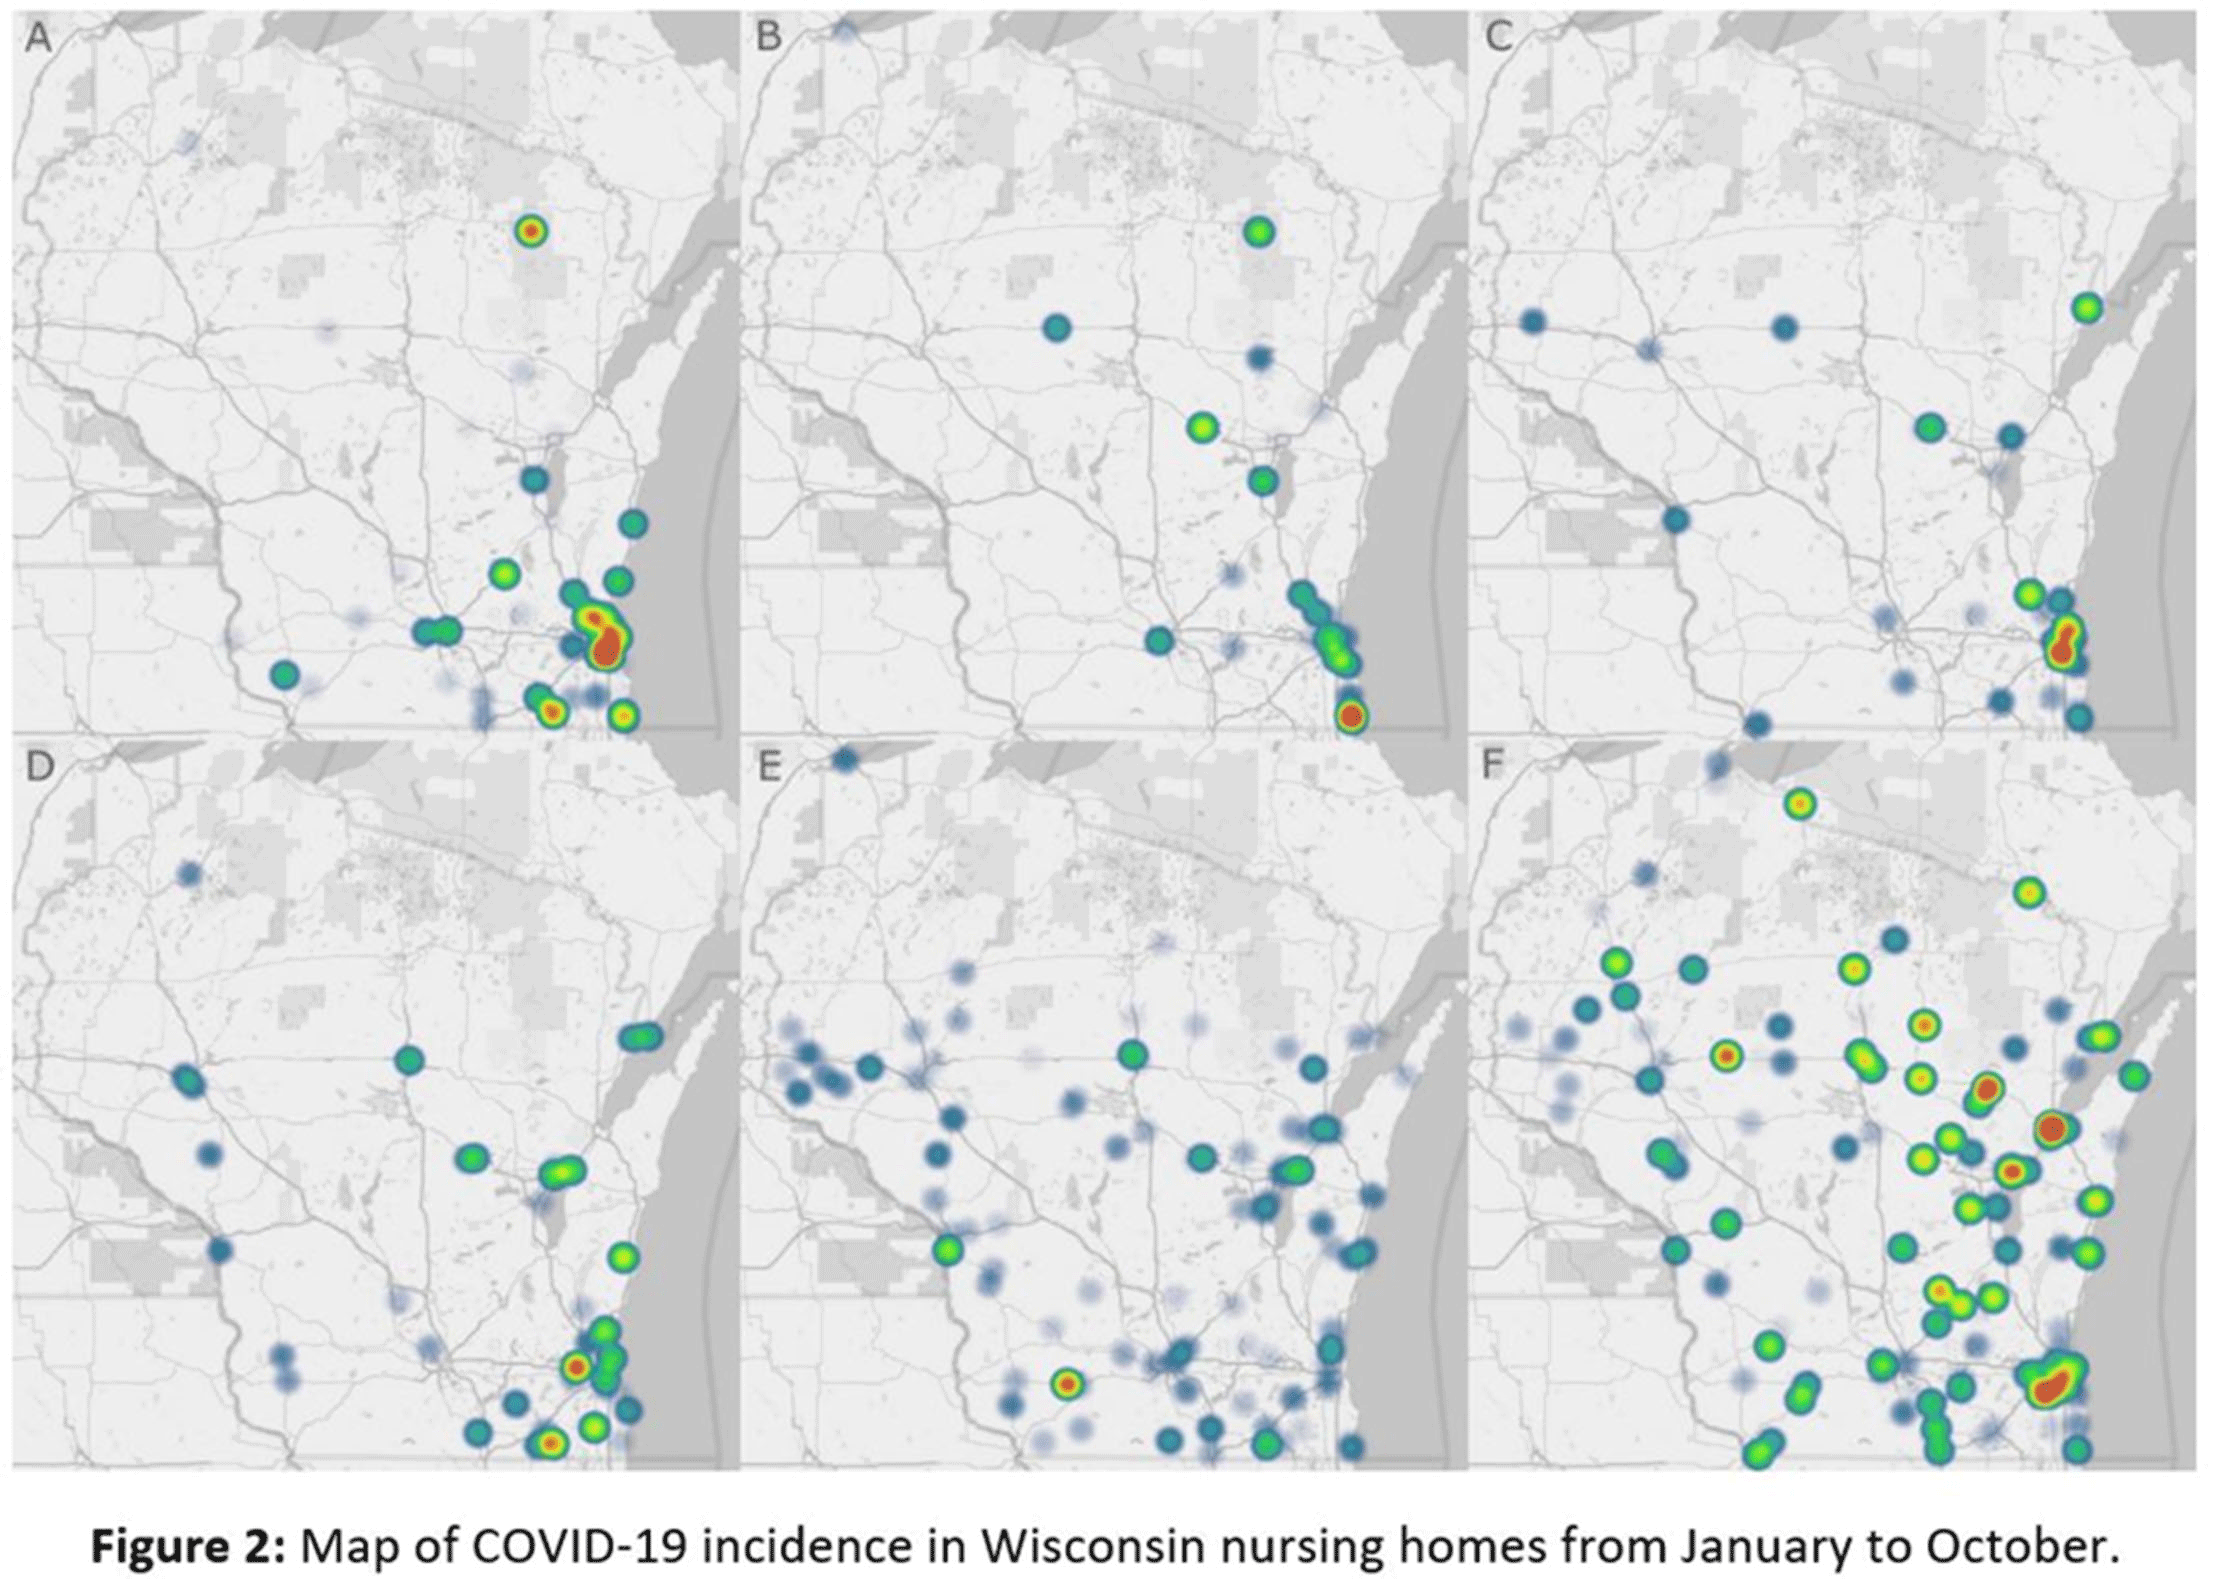
Background: The COVID-19 pandemic has disproportionately affected nursing home residents, and emerging evidence suggests quality, location, resident demographics, and staffing levels may be related to COVID-19 incidence within facilities. We describe the distribution of COVID-19 cases in Wisconsin nursing homes from January 2020 to October 2020, the effect of rural versus urban locations on COVID-19 incidence, and the temporal changes in COVID-19 incidence. Methods: We constructed a database using the Center for Medicaid and Medicare Services’ (CMS) publicly available data. Variables obtained per facility included location, number of beds, ownership type, average census, 5-star ratings (overall, quality, health, staffing, and nurse staffing categories), number of COVID-19 cases, resident Medicaid/Medicare share, area deprivation index, and social vulnerability index. Nursing homes were divided into tertiles based on total COVID-19 cases for descriptive analysis (zero cases, 1–7 cases, >7 cases). Demographic and clinical variables were reported as frequencies, mean (standard deviation) or median (interquartile range). We compared groups using the Pearson χ2 test and the Kruskal-Wallis test. COVID-19 incidence rates were calculated by dividing the number of COVID-19 cases by monthly occupied bed days and multiplied by 10,000. Results: From January 1, 2020, to November 1, 2020, in total, 3,133 SARS-CoV-2–confirmed cases were reported among 248 (70.5%) nursing homes. Urban location (P = .027), overall 5-star rating (P = .035), number of beds (p < 0.001), and average count of residents per day (p < 0.001) were associated with a greater number of COVID-19 cases. Temporal analysis showed that the highest incidence rates of COVID-19 in NHs were observed from January to May and in October 2020 (11.36 and 30.33 cases per 10,000 occupied-bed days, respectively). Urban NHs experienced higher incidence rates until September, then incidence rates among rural facilities surged (Fig.1A). In the first half of the year, NHs with lower quality scores (1-3 stars) had a higher COVID-19 incidence rate; however, in August this trend reversed, and facilities with higher quality scores (4-5 stars) showed the highest incidence rates (Fig.1B). Fig. 2 shows a temporal depiction of the shift from urban to rural settings. Conclusions: Higher COVID-19 incidence rates during the first 5 months of the pandemic were observed in urban, larger facilities with lower 5-star rating. By the end of the year, nursing homes in rural areas and those with higher quality ratings had the highest incidence rates.
Funding: No
Disclosures: None
Figure 1.
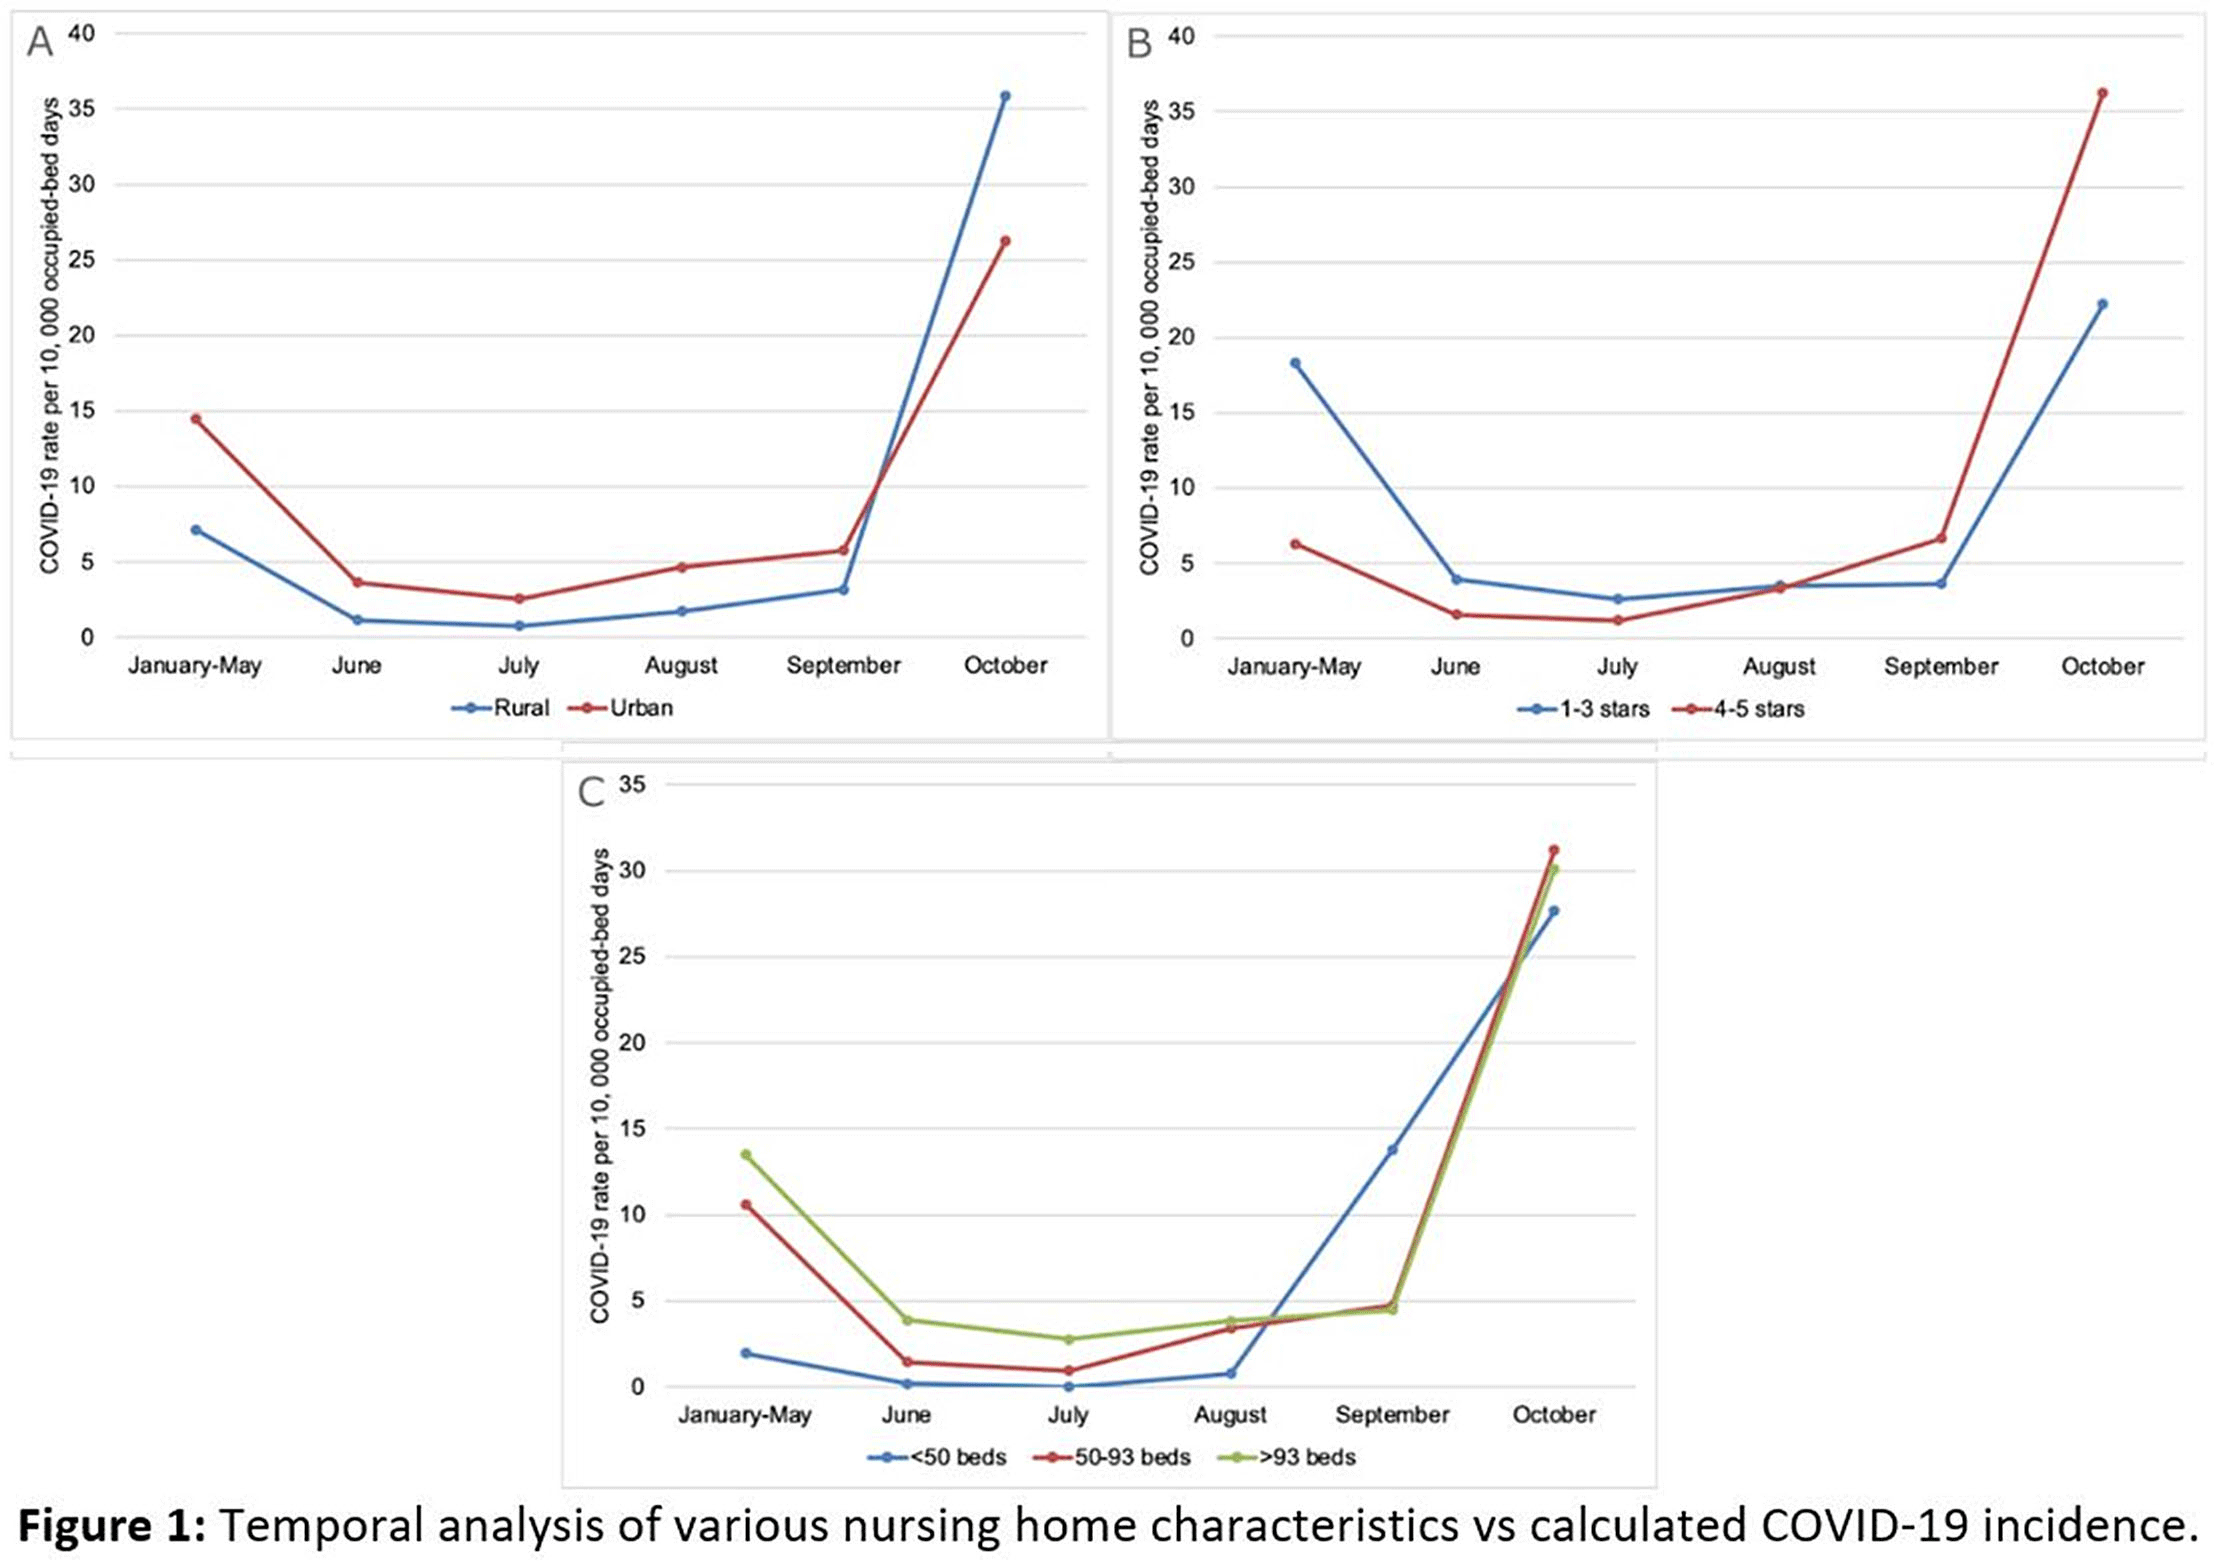
Figure 2.