


No CrossRef data available.
Article contents
The Income Distribution of Canadian Urban Family Saving, 1959*
Published online by Cambridge University Press: 07 November 2014
Extract
This paper attempts to fill a gap in Canadian economic statistics. Saving by households is the largest component of net domestic saving in Canada, but lack of data has prevented any detailed examination of the saving behaviour of this sector. The periodical surveys of liquid assets provide information on the income distribution of household savings and some of the forms in which they are held, but no such distribution has been derived for household saving. A first step is made here in the analysis of Canadian household saving behaviour with the construction of income distributions of saving based on data collected by the Urban Family Expenditure Survey for 1959. The survey is not an ideal instrument for this purpose; it was designed primarily to derive detailed information on consumer expenditures, and it is not always possible to separate out, without using approximate methods, data required for saving estimates. In addition, the total sample is relatively small with only a limited number of respondents in the upper income and entrepreneurial categories which contribute substantially to total saving. However, there is no other Canadian source available for this type of study. The results obtained are of interest in themselves and their derivation can point up changes in survey methods and tabulations which would make future survey data more useful for the estimation of household saving.
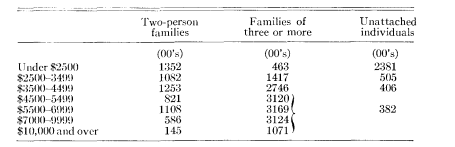
The 1959 survey was restricted to urban centres with a population of 15,000 or over, but there were no restrictions with respect to family size or income. A probability sample of slightly more than 3000 households was selected for the survey from the eighty-one urban areas which qualified. The sampling rate was 1/1500 in Montreal and Toronto, 1/800 in Vancouver, 1/300 in Newfoundland, and 1/600 in all other areas chosen. To obtain national averages the returns for each region were weighted to allow for differences in sampling and response rates. Response rates varied from 45 per cent in Toronto to 78 per cent in the Prairies, with an over-all average of approximately 62 per cent. No adjustment was made for differences in the response of the various family types. It was noted that “the proportion in the weighted sample of one-person units to families of two or more was below that indicated by available check data.” This lack of adjustment, if differences are significant, would bias the survey results and thus our saving estimates, if the responses varied with family type. Tables IV to VI, given below, indicate that substantial differences exist in the saving patterns of the three family sizes for which estimates were obtained.
La repartition par niveau de revenu de l’epargne de la famille urbaine au canada, 1959
A partir de données recueillies par le « Canadian Urban Family Expenditure Survey », nous avons établi une répartition de l'épargne par niveau de revenu. Nous avons obtenu des estimations d'épargne pour cinq classes de familles (selon la grandeur) en recourant à des informations à la fois sur la consommation par revenu et sur les changements d'ordre financier. Théoriquement les deux méthodes d'estimation donnent les mêmes résultats, mais des erreurs dans les mesures conduisent à quelques différences. Les estimés basés sur la consommation par revenu donnent aux rapports épargne-revenu un taux plus rapide d'accroissement et un total plus faible pour l'épargne dans son ensemble. On doit se fier davantage aux estimations basées sur la consommation par revenu parce que nous avons inclus quelques éléments de l'enquête dans les compilations finales, quoique nous ayons des doutes sur la consistance des données sur les changements d'ordre financier. Les résultats nous donnent une épargne totale comparable à l'estimé de l'épargne personnelle des comptes nationaux, réserve faite des différences de définition et de portée.
- Type
- Research Article
- Information
- Canadian Journal of Economics and Political Science/Revue canadienne de economiques et science politique , Volume 32 , Issue 1 , February 1966 , pp. 15 - 26
- Copyright
- Copyright © Canadian Political Science Association 1966
Footnotes
*
This study was carried out while the writer was a member of the Institute for Economic Research at Queen's University, Kingston. I am grateful to Miss I. McWhinney for her comments on an earlier draft.
References
1 Personal saving accounted for 50 per cent of net domestic saving in the period 1961–63. See Mrs.Oja, G., “Some Conceptual Problems in Measuring Household Saving” (MA thesis, Carleton University, 1965).Google Scholar
2 Hood, Wm. C., in the chapter on consumer financing in Financing of Economic Activity in Canada, Royal Commission on Canada's Economic Prospects (Ottawa, 1958)Google Scholar, was forced to use United States and United Kingdom data for the income distribution of saving because of the lack of Canadian information.
3 Incomes, Liquid Assets and Indebtedness of Non-Farm Families in Canada for 1955 and 1958, DBS 13-508 and 13-514. A similar survey, the results of which are still being processed, was carried out for 1963.
4 Saving and savings are distinguished as follows: “Saving is the flow concept and savings is the stock concept. Thus saving is the amount added each period to the total stock of savings.” Claycamp, Henry J., The Composition of Consumer Savings Portfolios (Urbana, 1963), 4, n. 3.Google Scholar
5 Urban Family Expenditure, 1959, DBS 62-521 (Ottawa, 03 1963).Google Scholar
6 See Klein, L. R., “Entrepreneurial Saving,” in Friend, I. and Jones, R., eds., Consumption and Saving, II (Philadelphia, 1960), 297–335.Google Scholar
7 For a brief review of Canadian post-war expenditure surveys see Asimakopulos, A., “Analysis of Canadian Consumer Expenditure Surveys,” this Journal, XXXI (05, 1965), 222–41.Google Scholar
8 The income distributions of saving and the estimates of total saving which are derived therefore refer only to this group, but consideration will also be given below to its extension to the total non-farm population using the income distribution obtained in a companion survey, Distribution of Non-Farm Incomes in Canada by Size, 1959, DBS 13-517 (Ottawa, 04 1962).Google Scholar
9 For this purpose the following nine “regions” were distinguished: Newfoundland; the Maritimes; Montreal; other Quebec cities; Toronto; other Ontario cities; the Prairies; Vancouver; other British Columbia cities.
10 1960 schedules were used in the final tabulations.
11 Urban Family Expenditure, 1959, 8.
12 Ibid., 6.
13 Ibid. Examination of the 1959 Expenditure and Income Survey samples indicated that there would be approximately 2.1 to 2.6 per cent more spending units than income units. Some of the relatives living together would consider themselves independent, and the units thus split off would have a high proportion of unattached individuals with low incomes. See G. Oja and J. R. Podoluk, “Discussion of Concepts and Methods in DBS Surveys of Family Expenditures and Incomes” (mimeographed).
14 Not all members of the unit need have been full-year members.
15 Urban Family Expenditure, 1959, 7.
16 For a study of whether net investment in consumer durables should be considered as saving or whether all expenditures in such goods should be regarded as consumption, see Friend, and Jones, , “The Concept of Saving”, in Friend, and Jones, , eds., Consumption and Saving, II, 336–59.Google Scholar
17 These differences are discussed below.
18 Sale of personal property not traded in on a new item is a negative term in Δa. In light of our definition of saving, which excludes investment in personal property, it should be added back in equation (2), but the available data do not permit a separate estimate. This is probably not a very large item.
19 This includes all premiums on life, endowment, and annuity policies and payments to mutual aid and benefit societies.
20 This can be seen from the following identity:
Re-arranging items, we obtain
The left-hand side of (4) is equal to S2 and the right-hand side to S1 Discrepancies between the two estimates are due to errors of observation.
21 These groups were: under $2500, $2500–2999, $3000–3499, $3500–3999, $4000–4499, $4500–4999, $5000 to 5499, $5500 to 5999, $6000 to 6999, $7000 to 7999, $8000 to 8999, $9000 and over (divided into two groups, the lower 40 per cent and the upper 60 per cent).
22 E.g., for two-person families, 52 respondents (with a weight of 82.3) are shown in the disposable income group $4000–4499. It was assumed that they were composed of respondents in the $4500–4999 total income group left over after previous allocations (31, with a weight of 51.2), with the residual (21, with a weight of 31.1) from the next lowest group, $4000–4499.
23 Continuing with the example in footnote 22,
security = (51.2 × 213.76 + 31.1 × 197.56)/82.3 = 207.64
24 In our example, unemployment insurance = 207.6 – 96.4 – 93.0 = 16.2.
25 E.g., the 44 two-person families with a weight of 78.7, in the $4000–4999 total income group, were taken from two disposable income groups. Twenty-one, with a weight of 31.1, from $4000–4999, and 23, with a weight of 47.6, from the $3500–3999 group.
26 For the $4000–4999 two-person group,
u = (31.1 × 16.2 + 47.6 × 32.3)/78.7 = 26, similarly, i = 82 and p = 75.
27 The ratio in our example was 195/183, and the final estimates were u = 28, i = 87, and p = 80.
28 It is possible from the data provided in this paper for an interested reader to vary the assumption with regard to the total and distribution of this item.
29 This distribution has also been derived for families of two or more, unattached individuals, two-person families, and families of three or more. Copies of these tables can be obtained from the writer.
30 Those with very large incomes are inadequately represented in both surveys and the saving contribution of the top income group is underestimated.
31 Tables for the other family categories can be obtained from the writer.
32 From Tables IV to VI the estimates of average cash gifts received from outside the family, for each income group by family-type, can be obtained and in conjunction with the figures in Table I, used to derive average other money receipts for each group. Total other money receipts can then be estimated using the following distribution of spending units:
33 Even allowing for the large margin of error in our totals because of lack of information on cash gifts received.
34 In the national accounts net rent is imputed for owner-occupied dwellings and added to personal income, but then to represent the consumption of owner-occupied housing, the sum of net rent, plus mortgage interest, fire insurance, repair costs and imputed residential capital consumption allowances is taken. In the expenditure survey no income is imputed for owner-occupied housing and housing expenditure in such cases is measured only by interest payment on mortgages, property taxes, fire insurance, and repairs. In a comparison of saving estimates obtained from these two sources, the difference in the treatment of housing is then reflected in the deduction of residential capital consumption allowances in the national accounts.
35 From the non-farm income survey sample for 1959 it has been estimated that approximately 65 per cent of the income units reside in cities of 15,000 and over. If it is also assumed that a similar proportion of total saving is due to urban residents, then a total non-farm estimate of saving of approximately $1100 million is obtained on the basis of the income-consumption data. There are no grounds for making such an assumption, but it does indicate that our two sets of saving estimates are probably not far out of line with the national accounts estimates. Comparisons are made difficult by the necessarily arbitrary assumptions concerning cash gifts.
36 “Discussion of Concepts and Methods in DBS Survey of Family Expenditures and Income.”
37 Ibid., 11.
38 The writer is not aware of any similar check on the reliability of the consumption or financial change data.
39 Oja, and Podoluk, , “Discussion of Concepts and Methods in DBS Survey of Family Expenditures and Income,” 48.Google Scholar
40 The income survey sampled the non-farm population and a partial explanation for the difference may be that there is a lower proportion of self-employed in urban areas than in the total non-farm population.
41 No allowance was made for cash gifts from outside the family in deriving this estimate.