

Introduction
Over the past two generations, America has experienced an extraordinary – and yet somehow, also widely overlooked – collapse of work among its men. In the half-century between 1965 and 2015, work rates for the American male ratcheted relentlessly downward, and an ominous migration gathered force: A “flight from work,” in which ever greater numbers of working-age men exited the labor force altogether. America is now home to a vast “idle army” of jobless men no longer looking for work – as of 2015, over 7 million alone between ages 25 and 55, the traditional prime of working life.
To be sure, the decline of work in America is no longer entirely delimited to men. After decades of postwar increase, the work rates and labor force participation rates for prime-age American women have likewise been falling since roughly the beginning of the new century. But the decline of work for American men is a much longer-term trend, and also one of much larger absolute dimensions – and it is that problem, rather than the similarly troubling decline of work for women, that is the subject of this chapter.
The general decline of work for adult men, and the dramatic, continuing expansion of a class of nonworking males (including those both ostensibly able-bodied and in the prime of life) constitutes a fundamentally new and unfamiliar sort of problem for America. It is a problem with manifold and far-reaching economic, social, and perhaps even political implications.
The implications for the state of American families are immediate and inescapable. Lest it otherwise go unsaid, these “prime working ages” in which the present male work crisis is concentrated overlap significantly with the conventional life course ages for family formation, parenting, and child-rearing for the contemporary American man.
As it happens, the long-term decline of work for prime-age men in modern America has coincided with the long-term decline of the married two-parent family structure. The correspondence and interaction of these two great sea changes in daily life for contemporary Americans is a question of obvious importance.
In the following pages, I will attempt to cast some light on the outlines of this important relationship. My exposition is intended only to be exploratory in nature: I recognize there are deep and vital questions my method and approach cannot answer, or even adequately address. It is thus my hope that this introduction will be followed by more detailed investigation into the complex dynamics in play here.
In this chapter I will: (1) present a broad quantitative overview of the ongoing decline of work for American men, and especially men 25–54 years of age, placed in both an historical and international perspective; (2) offer a corresponding quantitative overview of the attendant changes in the sociodemographic profile of prime working-age American men over this same period; (3) decompose arithmetically contributions to declining long-term work rates and labor force participation rates by major sociodemographic factors, including family structure; and (4) conclude with a discussion of what the evidence indicates, what it may suggest, and directions for further research.
Work Rates and Labor Force Participation Rates for US Men in the Postwar Era
One of the major and defining, if not necessarily widely heralded, social changes in postwar America has been the secular decline in employment-to-population ratios (also known as “work rates”) for men. Work rates for American men have been falling for most of the postwar era.
The US government did not begin releasing continuous monthly data on the American employment situation until after World War II. (We do this today, as we have since late 1947, through the Current Population Survey (or CPS), which is maintained by the US Census Bureau and used by the Bureau of Labor Statistics (or BLS) to gauge employment conditions for the adult civilian noninstitutionalized population.) By any broad measure we choose, the US employment-to-population rates for civilian noninstitutionalized men in 2015 and 2016 were very close to their lowest levels on record – and far lower than levels in earlier postwar decades (see Figure 5.1).

Figure 5.1 Employment-to-population ratio, US males, selected age groups: 1948–2016 (seasonally adjusted)
Between the early 1950s and 2016 – between Eisenhower’s America and Obama’s America – the nation’s work rate for adult men (those 20 years of age and older) relentlessly ratcheted downward. Very broadly speaking, this downward trajectory tracked with the business cycle: With each new recession, male work rates typically hit a new low – and typically failed to snap back to prerecession levels over the course of the subsequent recovery. We tend to think of the Great Recession of 2008/09 as the “epic” event in postwar labor markets, and of course the devastation that it wrought is incontestable. What is not generally appreciated, however, is that the drop in male work rates since the Great Recession accounts for less than a quarter of the total long-term downward spiral of 20+ employment-to-population ratios for American men in the postwar era. Three quarters of that slide took place before the crash of 2008.
Between 1948 and 2015, the work rate for American men 20 and older (all postwar employment data are for the civilian noninstitutionalized population) fell from 85.8% to 68.1% – or by almost 18 percentage points. Put another way, between 1948 and 2015, the proportion of American men 20 and older without paid work of any sort more than doubled – from about 14% to almost 32% (see Figure 5.2). This work rate for adult men in 2015 was only a little over a percentage point higher than the 2010 level (its all-time low, at least to date). It rose just a bit more in 2016, from 68.1% to 68.5%. (It registered 68.7% in July 2017, the latest reading available at this writing.) Despite purportedly “near full employment” conditions, at least according to much of the received wisdom currently circulating in business and policy circles, the work rate for the US male 20+ group was fully one fifth lower in mid-2017 than it had been in 1948, almost seventy years earlier.

Figure 5.2 Percentage of civilian noninstitutionalized prime-age (25–54) males without paid employment: USA 1948–2017 (seasonally adjusted)
Of course the 20+ work rate measure includes men 65 and older (i.e., those of classical retirement age), but when I exclude the 65+ population and look instead at men 20–64 years of age, work rates reportedly trace a long march downward here as well – from 90.8% in 1948 to 78.4% in 2015. The 20–64-year-old male work rate in 2015 was thus nearly twelve and a half percentage points below the 1948 level, meaning work rates in America for men in this “classical” working-age group were only about six sevenths as high in 2015 as they had been in the early postwar era. In 2015, the fraction of US men aged 20–64 not at work was 21.6% – 2.3 times higher than it had been in 1948 – and the situation was only very slightly better in 2016 and mid-2017, when the proportion of men 20–64 years of age without any paid work at all was reportedly 21% and 20.7%, respectively.
Note that the impact on recorded work rates from changes in the population composition within the male 20–64 age group was altogether negligible, accounting for less than one hundredth of the intervening twelve or more percentage point decline for the 1967–2015 period (Eberstadt Reference Eberstadt2016). Population structure effects likewise had virtually no effect on work rate trends for prime working-age men – the 25–54-year-old cohort, whose changing fortunes are the focus of this chapter.
Prime working-age men are a critical demographic cohort for reasons both economic and social. They comprise the backbone of the male workforce, currently accounting for roughly two thirds of the 20+ men in the US workforce today, and close to three quarters of adult US men with paying jobs (Eberstadt Reference Eberstadt2016) (see Table 5.1). They are also the group in which labor force participation tends to be highest, due to health and life cycle considerations, and of course, they are also the group arguably most central to family formation and the raising of children, not only in contemporary America.
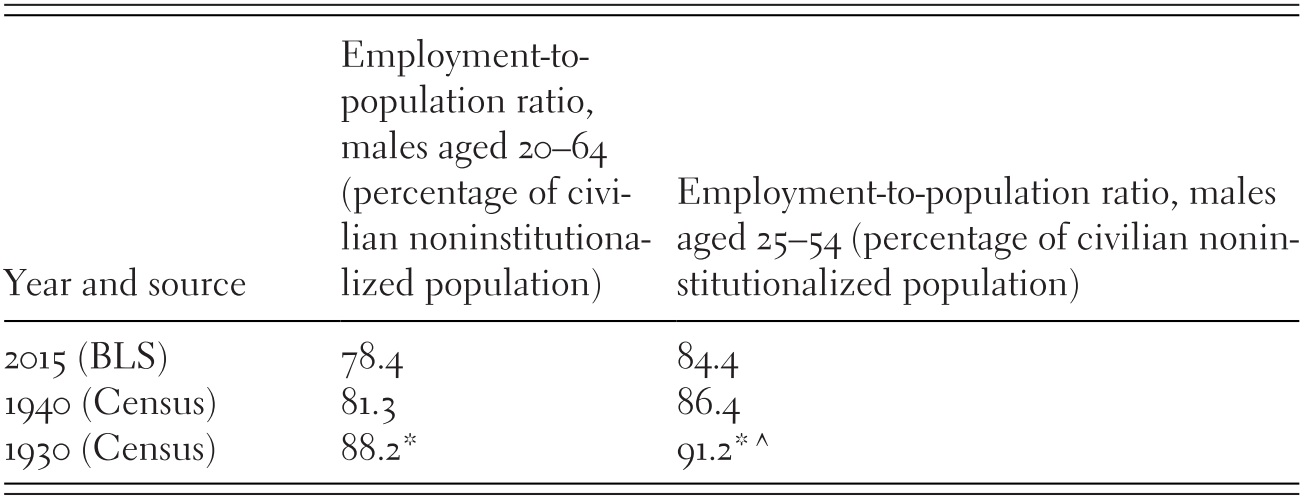
Table 5.1 US male employment-to-population ratios: 2015 vs. selected depression years
| Year and source | Employment-to-population ratio, males aged 20–64 (percentage of civilian noninstitutionalized population) | Employment-to-population ratio, males aged 25–54 (percentage of civilian noninstitutionalized population) |
|---|---|---|
| 2015 (BLS) | 78.4 | 84.4 |
| 1940 (Census) | 81.3 | 86.4 |
| 1930 (Census) | 88.2* | 91.2*^ |
Notes: *= calculated for total enumerated population, not civilian noninstitutionalized population
^= 25–44 population – corresponding male 25/44 work ratio for 2015 would be 85.3 for civilian noninstitutionalized population alone
Between 1948 and 2015, for the male 25–54 age group, work rates for prime-age US males sank almost 10 percentage points, from 94.1% to 84.4% (see Figure 5.1). Since 2016 these have improved, the rate was 85.0% for 2016, and registered 85.5% in July 2017. One may say that prime-age male work rates have recovered appreciably since their nadir in the wake of the Great Recession, when they hit 80.6% in the fourth quarter of 2009. Even so, at the time of writing, prime-age male work rates are on a par with the lowest-ever BLS readings before the 2008 crash (i.e., from the depths of the deep recession in the early 1980s).
The drop in the work rate of prime-age US men did not actually commence until roughly two decades after the end of World War II. In 1948, the work rate for this cohort was 94.1% – exactly the same rate recorded in 1965. (Between 1948 and 1965, the entirety of the decline in work rates for adult men – for those 20–64 years of age as well as those 20 and older – was due to falling work rates for the cohorts 55 years of age and above.Footnote 1) Roughly speaking, the long-term decline in prime-age male work rate did not start until around 1965. Therefore I shall use 1965 and 2015 as the end points for much of my analysis in this chapter, as that timeframe neatly offers us a half-century of long-term data on changes in prime-age male work rates and their correlates.
As Figure 5.2 illustrates, the percentage of prime-age men without paid work rose fitfully but inexorably from the 1960s to the present. In the 1960s, the average monthly fraction of prime-age men was 6.3% – not appreciably different from the 6.2% of the 1950s. That mean monthly level has risen markedly in every successive decade since the 1960s. For the decade that commenced in 2010, the monthly average to date works out to an astonishing 16.9% – well over two and a half times the mean monthly level from the 1960s. Naturally, this decadal average is affected by the truly awful employment trends in the immediate wake of the Great Recession. In 2010, a monthly average of 19% of all prime-age males had no paid work of any sort. Yet today’s “new normal” should still give pause. In 2015, the corresponding proportion was 15.7%; in 2016 – that is to say, seven years after the end of the Great Recession – it was still 15.0%; and for the first quarter of 2017, it was slightly over 15%. This range appears to be the “new normal” for America today: An employment pattern where at any given moment between one in six and one in seven prime-age men is not engaged in paid work.
This “new normal” for US male nonwork may be instructively compared to work rates for American men during the Great Depression (see Table 5.1). As we can see, work rates for both men 20–64 years of age and those of prime working age were lower in 2015 than in either 1930 or 1940; the same would be true for male work rates in 2016 and early 2017 if these were added to the table. Contraposition of today’s rates and those from the year 1940 is most meaningful. For one thing, employment data in the 1940 census was for the first time recorded in a manner directly comparable with our postwar jobs data; for another, America’s unemployment rates in 1940 are extremely high, pushing 15% on a nationwide basis – sharply higher than in 1930, when the Depression was just getting underway. Even so, measured work rates for prime-age men were 2 percentage points lower in 2015 than in 1940. Thus, it is empirically accurate to describe the current work crisis for American men as a Depression-scale problem.
The critical difference between the joblessness situation for men in 1940 and 2015, however, concerns the shifting balance between unemployment and economic inactivity. In 1940, the overwhelming majority of the men without jobs were looking for one: That is to say, they were unemployed in the classic definition of that term. Only a relatively small number of the men without jobs were economically inactive: That is to say, not in the labor force, neither working nor looking for work. The situation is reversed today: As of 2015, for every prime-age male formally unemployed, there were three neither working nor looking for work (see Figure 5.3). Modern America’s job problem for prime-age men has principally been a long-term exodus from the labor market, a flight that started in the mid-1960s and as yet shows no sign of stopping. Nonworking (or NILF, not-in-labor-force) men are the very fastest growing component of the civilian noninstitutionalized prime-age male population in America, increasing at over three times the tempo of the overall cohort for fully half a century between 1965 and 2015. The decline in labor force participation rates (or LFPRs, the ratio of persons in the workforce to total population) between 1965 and 2015 amounted to 8.4 percentage points (96.7% vs. 88.3%), while the overall decline in work rates for that same period came to 9.7 percentage points (94.1% vs. 84.4%). This means the retreat from the labor force accounted for nearly seven eighths of the fall in prime-age male work rates in America over that half-century, and unlike withdrawal from the labor force at older ages, mass withdrawal from the workforce in the prime of life cannot plausibly be attributed to retirement.
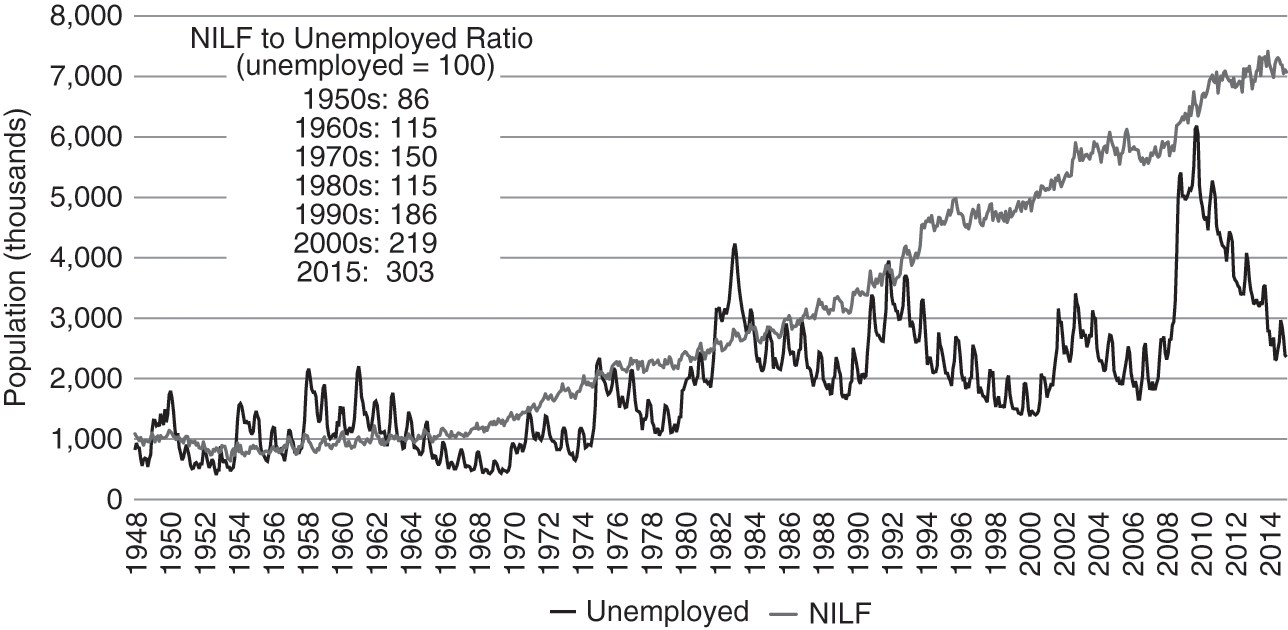
Figure 5.3 Males (25–54) unemployed vs. not in labor force: USA January 1948–May 2016 (seasonally unadjusted)
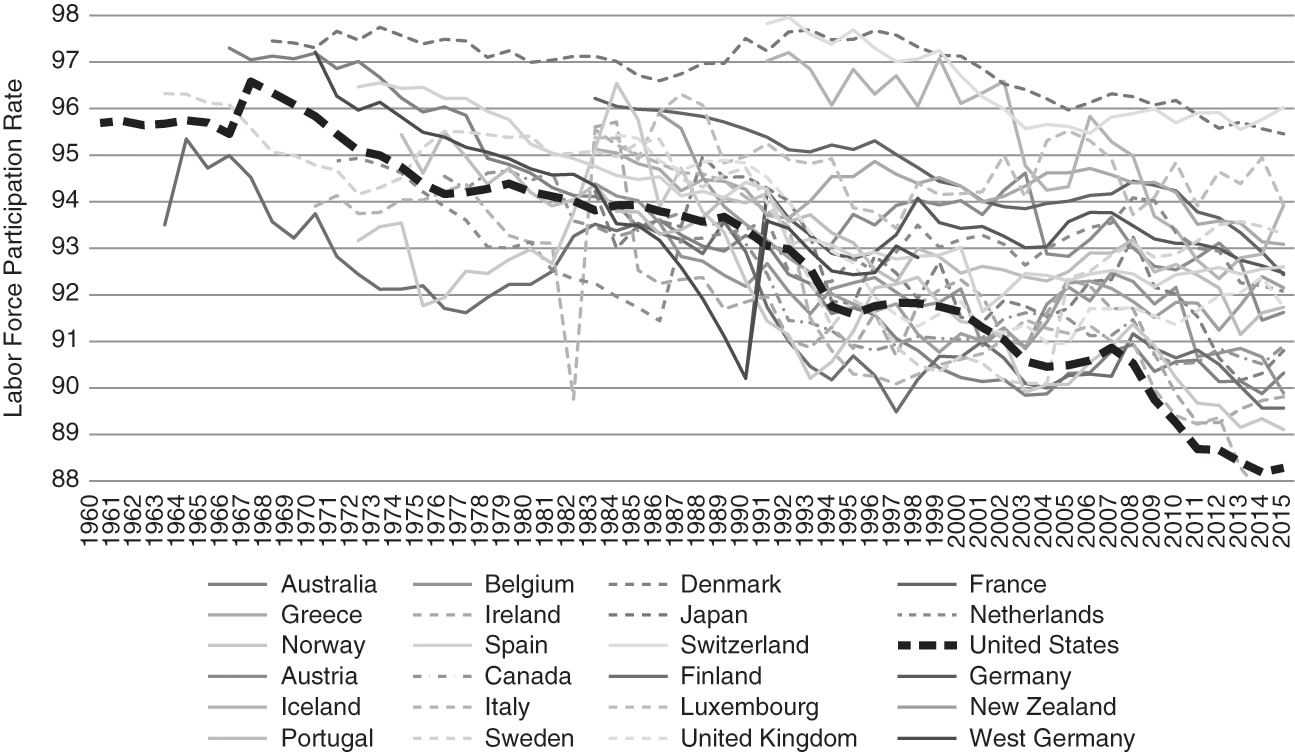
The postwar prime-age male flight from work has been more extreme in America than in almost any other economically advanced democracy. This is apparent when I compare prime working-age LFPRs for the United States with the corresponding patterns traced out in other “traditional” members of the OECD (or Organisation for Economic Co-operation and Development, the de facto club of affluent aid-giving Western democracies) (see Figure 5.4). This grouping includes Japan, Canada, Australia, New Zealand, and eighteen Western European nations as well as the United States: Twenty-three countries in total. Today, America is at the bottom of all these states in prime-age male labor force participation – twenty-second out of twenty-three, underperformed only by Italy. This troubling state of affairs is also puzzling in a number of respects. For the decline in US prime-age male LFPRs is more severe than in countries beset by “lost decades” of economic growth (e.g., Japan), or those burdened with notoriously dirigiste labor market regulations and hypertrophied welfare states (e.g., France), or even those seemingly enmeshed in perennial debt-and-austerity crises (e.g., contemporary Greece). Why male workforce participation rate performance should be poorer in the United States than in any and all of these comparator states is an important but seldom-examined question.

Sociodemographic Change and the Decline of Prime-Age Male LFPRs, 1965–2015
The sea change in employment patterns for prime working-age men that took place over the years between 1965 and 2015 coincided with a sea change in their sociodemographic profiles. The population profile for American men aged 25–54 in 2015 differed markedly from half a century earlier in a number of respects. Important characteristics that registered major changes over this period included (but were not limited to): Ethnicity, educational attainment, family structure, and nativity (that is to say, whether one was native-born- or foreign-born). In this section, I examine the dimensions of some of these broad sociodemographic shifts within the overall composition of the US prime-age male population, and how these shifts related to both the overall decline of work for prime-age men and the closely related increase in the number of such men who have left the workforce altogether. (As already mentioned, the reference population under consideration here is prime-age men in the “civilian noninstitutionalized population,” per CPS/BLS survey coverage.)
The availability of data series for my examination below does not always nicely match my designated 1965–2015 time frame. Over the decades under consideration, the CPS, from which the BLS’ monthly employment report is derived, gradually extended its scope and asked more detailed and nuanced questions about the nation’s sociodemographic profile. Often, these new questions signified official recognition of the importance of changes already well underway. Thus, in 1965, CPS already provided detailed information on educational attainment for the US population, but its breakdown of data by ethnicity or “race” was still rather rudimentary. It was not until 1971 that it was possible for respondents to identify as themselves as Hispanic, and it took over another two decades before it was possible to do so for Asians, much less multiracial. By the same token, CPS did not begin to track “nativity” (whether the respondent was foreign-born or native-born) until the early 1990s. As for family structure, back in 1965, the CPS could tell us whether a man was married, separated, divorced, or never married, but nothing else. Beginning with the year 1968, CPS started providing information about living arrangements as well, including whether men in these various marital categories were with their spouses and children under 18, and if the latter, how many. Convenient or no, my analysis must conform with the time spans for which the requisite CPS data are available.
Figures 5.5–5.17 illustrate some of the major sociodemographic shifts that have transformed the composition of the US prime-age male population over the half-century under consideration. I describe these briefly below.
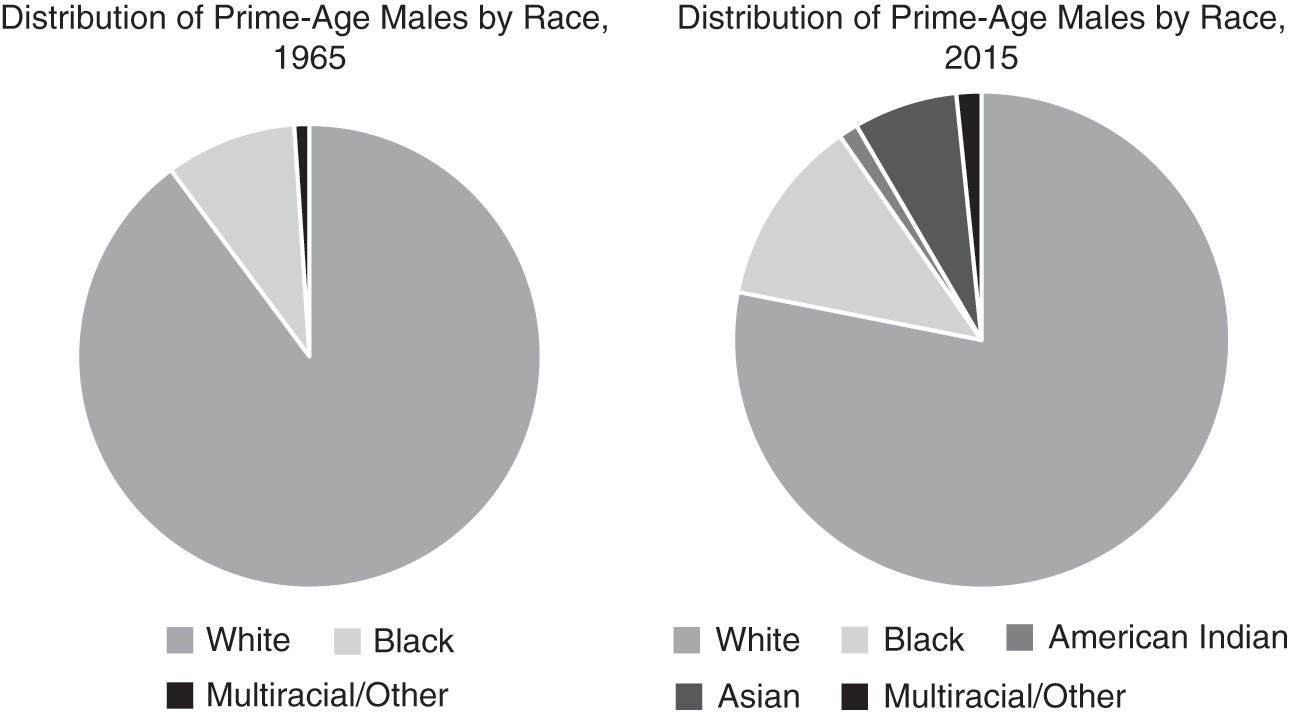
Figure 5.5 Distribution of prime-age males by race, 1965 vs. 2015

Figure 5.6 Work rates for prime-age males by race, 1965 vs. 2015

Figure 5.7 Distribution of prime-age males by race and ethnicity, 1971 vs. 2015

Figure 5.8 Work rate for prime-age males by race vs. ethnicity, 1971 vs. 2015
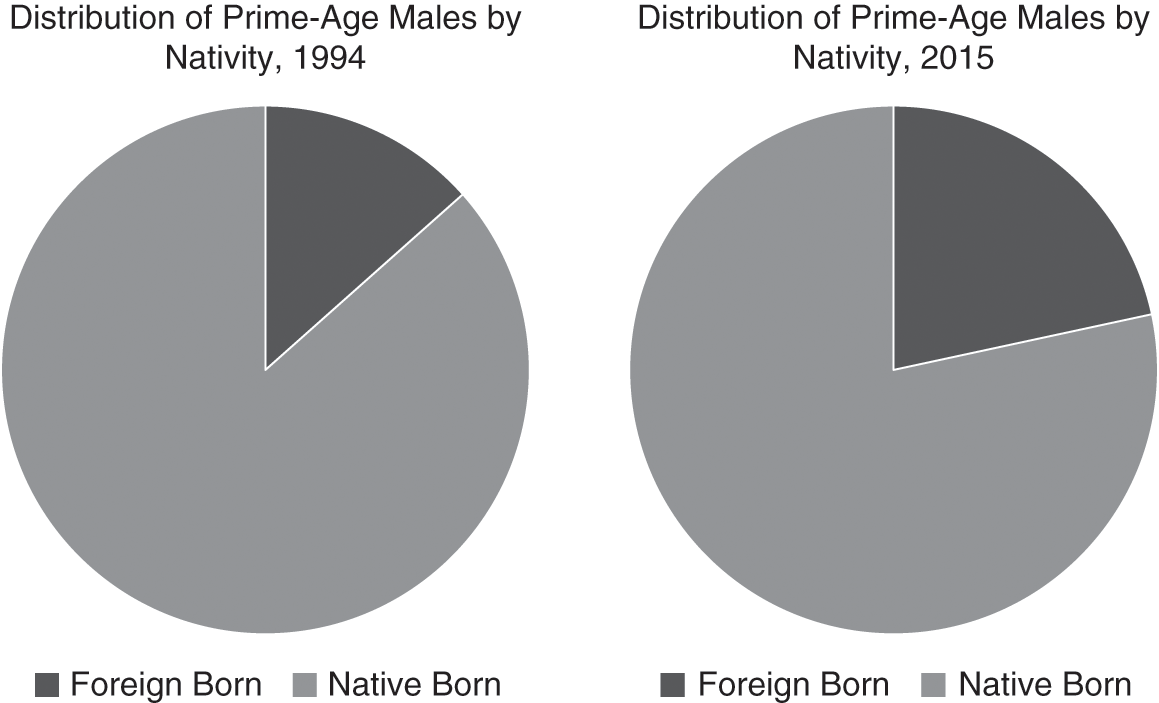
Figure 5.9 Distribution of prime-age males by nativity, 1994 vs. 2015

Figure 5.10 Work rates for prime-age males by nativity, 1994 vs. 2015
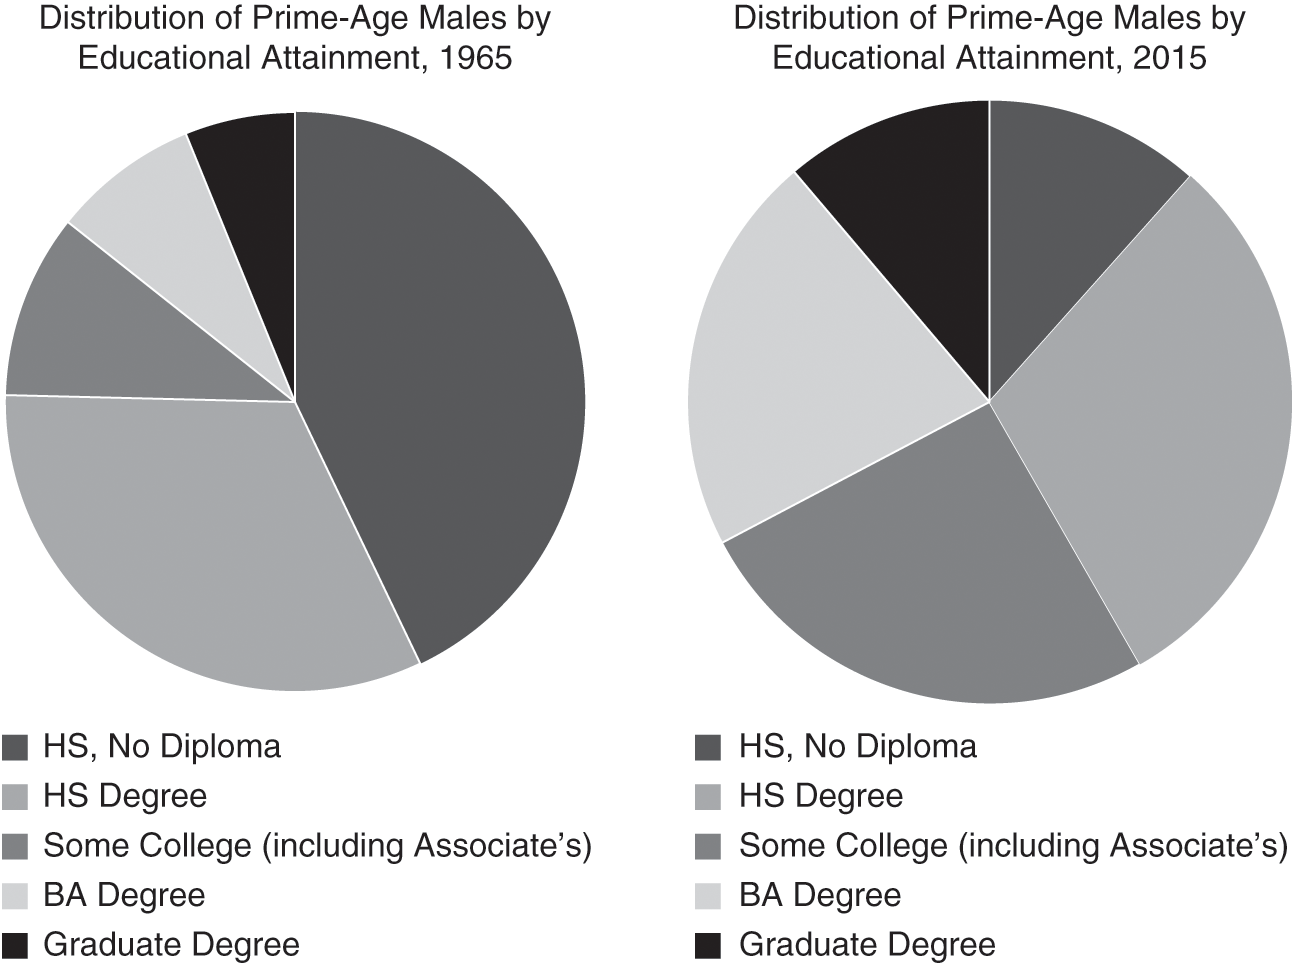
Figure 5.11 Distribution of prime-age males by educational attainment, 1965 vs. 2015

Figure 5.12 Work rates for prime-age males by educational attainment, 1965 vs. 2015

Figure 5.13 Distribution of prime-age males by marital status, 1965 vs. 2015
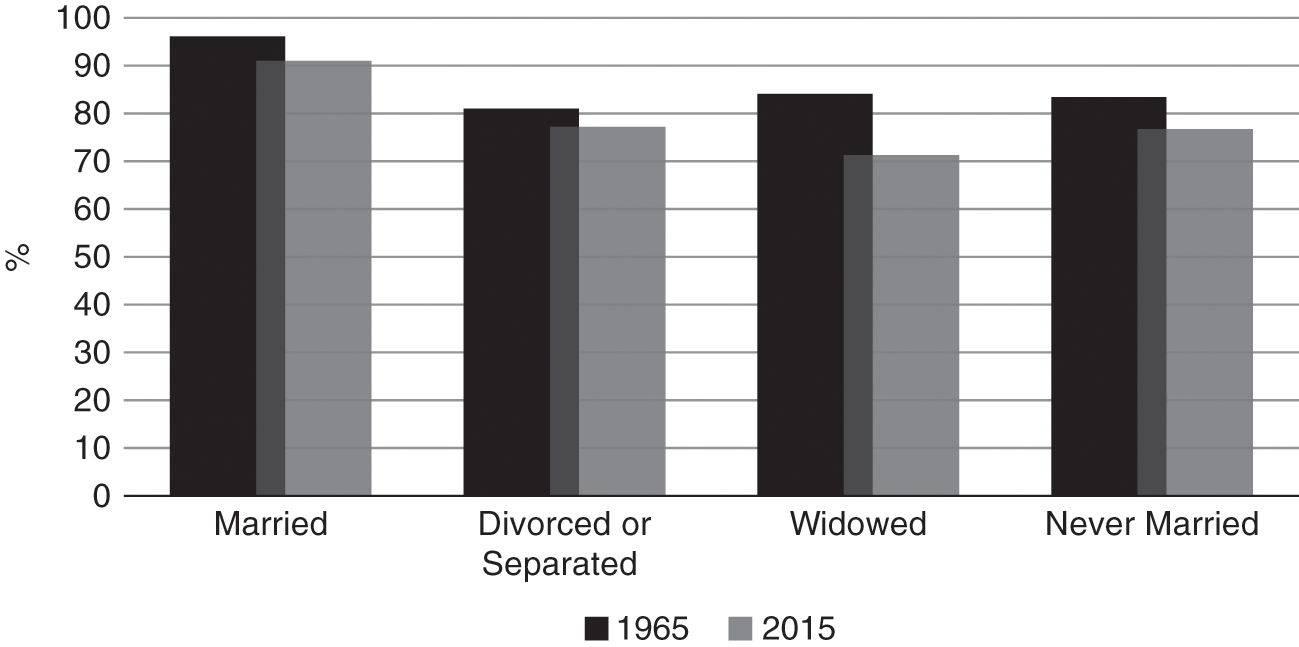
Figure 5.14 Work rates for prime-age males by marital status, 1965 vs. 2015
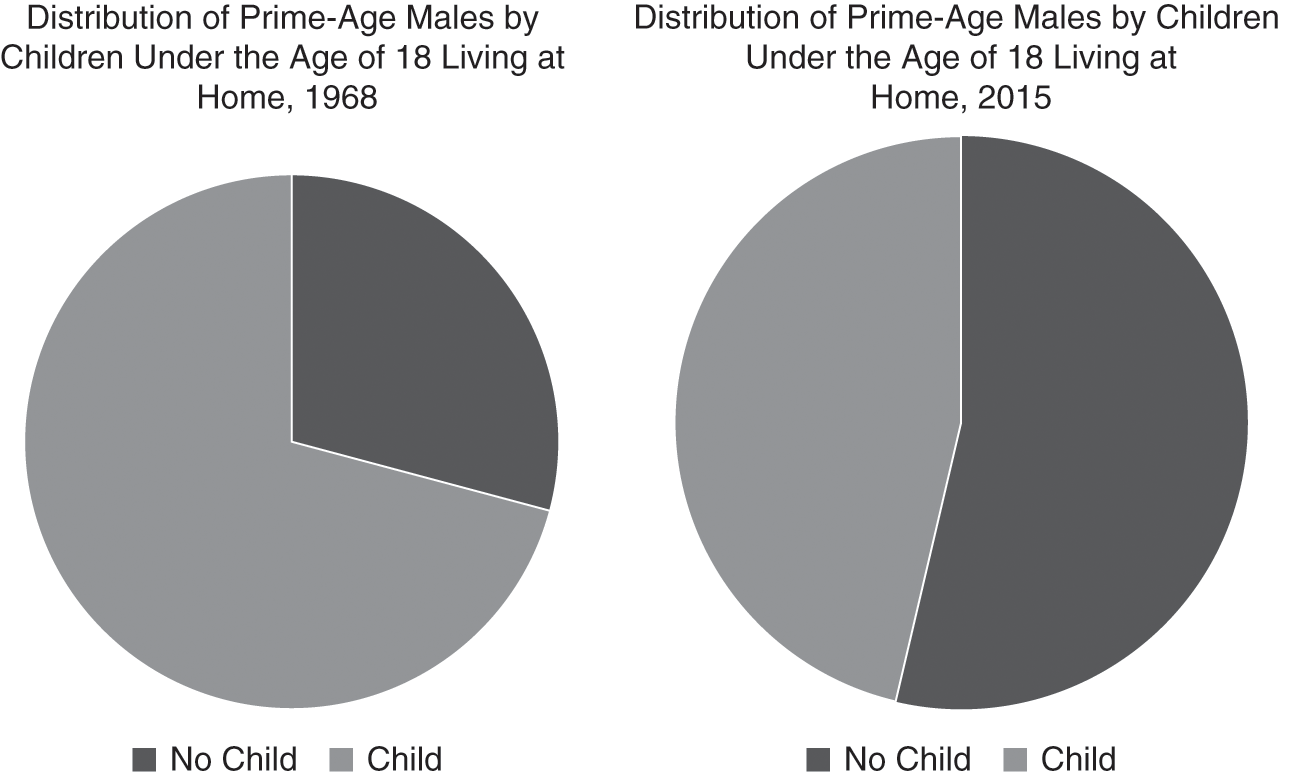
Figure 5.15 Distribution of prime-age males with children under the age of 18 living at home, 1968 vs. 2015

Figure 5.16 Distribution of prime-age males by family status and presence of child (<18), 1968 vs. 2015

Figure 5.17 Work rates for prime-age males by family structure, 1968 vs. 2015
Race and Ethnicity
The 1965 CPS offers just three alternatives for categorizing the “race” of the US population: White/Black/Multiracial. By 2015, the categories of Asian and Native American have also been added to the taxonomy. Between 1965 and 2015 the proportion of prime-age men identified as White dropped by about 12 percentage points, from roughly 90% to 78%. But roughly eight points of this twelve-point decline was due to the newfound availability of Asian and Native American classifications for 2015; almost all of whose contingents would have been represented as White under the 1965 schema. The only two consistent racial categories for the 1965–2015 period are Black and Multiracial/Other; the proportion of prime-age men identifying as Black rose by a little over 3 points, from around 9% to around 12%, while the proportion for Multiracial/Other rose by somewhat less than one point, from 1% to a bit less than 2%. In all, then, these “race” data do not seem to reveal any major shifts in US “racial composition” over the period in question (apart from the introduction of new categories) – in part perhaps because of the limitations of this classification system for modern America.
A more nuanced and informative picture of heritage and ancestry comes from the CPS information on “ethnicity,” which in addition to counting Asian and Other/Multiracial persons, also identifies the population of Hispanic origin (both White and Black), non-Hispanic Whites, and non-Hispanic Blacks. This CPS series commenced in 1971, and the breakdown from that year for prime-age men can be compared with results for 2015.
Between 1971 and 2015 the ethnic composition of US prime-age males changed appreciably. The most dramatic change was for the proportion of Hispanic men, which soared from under 5% to almost 18%. (Almost all of these Hispanic men classified themselves as White; as of 2015, less than 1% of all prime-age men were Black Hispanics.) In 2015, self-identified Asians comprised almost 7% of prime-age US men, and though I lack corresponding data for 1968, I may suspect the percentage was much smaller back then. Non-Hispanic Black men accounted for just under 12% of prime-age males in 2015, up about 2 percentage points from 1971. By 2015, non-Hispanic Whites (or “Anglos”) made up just 62% of the prime-age male population, down roughly 17–23 percentage points, depending on the initial number of Asians in the prime-age male pool in 1968. This is a considerable reduction in the “Anglo” proportion of the prime-age male population in somewhat less than half a century, but with only a very small part of the increase in the “minority” percentage (somewhere between less than an eighth and less than a tenth) due to an increase in the proportion of non-Hispanic Blacks.
For prime-age men overall, work rates fell by nearly 9 percentage points between 1965 and 2015, and by almost 8 percentage points between 1971 and 2015. Over those same years, Black and Non-Hispanic Black work rates fell even more sharply than this: By nearly 15 points and over 13 points, respectively. By 2015, roughly 27% of all prime-age Black or non-Hispanic Black men in the civilian noninstitutionalized population – over one in four – reported no paid work at all. The Black/White and non-Hispanic Black/non-Hispanic White gap in work rates widened over these decades: From 7 points in 1965/71 to 13-plus points in 2015. White/“Anglo” work rates fell somewhat less than the national average over these years.
The work rates for non-Hispanic Blacks in the prime-age male population in 2015 are thus perhaps akin to those for the United States during the darkest hours of the Great Depression – and there are other minority groups with similar grim prospects. In 2015, the prime-age male work rate for Native Americans was just 72% – meaning 28% had no paid work. Likewise, prime-age men with Multiracial backgrounds, as well as the small contingent who self-identified as Black Hispanic, were in groupings where over 20% had no paid work.
However, the story of the collapse of work for the modern American man is by no means an unrelieved story of differentially poor performance for ethnic minorities. By 2015, White Hispanics and Asians accounted for nearly one quarter of the prime-age male population – twice the number for non-Hispanic Blacks. Of all ethnic groups whose trends can be traced over the decades under consideration, the group with the best (or perhaps I should say least-bad) work rate trends are the Hispanics, whose work rates dropped by “only” 1 percentage point between 1971 and 2015.
By 2015, interestingly enough, both Hispanic and Asian work rates for prime-age men were slightly higher than those of “Anglos.” Not only has America become more ethnically diverse over the past half-century but diversity in work rates for America’s ethnic minorities has become more apparent as well. At the same time, these racial and ethnic differentials help place the dimensions of the postwar collapse of work for prime-age men in sharper perspective: Work rates for Blacks in 1965 were higher than for Whites fifty years later, and rates for non-Hispanic Whites in 2015 were just about the same as they had been for non-Hispanic Blacks back in 1971.
Nativity
Most of America’s changing ethnic complexion since 1965 is due to immigrants and their descendants, and much of this change is accounted for by the foreign-born themselves. CPS did not begin to track employment patterns by nativity until the 1990s, but even in just over two decades for which such data are available, we can see the impact on both prime-age male population composition and on overall prime-age male work rates.
In 1995, foreign-born men accounted for a little over 13% of all prime working-age males in the US civilian noninstitutionalized population. Just twenty-one years later, the corresponding proportion was nearly 22%. In 2015, foreign-born prime-age men were overrepresented in the employed population, meaning their work rates were higher than those of native-born men. (This turns out to be true, incidentally, for all major ethnic groups in America: Whites, Blacks, Hispanics, and Asians alike.)
Between 1994 and 2015, prime-age male work rates fell by a little over 3 percentage points, but trends for native- and foreign-born men moved in opposite directions: Down sharply for the former, up distinctly for the latter. Indeed, foreign-born men are the only group covered in my study for whom long-term work rates were reported to rise. As of 2015, work rates were over five points higher among prime-age men for the foreign-born than the native-born, and over four points higher than the national average.
Educational Attainment
In terms of sheer years of schooling, America was a much more educated society in 2015 than in 1965 – and of course the same was true for America’s prime-age men. In 1965, high school dropouts formed the largest single grouping within the prime-age male population, making up nearly 43% of the total; by 2015, they accounted for less than 12% of that population. Conversely, only 14% held a college degree or higher in 1965, as against nearly 33% in 2015. By 2015, nearly three fifths of America’s prime-age men had at least some college training in their résumé, as against just a quarter back in 1965.
From 1965 to 2015, work rates for prime-age men have always tracked positively with education: The higher the level of educational attainment, the higher the work rate. Over these decades, though, the gradient has grown far steeper. Work rates have declined for every educational attainment, but they have more or less collapsed for those at the lower end of the spectrum. Work rates for men with a graduate education fell by only 2 percentage points over that half-century, yet even for men with no bachelor’s degree but some college training, work rates dropped by eleven points. For men with just a high school diploma, rates plunged by nearly seventeen points, and for those with no high school diploma, they plummeted by almost eighteen points. By 2015, nearly 20% of prime-age men with high school diplomas but no higher training were jobless; the same was true for over 27% of high school dropouts, and the vast majority of these same jobless, lower educated men were entirely out of the labor market, no longer actively seeking employment. In retrospect, no less astonishing than the collapse in work for lower skilled men may be the high work rates those same educational groups still maintained just two generations ago. In 1965, after all, work rates for prime-age men with just a high school diploma were higher than those for men with graduate education today (i.e., 2015), and rates for high school dropouts in 1965 were over five points higher than the overall average for a the much more schooled prime-age male population of 2015.
Family Structure
Between 1965 and 2015, as in most other affluent Western societies, US marital patterns and living arrangements underwent upheaval, the reverberations from which are evident in my data on prime-age men. In 1965, five out of six prime-age men were currently married; by 2015, married men formed only a bare majority of that population. In 1965, less than a tenth of men aged 25–54 had never been married; by 2015, this group formed nearly a third of the entire prime-age male population. The proportion divorced or separated likewise roughly tripled over these decades. (The widowed proportion actually shrank slightly, but this was a tiny segment of the US prime-age male population: Less than 1% in 1965.)
This postwar disruption in previously extant family patterns is all the more evident from 1968 onward, once CPS began reporting on living arrangements and children. In 1968, nearly 70% of prime-age men were not only married, but married and living with at least one child under 18 years of age at home. By 2015, barely 40% of prime-age American men were married with children at home, while close to 30% were never married and currently not living with children. In all, less than half of all prime-age men – just 46% – were living with children in 2015; in 1968, by contrast, more than twice as many prime-age men had a child in their home as did not (70% vs. 30%).
This upending of previous living arrangement profiles, I should emphasize, was partly the result of declining fertility levels, which were considerably lower in 2015 than 1968 – but only partly. A major driver was the increasing likelihood that a man would not live in the same home as his children, irrespective of his marital status. By 2014, according to the Census Bureau’s Survey of Income and Program Participation (SIPP) survey, only three quarters of US men were living with all their identified biological children (Monte Reference Monte2017). This estimate, furthermore, only covers children those fathers reported or acknowledged. An analysis of SIPP data for the year 2004 noted that the average number of biological children reported by adult men was 20% lower than the number reported by adult women – a discrepancy possibly explained, in the words of the authors, by “underreporting in the survey or men not knowing about their offspring” (Emens and Dye Reference Emens and Dye2007).
Just as we observe major differentials in prime-age male work rates – both at any given point in time and also across time – by race or ethnicity, nativity, and education, so we do with family structure. Very broadly speaking, work rates are always higher for married men than for others, and almost higher for men with children at home, irrespective of their marital status.
Let us begin by looking just at marital status. In 2015, the work rate for all married men aged 25–54 was 91% – over 6 points higher than the national average. Work rates for these married men were roughly 14 points higher than for their never-married and separated/divorced peers, and nearly 20 points higher than for their widowed counterparts (although this is a tiny population – less than two thirds of a percent of the total). Interestingly enough, back in 1965, work rates for married men were already much higher than for others: 10 or more points higher than for those never married or widowed, and 13 points higher than for those separated or divorced. Work rates for married prime-age men did decline between 1965 and 2015, but by less than for any other marital status. Some may be surprised by how little work rates fell for never-married prime-age men over this half-century: The drop was a bit under seven points, as against an average drop of nearly nine points for prime-age men overall. Part of the answer to this apparent paradox may lie in the extraordinarily low levels to which work rates for never-married prime-age men had already dropped. In 1965, work rates for never-married prime-age men were already down to 83% – over 4 points below the national average that same year for Black prime-age men; fully 7 points below the level that same year for high school dropouts; and, despite an intervening half-century of sharp work rate declines, lower than the national average for prime-age men in 2015.
Now, let us consider the matter of prime-age men with children under 18 in their homes, biologically related or otherwise. In 2015, the work rate for any prime-age men with any children at home was 91% – almost the same as for the average for married prime-age men that same year. The gap in work rates separating prime-age male homes with and without children in them was almost 12 percentage points – a differential comparable to that separating college graduates and high school graduates in 2015, and almost as large as the 2015 White/Black work rate disparity for prime-age males. An appreciable gap in work rates between prime-age male homes with and without children was already apparent in 1968, but by 2015, that gap had close to doubled, meaning that work rates fell much further for childless homes than those with children in them.
I can further disaggregate work profiles by both marital status and presence of children for America’s prime-age men in 2015 and 1968.
In 2015, the prime-age work rate for married men with children at home was almost 93% – very slightly higher than for college graduates that same year. Married men without children at home reported work rates over six points lower; even so, their rates were above the overall average for 2015, and indeed, higher than for those of any other category of men not currently married. Whether or not they had children at home, prime-age men who were separated/divorced, widowed, or never married all reported work rates below the national average, but work rates tended to be lower still for those without children (excepting only never-married men, where the rates were very slightly higher for those without children at home).
In 1968, the relationship between work rates and family structure was similar (if not identical) to the patterns witnessed in 2015. Then as now, married men had the highest work rates, with the very highest reported by married men with children at home. (In 1968 the work rate for this “married with kids” contingent was over 96%!) The nonmarried men had lower work rates than their married counterparts, and for each of the other designations for marital status, men with children at home tended to have higher work rates than those who did not.Footnote 2 For those prime-age men not currently married and without children at home, work rates were already very low by 1968 – more or less on a par with America’s overall average prime-age male work rates for 2015, which, as we have already seen, were actually lower than prime-age male work rates in 1940, at the tail end of the Depression.
We can see from these comparisons that work rates had already commenced to collapse by the mid- or late 1960s among prime-age men with what we might call “nontraditional” family types (i.e., for those who were not currently married, and especially for those not currently married without children at home). The work rates for all not currently married men in 1965 were lower than the corresponding rates for either contemporary Black men or high school dropouts. Work rates for not currently married prime-age men without children at home – all “races” included – in 1968 were lower than for non-Hispanic Blacks of all family types in 1971. By such indications, the collapse of work rates for nontraditional family types preceded the great drop in work rates that were to come for both non-Hispanic Black and less highly educated prime working-age men in subsequent decades.
Examining the Relationship between Family Structure on Prime-Age Male Work Patterns
As we have seen, family structure – like race and ethnicity, nativity, and educational attainment – appears to be a powerful predictor of postwar work patterns for American men. We can begin to assess the impact of these social factors on changing male work profiles – on those major postwar declines in male work rates and dramatic upsurges in the percentages who have exited the workforce altogether – with two simple quantitative comparisons.
The first is to estimate the relative risk of being out of the workforce (or NILF, not in labor force) – a condition that mirrors the work ratio closely, albeit imperfectly – in accordance with given sociodemographic characteristics. The second is to present illustrative counterfactuals for the potential contribution of sociodemographic change on employment patterns. We derive this counterfactual by holding constant the characteristic-specific work rates or NILF rates for prime-age men for the year 2015, but applying these against the composition of the prime-age male population in 1965 (or whatever the earliest year for my analysis in the previous section may have been), so as to indicate what the NILF rates and work rates would have been like if the composition of the prime-age male population composition were the same nowadays as, say, half a century earlier.
Statistically speaking, these metrics cannot tell us how much changes in family structure have altered postwar male employment patterns. For one thing, changes in US family structure are correlated with other big social changes – in education, ethnicity, nativity, and other factors – which I do not attempt to disentangle in this section. For another, any statistical associations I uncover are just that – associations – in which questions of causation remain unanswered. Recognizing these important caveats, we can begin to quantify the relationship between family structure and the decline of work for the postwar American man.
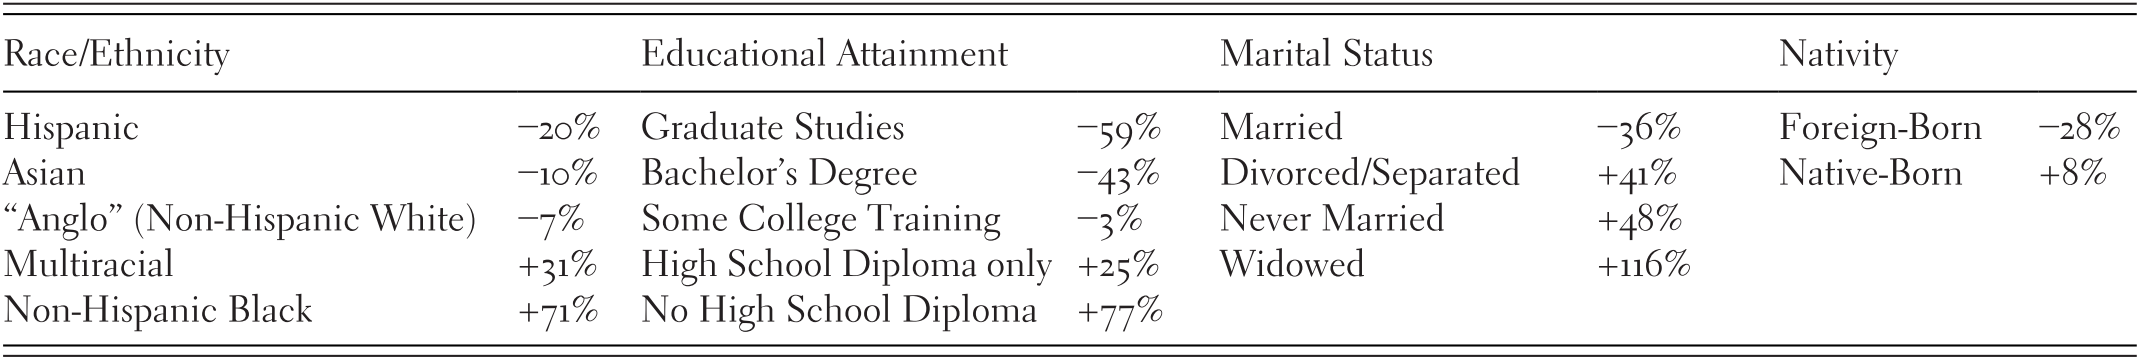
Table 5.2 outlines the relative risk for prime-age men ending up in the NILF pool by social characteristic. The interpretation of the results is straightforward: Each cell indicates how much more likely, or less likely it is that the particular group of men in question will be represented in the NILF pool than the “average” prime-age US man in the year 2015.
Table 5.2 Who is more likely – and who is less likely – to be in the 7 million pool of prime-age NILF Males? Relative odds by demographic characteristic: 2015
| Race/Ethnicity | Educational Attainment | Marital Status | Nativity | ||||
|---|---|---|---|---|---|---|---|
| Hispanic | −20% | Graduate Studies | −59% | Married | −36% | Foreign-Born | −28% |
| Asian | −10% | Bachelor’s Degree | −43% | Divorced/Separated | +41% | Native-Born | +8% |
| “Anglo” (Non-Hispanic White) | −7% | Some College Training | −3% | Never Married | +48% | ||
| Multiracial | +31% | High School Diploma only | +25% | Widowed | +116% | ||
| Non-Hispanic Black | +71% | No High School Diploma | +77% |
Consider first the factor of race and ethnicity. In 2015, non-Hispanic Whites were about 7% less likely to fall into the pool of prime-age men neither working nor looking for work than would have been suggested by their overall numbers alone. This necessarily means that non-“Anglo” minorities as a whole were overrepresented in the prime-age male NILF population. Yet, there were strikingly divergent dispositions and risks here for different ethnic minorities. On the one hand, non-Hispanic Blacks were far more likely to be NILF than their national numbers alone would have suggested: They were overrepresented by 71%. By the same token, Multiracial men were 31% more likely to be NILF than would have been expected just from their population total. On the other hand, Asian men were less likely than “Anglos” to be NILF – 10% less likely than prime-age American men as a whole – while Hispanic men were 20% less likely to be NILF than American prime-age men overall. America’s prime-age men of color, in other words, included both the ethnicities most likely to have dropped out of the labor force, and those very least likely to have done so.
Now consider the variable of nativity. On the whole, native-born men are more likely to have dropped out of the workforce than would have been predicted by their proportion in the national prime-age population: They are overrepresented by about 8% in the NILF pool. On the other hand, foreign-born men are markedly underrepresented: 28% less likely than their proportion in the overall prime-age male population would have suggested. (We may note that the great majority of foreign-born men nowadays are Asian or Hispanic – groupings, as we have already seen, distinctly less likely to be NILF; thus ethnicity and nativity appear to be significantly overlapping factors.)
With respect to educational attainment, we see a stark and already quite familiar gradient of risk. At one extreme, prime-age men with a graduate education are nearly three fifths (59%) less likely to be found in the NILF pool than the overall average; at the other extreme, prime-age men without a high school diploma are over three quarters (77%) more likely to be NILF. In between these end points, men whose highest attainment was a college degree college were 43% less likely to be NILF than the population-wide average, while men with a high school diploma were 25% more likely to be NILF, and those with some college training were close to the nationwide average (3% below it). The powerful and predictable regularity of the correlation between educational attainment and employment in America is one of the widely accepted relationships in the contemporary social sciences, and Table 5.2 demonstrates the importance of this social factor with respect to prime-age NILF men.
Thus far, the strongest NILF risks identified in the US prime-age male population in 2015 are for non-Hispanic Blacks and for high school dropouts of all ethnicities: Note furthermore that the relative risk of being NILF is of roughly the same magnitude these two groups. We might assume that part of the explanation for this outcome would be the strong overrepresentation of African–American prime-age men in the pool of high school dropouts, but such an assumption would appear to be erroneous. Within the civilian noninstitutionalized population of prime-age men, the proportion of non-Hispanic Black men with no high school diploma is only very slightly higher than the national average for all races together: 10.2% vs. 9.7% in 2015.Footnote 3 Other powerful influences, apart from differences in educational attainment levels, must also be at work determining this highly unfavorable employment outcome for Black men in modern America.
Although perhaps less generally recognized than race/ethnicity and education, marital status and family structure turn out to be powerful predictors of male employment status, too. In 2015, widowed men were over twice as likely to be in the NILF pool as their totals in the overall population would have suggested, but as already mentioned, this was a very small contingent in terms of absolute numbers. On the other hand, the very large numbers of never-married men in 2015 were 48% more likely to be NILF than their population weighting would have suggested. Separated or divorced men were over 40% more likely to be NILF than the “average” prime-age man. By contrast, married men are 36% less likely to be neither working nor looking for work.
Much the same is true for the relationship between employment status and presence of children at home. In 2015, prime-age men with no children at home were 37% more likely than average to be NILF, while those with one or more children at home were 43% less likely. Even larger differentials are evident when I parse by both marital status and presence of children at home. On the one hand, currently married men with children at home are only half as likely to be NILF (–51%) as would be expected by their overall numbers; on the other, never-married men without children at home were nearly 50% (49%) more likely to be long-term absentees from the labor force than we would have expected from their total numbers.
Those numbers underscore just how powerful a predictor of employment status for prime-age men the factor of family structure appears to be. Consider the following: In Table 5.2, the odds of being a prime-age NILF male are 50% higher for the native-born than foreign-born; 84% higher for non-Hispanic Blacks than non-Hispanic Whites; and 119% higher for men with only a high school education in relation to those whose highest degree is a college degree. By comparison, the odds of being NILF were 127% higher for a prime-age man with no children at home than one living in a home with children: A gap far larger than the Black/White differential, and indeed, slightly greater than the high school/college differential. Similarly, the odds of being NILF were over 130% higher for never-married prime-age men than for those currently married. Even greater disparities in NILF risk were evident for prime-age men who were currently married with children at home as against never-married men with no children at home: Here the odds were over 200% higher for the latter, very nearly the same differential as for high school dropouts in relation to college graduates.
Suffice it then to say that differences in marriage patterns and family structures are strongly associated with employment differentials for prime-age men in contemporary America. A quick glance at Table 5.2 offers the impression that the influence of differences in family structure may roughly in the order of differences in educational attainment for prime-age male employment, or more specifically, the risk of being absent from the labor force. That impression is reinforced by estimates of conditional compositional effects in today’s (2015) prime-age male NILF rates and work rates: Holding 2015 work and NILF rates for subgroups constant, but recalculating hypothetical national rates on the basis of these subgroups’ weighting in society as they were back in 1965, or some other earlier benchmark year in the previous section of this chapter (see Figure 5.18).
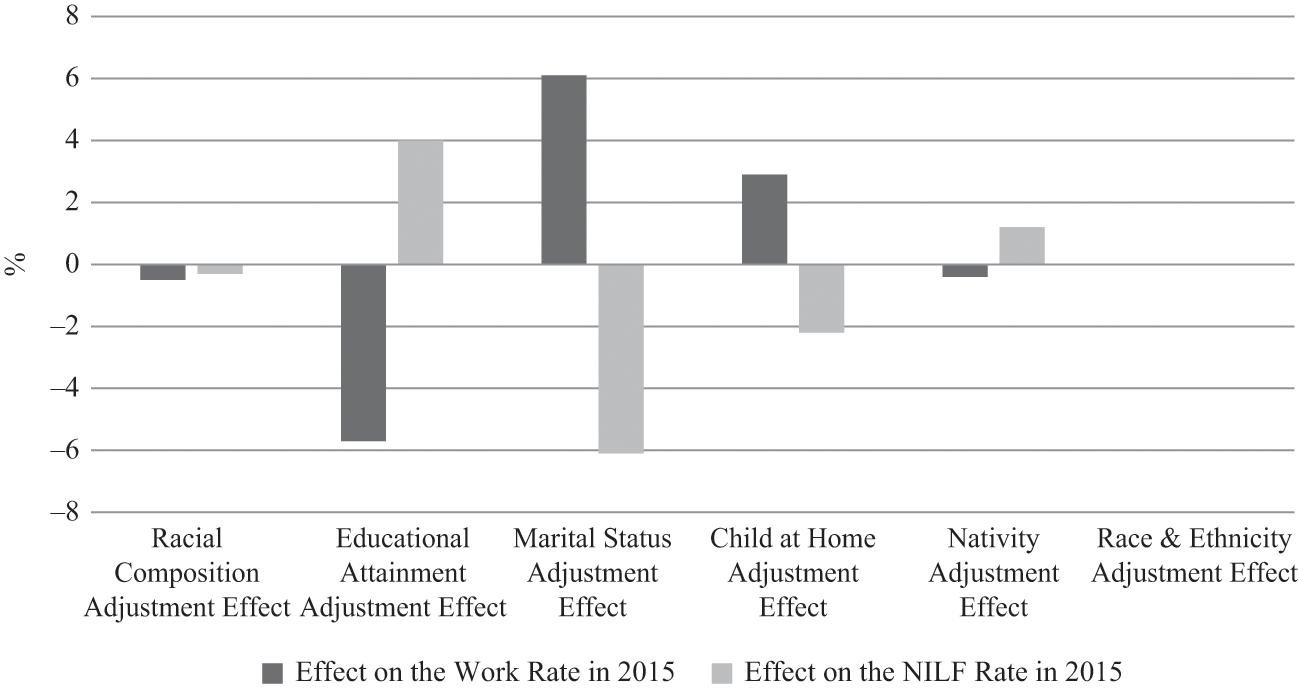
Figure 5.18 Conditional compositional effects on prime-age male work rates and NILF rates in 2015
Perhaps surprisingly, America’s shifting postwar racial and ethnic composition appears, by my calculations, to have had very little impact at all on changes in either work rates or NILF rates for prime-age men. Superimposing the 1965 “race” distribution for prime-age men on 2015 race-specific work rates results essentially in zero adjustment against either actual reported 2015 prime-age male work rates or their NILF rates. A very slight (half of 1 percentage point) downward adjustment in work rates would result from matching the 1971 racial and ethnic composition of the prime-age male population against work rates by ethnicity for 2015, while at the same time such an exercise would result in a downward reduction of NILF rates by less than one third of 1 percentage point. In effect, increasing ethnic diversity looks to have had little impact with respect to prime-age male employment status: Poor performance by non-Hispanic Blacks and some other less populous groupings were balanced out by the above-average performance of other groups, specifically Asians and Hispanics.Footnote 4
The conditional compositional effect for nativity looks to be somewhat larger than for race and ethnicity. With current (2015) nativity-specific work rates but a 1994 breakdown of population by nativity, prime-age male work rates would have been 0.4 percentage points lower in 2015 than those actually recorded – actual work rates over that period declined by 2.3 points. By the same token, the conditional compositional adjustment raises NILF rates by over one point; in actuality, NILF rates fell by about three points over that same period. These hypotheticals suggest that the overall employment profile of contemporary prime-age men would look worse, not better, without the intervening influx of foreign-born prime-age men.
Educational attainment, however, appears to exert a larger influence on adjustments for work rates and NILF rates than either race and ethnicity, or nativity. With 2015 education-specific work rates but 1965 distributions of educational attainment, the conditional calculation for prime-age male work rates would be 5.7 percentage points lower than those actually recorded in 2015, and the conditional calculation for NILF rates would be 4 points higher. Those hypothetical adjustments can be compared with the actual drop in work rates of 9.3 points, and the jump in NILF rates of 8.8 points. By these illustrative computations, improvements in educational attainment appear to have played a very important role in preventing a far worse decline in male work over the past half-century. Hypothetically speaking, with today’s education-specific rates and a 1965 distribution of educational attainment, the drop in prime-age male work rates would be over half again as dramatic as that which took place, and the jump in NILF rates would likewise be almost half again as large as what was actually recorded.
Big as these hypothetical conditional adjustment effects for educational attainment may appear, those for marital status are of the same magnitude – in fact, even a bit larger. Whereas the calculated compositional effect for changes in educational attainment for 1965–2015 on prime-age male work rates amounted to –5.7 points, it would be +6.1 points for marital status. Where the calculated compositional effect for educational attainment over those same years on NILF rates would be +4 points, it would be –5.7 points for marital status. By one reading, this might suggest that that the impact on prime-age male work rates and NILF rates from changes in marriage patterns would have been sufficient to cancel out the impact of half a century of improvements in educational attainment, entirely – and then some.
I may note as well that the conditional compositional effect for presence of children at home (using a 1968 benchmark) would adjust work rates upward by nearly 3 points (2.9 points) against their actual 2015 levels, and would adjust NILF rates downward by more than 2 points (–2.2 points). Even without more refined calculations, taking into account the marital status of men in homes with children, it is apparent that the “child at home factor” looks to be somewhat over half as large in magnitude as the educational attainment factor.
In this section, we have seen that marital status and family structure correlate strongly with employment status for prime-age men nowadays – indeed, that the predictive power of family structure on work rates and NILF rates are on a par with that of education, which is commonly recognized as an extremely powerful factor in social outcomes. We have also seen that changes in family structure over time could be associated with changes in male work patterns over time, and that, here again, the conditional compositional effect on male employment patterns over the past half-century might be of the same absolute magnitude as improvements in educational attainment, albeit weighing in the opposite. However, we need to look at these relationships more closely to draw inferences about the independent statistical contribution of changes in family structure to changes in male work patterns, to say nothing about causality or the possible casual mechanisms at play here.
Is Family Structure a Determinant of Postwar Male Work Patterns?
Establishing a correlation or association between two factors – even a strong one – is not the same thing as establishing an independent and causal influence of one factor on the other. For one thing, such associations may be due to additional, unobserved conditions or variables with which both observed factors happen to correlate. However, even if a genuinely independent and statistically meaningful relationship can be established between two factors, that correlation tells us nothing about the direction of causality: In statistical jargon, we cannot tell which variable is independent and which is dependent simply by demonstrating that a relationship exists in the first place.
In the context of the family structure/male employment relationship, these cautionary methodological generalizations have at least two immediate and practical implications. First, it could be possible that the correlation we have detected between family structure and male employment patterns are in reality due largely, or entirely, to a deeper underlying relationship between male employment patterns and some other factor closely tracking with changes in family structure: Educational attainment, for example, or race and ethnicity, or health. Second, even if a methodologically sound and independent relationship between family structure and male employment patterns could be identified, this would tell us nothing about which variable was influencing which. Far from assuming that family structure is affecting employment patterns, one might instead make the case that the declining availability of work for men is forcing a disintegration of traditional family patterns, as ever greater numbers of disadvantaged men find it impossible to find spouses and earn the wherewithal to form families. As it happens, recent social science studies include methodologically sound research by authors pointing the arrow of causality in each of these opposing directions (Ahituv and Lerman Reference Ahituv and Lerman2007; Autor, Dorn, and Hanson 2017).
An exhaustive examination of these methodological issues cannot be undertaken in this brief section; It will suffice instead to make two simple points. First, controlling for such important social factors as race/ethnicity and education does not eliminate the strong relationship between family structure and male employment patterns. Second, while the “declining male work causes declining male marriage” interpretation of causality is inherently plausible, and may indeed persuasively speak to part of the observed association between employment and family structure for US men, it also leaves a number of important aspects of the contemporary social tableau manifestly unexplained.
Consider, to begin, the potentially confounding factors of race/ethnicity and education. It is true that each of two factors tends to correlate with family structure and male work rates at one and the same time. With respect to ethnicity, Asian prime-age men report the highest proportion of those currently married and among the highest work rates; conversely, non-Hispanic Blacks report among the lowest numbers currently married and among the lowest work rates. By the same token, with respect to education, overall work rates and proportions currently married are lowest for prime-age men without a high school diploma and highest for those with a college degree or graduate education.
Clearly, race and education have a bearing on family structure in modern America, but when I attempt to control for them, a residual independent “family structure” effect is revealed, and its association with male employment profiles appears to be a strong one.
As already mentioned, a significant differential separates workforce participation rates for currently married and never-married prime-age men of every major US ethnic or “racial” grouping: White, Black, Hispanic, and Asian. As we already know, overall prime-age male NILF rates are much lower for Blacks than Whites 18.8% vs. 10.0% in 2015. Nevertheless, workforce participation rates for prime-age married Black men are distinctly higher nowadays than those for never-married White men, and have been for decades (see Figure 5.19). In this particularly vivid example, the “marriage effect” trumps the “race effect” – and it is by no means the only such example that could be adduced.
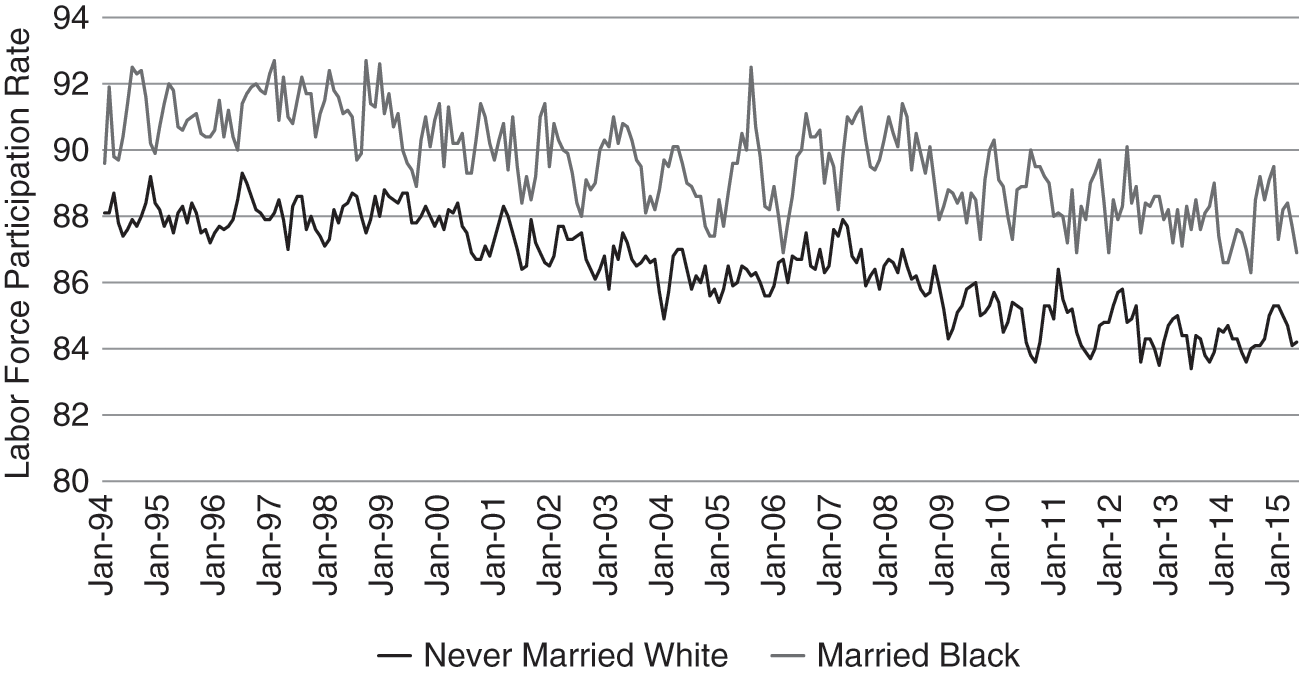
Figure 5.19 Labor force participation rate for males aged 25–54 by marital status and race: married Black vs. never-married White
To be sure, Figure 5.19 does not control for education, and it is possible that the educational profile of married Blacks could be different from (and more favorable than) that of their never-married White peers. However, if we look at education, we find that currently married prime-age men of all ethnicities report higher workforce participation if they are currently married than not currently married (divorced/separated, widowed, or never married) – and that this holds for every level of educational attainment. The lower the level of educational attainment, the greater the gap in workforce participation between men who are married and men who are not. Indeed, despite their ostensible disadvantages in the contemporary labor market, married high school dropouts record roughly the same workforce participation rates as never-married college graduates (see Figure 5.20). Here we see a particularly instructive instance of the “marriage effect,” one in which it apparently compensates entirely for the “education effect” with regard to workforce participation rates for prime-age American men.

Figure 5.20 Labor force participation rate for males aged 25–54 by marital status and educational attainment: never married with bachelor’s degree or higher vs. married high school dropout
I could provide similar examples of the effect of marital status after controlling for race and education, and analogous examples for the influence of the “child at home” effect after controlling for other social factors, but the point should already be clear: Even after controlling for other social factors, we see a strong residual “family structure” effect in play after taking such formidable social forces as race and education into account. The plain fact is, all other things being equal, currently married prime-age men appear to have consistently higher work rates and consistently lower NILF rates than those whose are not currently married – and the same holds true for prime-age men who have children living in their home.
Isolating a “marriage effect” or a “family structure effect,” of course, does nothing to clarify the direction of causality between changes in employment patterns and changes in family patterns. An inherently plausible case can be made that the decline of work is driving the decline of marriage and family formation for men. In this interpretation, the key factor in the decline of male work is a decline in the demand for male labor due to structural economic change: Technological change, globalization and trade, decline of manufacturing, outsourcing and all the rest. (The important 2016 study on the decline in prime age male labor force participation rates by the President’s Council of Economic Advisers is representative of this broadly accepted school of thought.) By this assessment, for example, demand for lower skilled male labor has fallen disproportionately over the postwar era, so marriage among lower skilled men has also fallen disproportionately during the postwar era.
On the face of it, this “demand-side” hypothesis would seem to have much to commend it. I would certainly not contest the proposition that it can explain some, perhaps even much, of the decline in employment for prime-age men over the past two generations. However, it clearly cannot explain all of it. In a number of important respects, the labor market patterns for prime-age men that have unfolded over the past half-century look to be fundamentally inconsistent with the “demand-side” hypothesis – and thus with the assessment that causality leads from changes in work patterns to changes in family structure.
Three empirical challenges to the “demand-side” theory deserve particular attention. The first is the trajectory of the prime-age male “inactivity rate” – the percentage of men not in the workforce – over the 1965–2015 period (see Figure 5.21). The trouble for the “demand-side” theory is the remarkable regularity of this trend: It is almost a straight line upward for fully fifty years. There is no indication whatever of any influence of the business cycle: The Great Recession of 2008/09 is not visible, nor for that matter are any of the previous six recessions that occurred over the decades between 1965 and 2008. Likewise with respect to trade shocks, it is impossible to detect the NAFTA agreement, or of China’s entry into the WTO, in the steadily increasing inactivity rates over these years. As with regard to technological disruptions, it is impossible to identify from the prime-age male inactivity rate the trend line for the advent of personal computers, Internet use, or any of the other great innovations that may have had a profound or disruptive effects on the demand for labor over these years. While the remarkable smoothness of the ascent in inactivity rates does not concord with any of these many major “demand-side” shocks, we note that it does track with the relative smoothness of the trends in changing family structure over the past two generations at the aggregate or national, level.

Figure 5.21 Rate of nonlabor force participation from 1965 to 2016: US civilian noninstitutionalized males aged 25–54
Second, there is the curious and, for the labor market-driven causality theory, rather inconvenient pattern of prime-age male inactivity rates at the state level (see Figure 5.22). From 1980 to 2014, interstate variations in such inactivity rates steadily increased, even though one would ordinarily expect a nationwide labor market to seek equilibrium in the wake of demand shocks. Furthermore, some of the states with the very highest prime-age male inactivity rates (for example, Maine) happened to border some of the states with the very lowest inactivity rates (e.g., New Hampshire – Maine’s only land boundary within the United States). On first impression, these growing state-level imbalances do not look like “demand-side” problems but rather “supply-side” problems: Insufficiency of migration or mobility. However, it should be remembered that the family structure-to-employment profile causation hypothesis is also a “supply-side” labor theory, since it implicitly posits that men who are not currently married and/or do not have children at home are less likely to seek work than those who do.
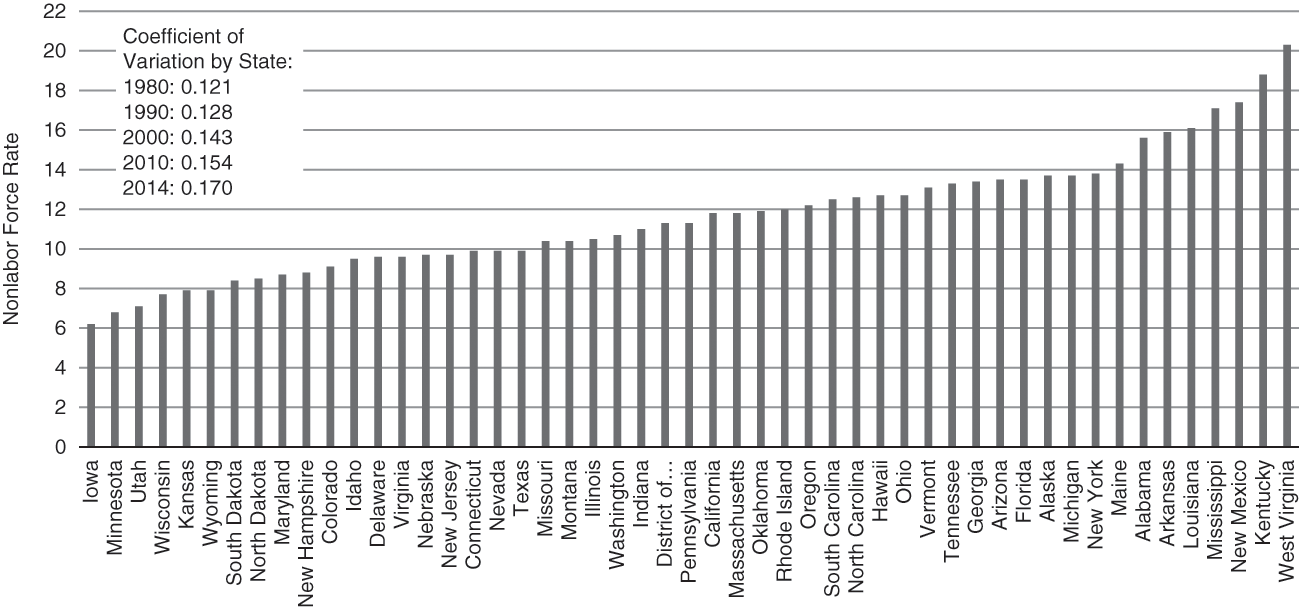
Figure 5.22 Nonlabor force rates among prime-age males by state (2015)
Finally, there is the matter of the wildly disparate workforce participation rates for less skilled men in accordance with their marital status (see Figure 5.23). According to CPS data, in 2015, a gap of almost 20 percentage points separated labor force participation rates for currently married and never-married prime-age male high school dropouts. This means that between 1965 and 2015 prime-age male LFPRs fell by about 8 percentage points for unmarried high school dropouts – somewhat less than for the prime-age male population as a whole – while they fell by almost 28 percentage points for never-married high school dropouts. If we attempt to explain this extraordinary disparity in outcomes as a “demand-side” effect, we are also obliged to come up with an explanation for why the demand for labor would drop so very little for less skilled men with more traditional family structures, and so radically for those with alternative family structures. To date, I am unaware of any such theorizing yet attempting such acrobatics.

Figure 5.23 Labor force participation rate for males aged 25–54 by marital status and educational attainment lower than a high school diploma
These few pages can only begin to address the complexities of a quantitative investigation of family structure as a determinant of male employment patterns in contemporary America. What I hope to have demonstrated, however, is that further rigorous examination of this topic is warranted, as there appears to be evidence of an independent relationship between family structure and employment patterns after holding other potentially confounding variables constant – and reason as well to believe there may be some genuine causal relationship between changes in family structure and changes in male employment patterns in postwar America (in additional to whatever causal relationships may work in the other direction).
Concluding Observations
This chapter has made the case that changing patterns for marriage and living arrangements correspond strongly with changing patterns of male employment in the United States over the postwar era, or, to offer a formulation perhaps more in keeping with the framing of this volume, that there is a strong relationship between increasing family inequality and increasing male employment inequality in contemporary America. I have offered evidence that differences in family structure track with differences in male employment patterns, even after taking account of alternative and perhaps competing social factors, such as race/ethnicity and education. Furthermore, I have offered evidence of a causal relationship between changes in family structure and changes in male employment patterns – evidence that the competing hypothesis of employment (“demand-side”)-driven changes in family patterns cannot explain readily, if at all. This chapter does not presume to undertake an exhaustive examination of the topic, but it does attempt to provide sufficient groundwork to justify and encourage further and more exhaustive research in this area.
It may be suitable to conclude by indicating some potentially fruitful directions for such work. This chapter established evidence of broad relationships on the basis of aggregate “macro”-statistics of a cross-sectional nature. For delving deeper into the dynamics of this relationship, and for teasing out possible causal mechanisms, quantitative analysis microdata would appear to be most suitable – and ideally, microdata from a longitudinal survey, as such information would help us better understand how and whether male employment behavior changes in the aftermath of changes in marital status or living arrangements.
It might also be beneficial, if possible, to add several additional social variables I did not include in my examination for this study. One of these would be prime-age male utilization of government benefits, including means-tested benefits and disability program benefits. Broadly speaking, we know that unemployed men are more likely to participate in such programs nowadays than employed men, and that NILF men are more likely to participate in them than unemployed men, but the interplay with family structure, and the issue of “demand-side” versus “supply-side” drivers of such increased participation, surely deserves more careful illumination. Another, and scarcely less important, variable would be criminal justice system history – in particular, previous criminal conviction record or comparable serious criminal history. Between the early 1960s and 2010, the number of adults in the United States with a criminal record is estimated to have more than quadrupled (Shannon et al. Reference Shannon, Uggen, Schnittker, Thompson, Wakefield and Massoglia2017). Rough calculations suggest that something like one in eight adult men not behind bars in the United States may have a criminal conviction in his past – the figure for prime-age men today may be even higher (Eberstadt Reference Eberstadt2016). Criminal justice status may possibly be the most important typically unexplored variable in social research on the dynamics of change in family structure and male employment. Casting light on this strangely unexplored dimension of modern American life would surely permit us to clarify and refine our understanding of the dynamics of family inequality and employment inequality in modern America.


 Open access