


Introduction
Understanding the physics and chemistry of ice is of primary importance for ice-core studies; this is because many climatic variables are recorded in the ice (Reference HondohHondoh, 2000). Among them, electrical properties are very useful indicators because they can reveal microscopic properties such as molecule reorientation processes, lattice vibrations, density of lattice defects, and impurities within lattice defects (see, e.g., Reference Petrenko and WhitworthPetrenko and Whitworth, 1999). Electrical measurements can be used to quickly obtain some relevant information before more specialized methods are used.
A few electrical methods have been used for ice-core studies. They are known as electrical conductivity measurement (ECM; Reference HammerHammer, 1980) and dielectric profiling (DEP; Reference Moore and ParenMoore and Paren, 1987; Reference Wilhelms, Kipfstuhl, Miller, Heinloth and FirestoneWilhelms and others, 1998). ECM measures the d.c. current between two electrodes contacting a freshly prepared, smooth surface of the ice core. the applied voltage ranges from 350 to 2000V. Through a number of studies in the last two decades, the change in d.c. current along an ice core has been understood as a semi-quantitative indicator of ice acidity. DEP uses the measured dielectric permittivity and the electrical conductivity at frequencies up to 1 MHz. DEP has a spatial resolution of 5–20mm and uses an applied voltage of 1–3Von the ice. the DEP high-frequency-limit electrical conductivity is correlated to the concentration of the acids, chloride and the ammonium (Reference Moore, Wolff, Clausen, Hammer, Legrand and FuhrerMoore and others, 1994; Reference Wolff and HondohWolff, 2000). Here, the high-frequency limit is at frequencies well above the Debye-type dispersions but below the microwave frequencies. Another method is AC-ECM, which was designed (Reference Sugiyama, Fujita, Sueoka, Mae and HondohSugiyama and others, 1995, Reference Sugiyama and Hondoh2000) to have the geometrical features of resolution from the ECM method and the advantage of acquiring the high-frequency-limit conduction with the low energy of the DEP method.The AC-ECM method measures the complex admittance at the surface of ice with coaxial electrodes and can detect acidity variations in ice at the scale of the distance between the two electrodes. for the AC-ECM, the quantitative effects on the electrical properties of ice remain unknown for non-acid components such as ammonium or chloride. Reference Sugiyama, Fujita, Sueoka, Mae and HondohSugiyama and others (1995) demonstrated that at temperatures below –20˚C and at a frequency of 1 MHz, the complex admittance approaches a limiting value above the Debye dispersion.
Two methods, AC-ECMand ECM, were used in the coring project at Dome Fuji (hereafter Dome F) (Reference FujitaFujita and others, 2002). At core depths of 112.65–2503.07m, the electrical measurements were performed with both methods on the same ice samples with a typical sampling interval of 2 mm. These measurements enabled us to investigate in detail a one-to-one correlation between signals from the two methods. the AC loss factor, which is defined as the ratio of the real to imaginary parts of the complex admittance, is a useful parameter measured by the AC-ECM. Although they respond differently to acidity in detail, both the AC loss factor and the ECM current increase with the acidity (Reference FujitaFujita and others, 2002). to better understand the properties of the 2503m Dome F ice core, we clarify some of the differences between these two methods and compare them to chemical analyses of the ice.
We performed various electrical measurements on ice-core sections at a range of temperatures to better understand the advantages and disadvantages of the two methods. We measured the high-frequency-limit conductivity (hereafter the HF conductivity) and the complex dielectric permittivity using a parallel-plate capacitor and auto-balance bridge. the HF conductivity is linearly related to acidity in cores that have low concentrations of sea-salt chloride and ammonium (Reference Moore, Wolff, Clausen, Hammer, Legrand and FuhrerMoore and others, 1994; Reference Wolff and HondohWolff, 2000). Artificially grown, acid-doped ices also have a linear relation between acidity and HF conductivity (see, e.g.,Reference Moore and FujitaMoore and Fujita, 1993; Reference Fujita, Matsuoka, Ishida, Matsuoka, Mae and HondohFujita and others, 2000). In addition to the electrical measurements, we analyzed the major chemical constituents to determine their effects on the electrical properties.
The aim of this paper is to present details of the laboratory experiments, the experimental results, and applications of the results to ice-core studies. In particular, the results from this paper are used to interpret the 2503 mDome F ice core in a companion paper (Reference FujitaFujita and others, 2002).
Experimental
For the measurements, samples from 167 depths were selected from cores down to 2000 mdepth.Measurements were made by putting a slab of ice between the plates of a parallel-plate capacitor that was connected to an auto-balance bridge. the principle and the measured quantities are the same as those in the DEP method, although the DEP method samples the electrical field in the geometry of cylindrical ice cores (Reference Moore and ParenMoore and Paren, 1987; Reference Wilhelms, Kipfstuhl, Miller, Heinloth and FirestoneWilhelms and others, 1998).
Background theory
We measured complex permittivity and the electrical conductivity. Solid ice is known to follow a Debye-type relaxation process with relaxation frequencies in the kHz range (e.g. Reference Auty and ColeAuty and Cole, 1952). This relaxation process is explained by the reorientation of water molecules in ice lattice. Following several earlier investigators (e.g. Reference Hippel, Knoll and WestphalHippel and others, 1971; Reference Camplin, Glen and ParenCamplin and others, 1978; Reference Gross, Hayslip and HoyGross and others, 1980), we assume that the dielectric spectrum of ice consists of a small number of dipolar relaxation ranges, each having a single relaxation time τ; in this case, the complex permittivity ![]() is a sum over the ranges:
is a sum over the ranges:
Here ![]() is the real part of the high-frequency-limit permittivity.
is the real part of the high-frequency-limit permittivity. ![]() ω and τi are the dispersion strength of each dispersion, angular frequency, and relaxation time for each relaxation process, respectively. According to this expression, the imaginary part of the permittivity for each relaxation process is largest when ωτi is 1 for each relaxation process. In a measurement, the ω at a peak of the imaginary part is found and then the corresponding relaxation time
ω and τi are the dispersion strength of each dispersion, angular frequency, and relaxation time for each relaxation process, respectively. According to this expression, the imaginary part of the permittivity for each relaxation process is largest when ωτi is 1 for each relaxation process. In a measurement, the ω at a peak of the imaginary part is found and then the corresponding relaxation time ![]() is determined. Therefore, by measuring the complex permittivity, we can determine the relaxation time of the Debye dispersion.
is determined. Therefore, by measuring the complex permittivity, we can determine the relaxation time of the Debye dispersion.
The relaxation time gives information on the state of the reorienting water molecules. According to measurements with pure, artificial, single crystals (e.g. Reference Camplin, Glen and ParenCamplin and others, 1978; Reference KawadaKawada, 1978), the relaxation time is about 10–4 s at –15˚C and10–2 s at –65˚C (Fig. 5, shown later). the relaxation time is fitted by the Arrhenius equation as τ=τ0 exp(E/kT), where τ0, E, k and T are the pre-exponential factor, the activation energy, Boltzmann’s constant and the absolute temperature, respectively. In liquid water at 0˚C, the relaxation time is about 10–11 s (Reference RayRay,1972). Also, water molecules at ice/ air interfaces have a quasi-liquid layer (QLL), and the relaxation time is longer than that of liquid water by an order of magnitude (Reference Mizuno and HanafusaMizuno and Hanafusa, 1987). Thus, by fitting our measured relaxation times to the Arrhenius equation, and comparing the data to measurements on other ice samples, we can infer some properties of the reorienting water molecules in ice-core samples.
The electrical conductivity is an important parameter for understanding electrical conduction measured by ECM and AC-ECM. the electrical conductivity σ is written using the imaginary part of permittivity ![]() at AC frequencies. from Equation (1), well above the relaxation frequencies of all Debye relaxation processes, the conductivity is
at AC frequencies. from Equation (1), well above the relaxation frequencies of all Debye relaxation processes, the conductivity is
If the relaxation time follows the Arrhenius equation, Equation (2) becomes
Here, Ei is the activation energy for each relaxation time.
Experimental set-up
The capacitance of 1cm thick disk-shaped samples was measured using 3.8 cm diameter parallel-plate electrodes (HP model 16451B) and an auto-balance bridge (HP model 4284A) designed for a frequency range of 20 Hz to 1 MHz. the actual measurements were performed using 21 different frequencies equally distributed in a logarithmic scale between 20 Hz and 1 MHz.
Samples
We prepared two groups of samples from the 2503 m Dome F ice core. One group represents a statistical sample of the entire ice core: 154 sections of ice from 15 different depth ranges were chosen randomly for measurements. the second group of samples came from ice sections that had a peak in the AC loss factor. Such electrical peaks are mostly from sulfuric acid that was deposited in the ice from volcanic gases and aerosols (e.g. Reference HammerHammer, 1980; Reference Langway, Osada, Clausen, Hammer and ShojiLangway and others, 1995), which is verified later in this paper. Samples were chosen from three depths at 659.48, 1017.72 and 1941.20 m. Most samples for both groups were prepared at a constant temperature of –213C. the complete ice-core record with hundreds of peaks is in Reference FujitaFujita and others (2002), and 40 cm sections centered on peaks at the above three depths are shown in Figure 1. This figure shows the AC loss factor and the ECM current for these three samples. the AC loss generally increases with energy loss due to electrical conduction per cycle (Reference FujitaFujita and others, 2002), whereas the ECM current generally increases with bulk conductivity. However, AC loss shows a clear tendency to diffusion, i.e. the AC loss peak heights decrease and peak widths increase with increasing depth, whereas the ECM current peak widths increase but the peak heights do not clearly decrease with increasing depth. We are particularly interested in this difference in height between the a.c. peaks and the d.c. peaks because the difference seems to come from the difference in their respective conduction processes. the features shown in Figure 1 were generally seen throughout all the spikes in the ice core. In addition, the prominent acid spikes are mostly from H2SO4 (and in a few cases HCl and HF) (Reference Langway, Osada, Clausen, Hammer and ShojiLangway and others, 1995). We carried out measurements on 13 different positions from these three samples at –21˚C, and also made HF conductivity and dielectric measurements at temperatures from –110˚ to –20˚C on the peaks shaded in Figure 1. the main purpose of these low-temperature measurements was to determine if the sulfate/water/ice eutectic point influences the measurements. By measuring the relaxation time at a range of temperatures, we found both a low-temperature and a high-temperature activation energy. We argue that the transition temperature between the two regimes is the eutectic point of the solute/water/ice system where the conduction path changes from that in the liquid at the warm temperatures to that in the solid at the cold temperatures.
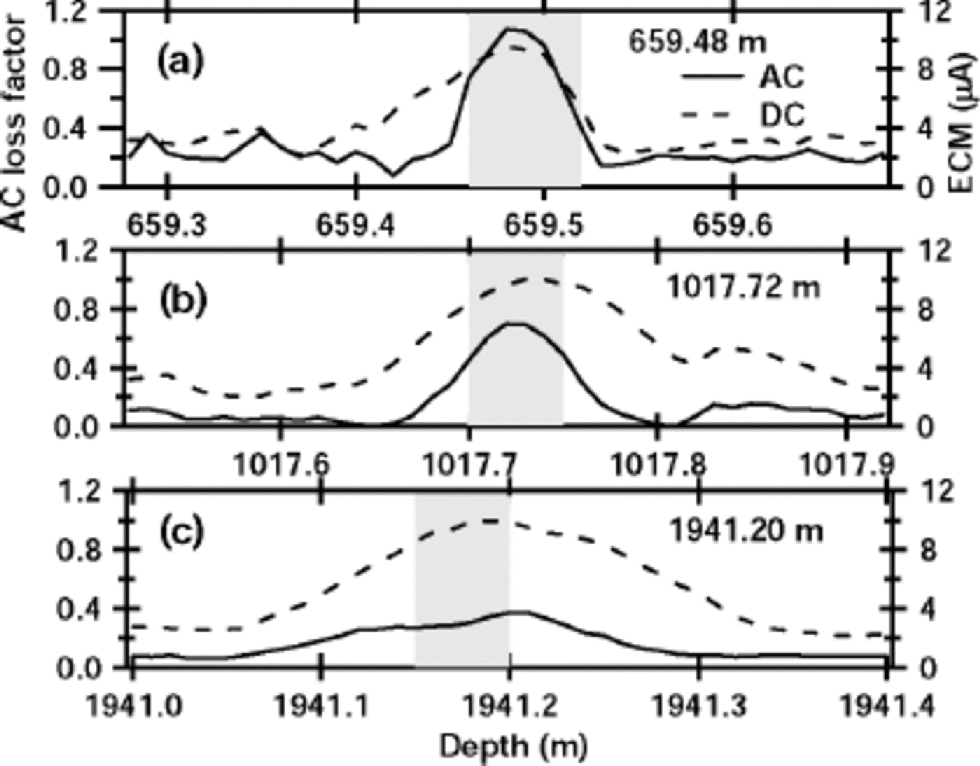
Fig. 1 Three examples of peaks in electrical profiles of the 2503 m Dome F ice core. the solid line in each plot is the AC loss factor with scale at left. the AC loss factor is the ratio of the real to the imaginary part of the complex admittance and is measured by the AC-ECM (Reference FujitaFujita and others, 2002). the dashed line in each plot is the ECM current with scale at right. These examples were chosen from many hundreds of major electrical peaks measured on the 2503 m ice core. Samples from the shaded parts were used for the measurements at temperature down to –110˚C.
Procedures
Ice slabs 1cm thick were cut lengthwise along the cylindrical axis of the ice cores using a band-sawsuch that the roughness scale of the cut surface was <0.2mm. for the three samples containing strong acid peaks, the surface was further finished with a microtome knife. Each slab was then sandwiched between a pair of metal-plate electrodes. the electrodes contacted the surface of each sample without introducing any intervening conductive paste, oil, water or foil; hence, the physical contacts were probably microscopically imperfect and thus should have introduced measurement errors from the space-charge effect and the small air gaps. However, several comparison measurements using single crystals and conductive paste showed that such errors for the high-frequency permittivity and the high-frequency conductivity were within a few per cent at the high frequencies that we used. At low frequencies, the error caused by imperfect contacts was typically 50%, but due to the extra time involved we did not use the conductive paste.
The constant-temperature measurements were done in a cold room at –21˚C. for the experiments at a range of temperatures, we first attached the electrodes to the samples at –20˚C, then put the samples in a freezer, and reduced the temperature to –110˚C in 7–8 hours. These measurements were then done as the temperature rose at a rate of 2–5˚C h–1. We passed cold nitrogen gas over the sample to maintain a slow temperature increase. Except for temperatures between –83˚ and –60˚C, measurements were done at every 2˚C; at temperatures between –83˚ and –60˚C, they were done at every 0.4˚C to check for a eutectic point. Temperature measurements were done using several T-type thermocouples attached to the electrodes with an accuracy of ±0.2˚C and a resolution of ±0.1˚C. We found that the difference between the measured temperature from several different thermocouples at the same time was within 1˚C. Because of the heat capacity of the 1cm thick samples, we estimate that the possible maximum temperature lag between ice temperature and the measured temperature was within 1˚C. the AC loss factor at –25˚C, which is the standard temperature for this measurement for Dome F ice (Reference FujitaFujita and others, 2002), was averaged over the 3.8 cm diameter of the parallel-plate capacitor.
Chemical analysis
To determine the relation between the measured electrical properties and the chemical constituents in the solid ice, we measured the major anions and cations SO4 2–, Cl–, NO3 –, NH4 +, Na+, Ca2+, K+, Mg2+ and several other components. Chemical analysis was done on the three portions of the core shown in Figure 1; these sections are the approximately 1m portions centered at 659.48, 1017.72 and 1941.20m. Chemical analyses typically required 3–10 cm long samples. Two series of chemical analyses were done. One was for the slab samples; the other was for the rest of the samples not used for electrical measurements. These two sets of measurements from the same depths showed essentially consistent results.
Results
Relation between HF conductivity, AC-ECM signals, ECM signals and chemical content
We demonstrate first that the sulfuric acid molarity was highly correlated to the AC loss factor but only weakly correlated with the ECM current. Among all major anions and cations, we found that only SO4 2– has significant correlation with the AC loss factor and the ECM current. Figure 2 shows that the molarity of SO4 2– ions is well correlated to the AC loss factors at –25˚C for the three portions indicated in Figure
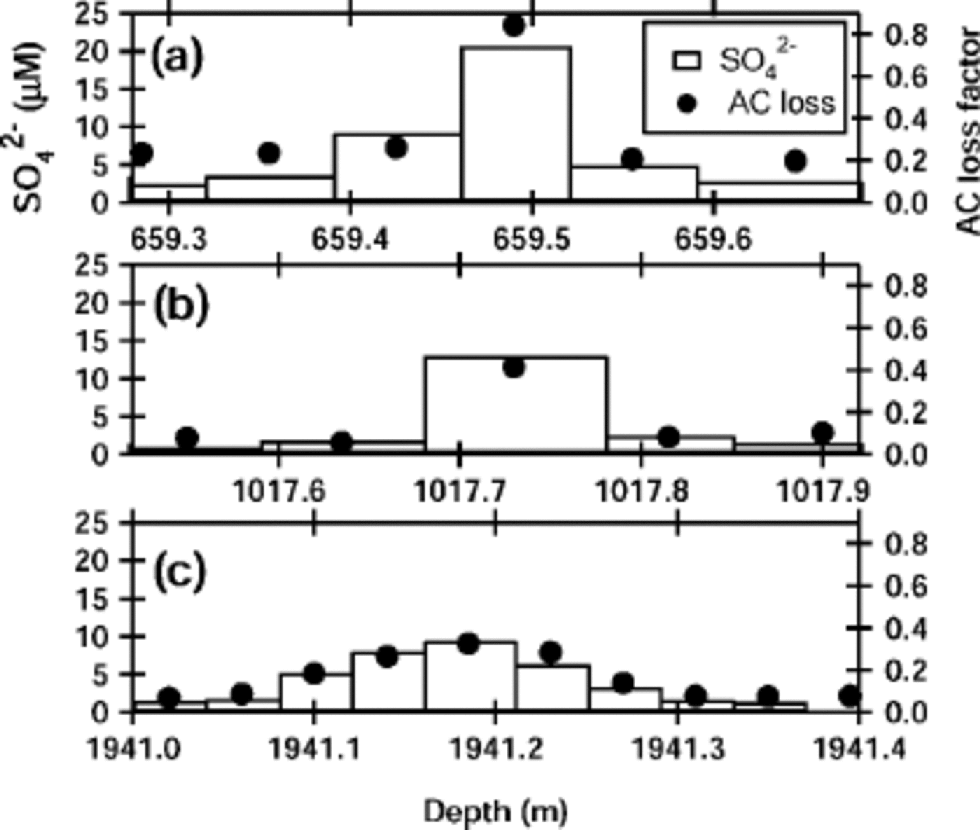
Fig. 2 Sulfate ion concentrations at the three examples of peaks indicated in Figure 1. Bars indicate molarity of the sulfate at 3–10 cm portions of the ice, with scale at left. the AC loss factor, with scale at right, is averaged along the measurement region of the chemical analysis at each portion.
-
1. This correlation is further demonstrated in Figure 3a. In contrast to the linear relation between the AC loss factor and the sulfuric acid concentration, the ECM current only weakly correlates with the sulfuric acid content. the least-squares fit to a linear relation between AC loss factor and the sulfuric acid is

Fig. 3 Interrelations among the HF conductivities, AC loss factors, ECMsignals and sulfate molarities. (a) AC loss factor (left axis) and ECM current (right axis) vs molarity of sulfate. Data points are from three portions indicated in Figure 1. More data points are shown than in Figure 2, because of another series chemical analysis not shown in Figure 2. for the ECM current, depths in meters for the larger values are labeled. (b) AC loss factor (left) vs HFconductivity (bottom). Data are from 167 depth points in the 2503 m Dome F ice core. the rightmost three data points are from the shaded parts in Figure1. (c) ECM current (left) vs HF conductivity (bottom). 167 data points are from the same sample depths as used in (b). Distribution of the data points was emphasized by shading. Depths in meters for the larger values are labeled.
which is plotted in Figure 3a. Here, δ is the A Closs factor and [SO4 2–] is the molarity of sulfuric acid expressed in μM.
Comparisons between the HF conductivity and both the AC loss factor and the ECM current indicate how these signals relate to each other. In particular, the HF conductivity is known to be related linearly to acidity in ice cores and artificially grown polycrystalline ice (Reference Moore and FujitaMoore and Fujita, 1993; Reference Fujita, Matsuoka, Ishida, Matsuoka, Mae and HondohFujita and others, 2000). In the glacial-period ice in the Greenland ice core where ice is less acidic or alkaline, increases of Cl– and NH4 + slightly increase the HF conductivity (Reference Moore, Wolff, Clausen, Hammer, Legrand and FuhrerMoore and others, 1994). Figure 3b shows that the AC loss factor at –25˚C is approximately proportional to the high-frequency-limit conductivity at –21˚C. This proportionality agrees with our previous study (Reference Sugiyama and HondohSugiyama and others, 2000). from the data points, the best linear fit of HF conductivity σ to AC loss factor δ is
The estimated errors are the standard deviations. This empirical equation suggests that the relative error is smaller when the first term is larger. for example, the relative error is <5% when δ is 1. In contrast, the relative error approaches 30% when δ approaches zero.
Figure 3c shows the relation between the ECM current and the HF conductivity. This plot showed large scatter, which is consistent with the large amount of scatter for the ECM current in Figure 3a. for example, for ECM values of 8–10 μA, the corresponding HF conductivity ranges throughout 30–120 μS m–1 .This suggests that the ECM currents correlate only weakly to both sulfuric acid peaks and the HF conductivity. from the chemical analysis, we found no indication that other chemical components such as Cl– and NH4 + are correlated to σ. Data scatter is smaller when values are smaller.
Effect of temperature on HF conductivity
Measurements at a range of temperatures are useful for identifying the conduction mechanisms. for the three peak samples, the HF conductivity shown in Figure 4 decreases with decreasing temperature but at a lower rate than for pure, single-crystal ice above –50˚C. Also, unlike the single-crystal ice, which has a change of slope near –50˚C, the peak samples have a smaller change in slope at –81±1˚C. the HF conductivity discontinuously decreased by about 15–20% at this temperature (Fig.4b). the change in slope in the Arrhenius plot means that the activation energy changes at this critical temperature, which is hereafter called Tc. the HF conductivities for 17 additional core samples taken away from AC loss peaks (hereafter called non-peak samples) had no significant slope change near Tc. An example of the HF values from the non-peak sample at 2001.05m is shown in Figure 4. This is a sample that showed the lowest conductivity among the 17 samples; at the warmest temperatures, the conductivity values nearly equal those for pure, single-crystal ice, which are about 10 times less than the HF conductivities from the peak samples. But at the lowest temperatures, the conductivity follows the slope of the peak samples and is only about three times smaller. At temperatures below about –50˚C, the lowest HF values from ordinary samples are about 10 times larger than the pure ice values.

Fig. 4 Arrhenius plot of the HFconductivity at 1MHz of the three peak samples in Figure 1. (a) the entire temperature range above –100˚C. the lower curves are data on pure, single crystals for two crystal orientations (Reference KawadaKawada, 1978). the sample from 659.48 m was measured first at –20˚C, as shown by the filled circle, then the temperature was cycled to –110˚C, back to –20˚C, and then to –110˚C again before starting the new measurements shown by the thick, solid line. (b) the region near –81˚C. An example of the conductivity from a non-peak portion of the ice core at 2001.05 m is also shown.
The relaxation time at the peak signals
The data of the complex permittivity had typical features of a Debye-type dispersion. the relaxation time τ of the major dispersion was derived in the same way as that in Reference Camplin, Glen and ParenCamplin and others (1978) and Reference KawadaKawada (1978). the relaxation times over the measured temperature range for the three peak samples are plotted in Figure 5 as an Arrhenius plot. In agreement with the HF conductivity data in Figure 4, a change of slope occurs at Tc. Indeed, at Tc both the real and imaginary part of the complex permittivity showed discontinuous steps for frequencies from 20 Hz to 1MHz. the magnitude of τ for these peak samples is smaller than that of pure ice by an order of magnitude at all temperatures. the inferred activation energy is also less than that of pure ice, particularly above –50˚C, where the HF conductivity of pure ice is due to Bjerrum defects (Reference Ruepp, Käss, Riehl, Bullemer and EngelhardtRuepp and Käss, 1969), but is nearly the same as the activation energy of pure ice below –81˚C. Table 1 shows that the activation energies calculated from the relaxation times decreased by 6.3–8.4 kJ mol–1 for the three peaks as the temperature decreased below Tc .
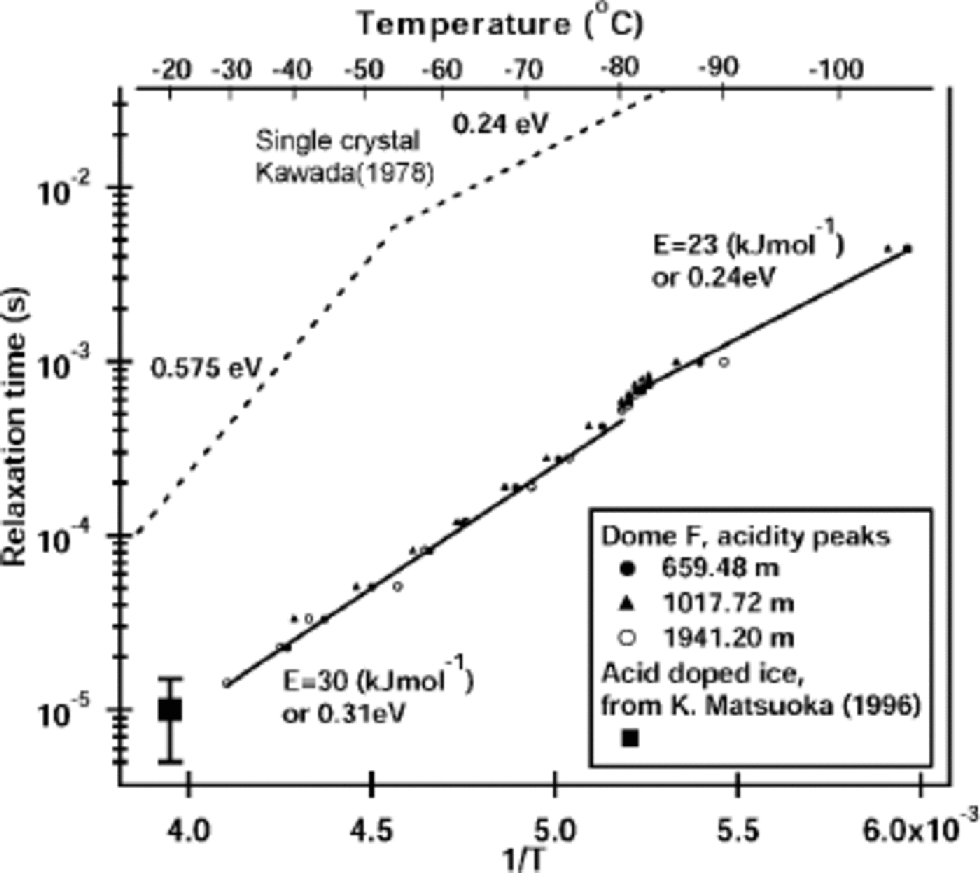
Fig. 5 Relaxation time of the Debye dispersion for the three peak samples. Relaxation times for the pure, single-crystalline ice measured by Reference KawadaKawada (1978) and the acid-doped ice from Reference Matsuoka, Fujita, Matsuoka, Ishida, Hondoh and MaeMatsuoka and others (1996) are shown for comparison. Refer to Table 1 for the activation energies inferred from these data.
Table 1. Activation energies for the relaxation times

The HF conductivity of the 659.48 m, peak sample decreased by about 30% at –20˚C after the sample was first cooled to –110˚C (Fig. 4a).The bold solid line in Figure 4a is from this second set of measurements, whereas the data for the 659.48 m peak in Figure 3b are from the first measurement. Further experiments on this phenomenon were not done because the samples were also used for several other physical-chemical analyses.
Discussion
In this section, we refer to the experimental results to discuss a possible cause of Tc, the observed decrease of the conductivity in the 659.48m sample, and the implications of our results for electrical conduction processes in polar ice sheets and ice cores. We then suggest an interpretation for the AC loss factor that is consistent with our results.
Acidity calibration for AC-ECM signals
Based on the linear relations among the AC loss, the HF conductivity and the chemical content, we estimate the relation between acidity and AC loss. from several independent studies at –21˚C (Reference Fujita, Matsuoka, Ishida, Matsuoka, Mae and HondohFujita and others, 2000) and when strong acids are the major impurity, the relation between the HF conductivity and acidity is
where the acidity is measured in μM. the coefficient of the first term thus has an uncertainty of about 25%, which is due to error limits in the molar conductivity from several studies (see, e.g., Reference Fujita, Matsuoka, Ishida, Matsuoka, Mae and HondohFujita and others, 2000; Reference Sugiyama and HondohSugiyama and others, 2000). This coefficient is from Reference Fujita, Matsuoka, Ishida, Matsuoka, Mae and HondohFujita and others (2000). the second term is the conductivity of pure, single-crystal ice at –21˚C in Figure 4a. By equating σ from Equation (5) with σ from Equation (6), the acidity is expressed as a function of the AC loss factor:
This is our first calibration line for AC-ECM signals to deduce acidities in the Dome F core. the uncertainty of the molar conductivity is the primary cause of the uncertainty in Equation (7). Thus, the accuracy of this equation can be assessed by comparing it to data from chemical analyses. from Equation (4), the molarity of the SO4 2– is expressed by the AC loss factor as
Moreover, Reference FujitaFujita and others (2002) carried out multiple regression analysis between the AC loss factor and major chemical components for 1257 portions in the depth range 850–2250m. They found that the AC loss factor is dominated by the SO4 2– concentration with a coefficient of 40±2. They also found that the Cl– and NH4 + ions statistically showed no significant influence on the AC conductance. Therefore, we take Equation (7) as a valid calibration line for the AC-ECM within the error limit. Equation (7) was applied to the AC loss factor of the 2503 m Dome F ice core (Reference FujitaFujita and others, 2002). Equations (5), (7) and (8) are mainly from the three peak signals that we demonstrated. Possibly, different volcanic spikes are dominated by a different acid such as HCl or HF and hence show a different tendency. We plan to test this possibility for further analyses of the ice core.
Activation energy of the relaxation time
According to Equation (3), there can be several contributions to the HF conductivity, each due to a different relaxation process, but a measurement will usually only detect the largest contribution. the data in Figure 4 show that there are two distinct lines both to the HF conductivity for pure single-crystalline ice and to the HF conductivity for the three ice-core peak samples. Thus, for the three peak samples, there are two major relaxation processes. the break in the conductivity curves at Tc suggests that two relaxation processes operate above Tc, but one relaxation process effectively becomes frozen out at lower temperatures. That the non-peak samples did not show a transition temperature and instead had a much lower HF conductivity at high temperature (Fig. 4b) suggests that the high-temperature conduction mechanism in the peak samples is due to the relatively high acidities.
The relaxation process of the ordinary Dome Fcore ice is complex because there are a few relaxation processes that have different relaxation times. At the same temperature, the slower limit of the relaxation time is the same as Kawada’s values in Figure 5. Some values were faster by two orders of magnitude. We plan to investigate this variation. Also, the ordinary background samples suggest from their complex behavior that there are other chemical or other factors that are affecting the electrical properties, particularly the AC measurements. We limit the discussion to the direct interpretation of HF conductivity, AC loss and ECM currents. Nevertheless, the variability of the conductivity is still within the range indicated in Figure 4. the activation energies calculated from the relaxation times (Table1) strengthen the argument that a new component of the electrical conduction mechanism appeared at temperatures above Tc .
Sulfate in liquid veins and the eutectic point
Our motivation for the temperature-change experiment was to determine if the eutectic point of sulfate/water/ice affected the measurements. Artificially grown sulfate-doped polycrystalline ice has a discontinuity at –73˚C in the dielectric loss at microwave frequencies (Reference Matsuoka, Fujita and MaeMatsuoka and others, 1997). Those authors argued that the liquid phase was responsible for a significant portion of the electrical conduction. Because the ice in our core samples has several μM of non-sulfate impurity (Na+ and Cl–), which could lower the eutectic temperature from that of ice with only sulfate (–73˚C), we argue that the transition at Tc = –81±1˚C is the eutectic temperature of the ice core. to verify this, however, we need to create the phase diagram for the mixture of these ions. Another possible interpretation is an increase of the internal energy due to the geometry of the vein network in polar ice. However, this explanation does not address why a similar shift does not occur in the doped ice. the change in activation energy of pure, single-crystalline ice is thought to be due to a change from conduction via Bjerrum defects at high temperature to conduction by ionic defects at low temperature. At the high temperatures, however, the conductivity of the peak samples, which are known to have peak acidity levels, is 10 times higher than that attributed to Bjerrum defects. This and other evidence strongly indicates that the conduction is linked to the acidic solutions in the ice veins. At the low temperatures, however, the activation energy is nearly that found for pure ice, and the HF conductivity is not very sensitive to acidity (Fig. 4); that is, peak and non-peak signals are similar. This would also explain why no change in activation energy was found at –81˚C for the 17 other samples with lower sulfate concentrations. Indeed, chemical analysis showed that the molarity of the SO4 2– was in the range 1– 2 μM. Regardless of acidity, the entire conduction component likely occurs within the solid at temperatures below Tc. At temperatures above Tc, electrical conduction seems to have two superimposed conduction components: one component arising from the liquid phase in the ice veins, and another component in solid ice.
The spread of HF conductivity values at high temperatures has implications for ice-core studies. Acidity measurements show that the HF conductivity increases nearly linearly with acidity at –20˚C, a typical temperature for ice-core analyses (e.g. Reference HammerHammer, 1980; Reference Moore and ParenMoore and Paren 1987; Reference FujitaFujita and others, 2002). the zero acidity value of the linear calibration line is the conductivity of pure ice, which is about 8 μS m–1 at –20˚C in Figure 4 (Reference KawadaKawada,1978). Figure 4 suggests that acidity measurement using the HF conductivity measurement achieves greater sensitivity at warmer temperatures.
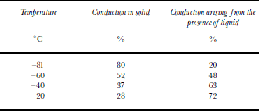
Table 2 shows the estimated percentage contribution of the solid-phase conduction and liquid-phase conduction to the total conductivity at four temperatures. We assume that just above Tc, 20% of the conductivity was from the liquid component and 80% was from the solid component. This is the magnitude of the discontinuous steps we found at Tc in Figure 4. We further assume that each component increases with temperature at the rate given by the weighted-average activation energy for each component in Table 1. This simple calculation shows that 72% of the conductivity component could arise from the liquid phase for the three samples at –20˚C.
Table 2. Percentage of the total conductivity arising from conduction in the solid and conduction arising from the presence of liquid
Implications for the high-frequency electrical conduction mechanisms
A full interpretation of the electrical signals from ice cores requires knowing the microscopic mechanism of electrical conduction. A useful finding is that the relaxation times above Tc are shorter than the relaxation times of pure single crystals by only an order of magnitude. This suggests that reorientation of water molecules at or near the solid/ solution interface at ice veins is responsible for the high-frequency-limit conduction. Water molecules within the liquid cannot be responsible since liquid water has a relaxation time of about 10–11 s near 0˚C (see, e.g., Reference RayRay, 1972), which is about five orders of magnitude less than our results extrapolated to 0˚C (Fig. 5). Furthermore, experiments using artificial ice containing strong acids showed that the relaxation time of the complex permittivity arising from the acidity is about 1610–5 s at –20˚C (see Reference Matsuoka, Fujita, Matsuoka, Ishida, Hondoh and MaeMatsuoka and others, 1996; Reference Fujita, Matsuoka, Ishida, Matsuoka, Mae and HondohFujita and others, 2000, fig. 8). This value agrees well with our extrapolated data in Figure 5.
Because the relaxation time was shorter than that of pure ice by an order of magnitude but far longer than that of water, we suggest that the HF conductivity of core samples is due to reorientation of water molecules at some type of lattice defects in polycrystalline ice. Here, defects include Bjerrum defects, ionic defects, grain boundaries, and liquid-like structures at grain boundaries or at ice/air or ice/liquid interfaces. the defects are related to the liquid phase, and not ionic defects in the ice lattice. This is because ionic defects in the ice lattice cannot explain the Tc step and the changes in activation energy. In addition, the activation energy of the core samples (Fig. 5; Table 1), cannot be explained by ionic defects or Bjerrum defects. Possible Bjerrum defects due to Cl– ions, which we measured to have concentrations of 1–5 μM in the ice, can still have activation energies close to the observed value. But such defects cannot explain the Tc step. As defects in solid ice and liquid water cannot explain the high temperature conductivity, we speculate that the conductivity might be due to water molecules or ions in an ordered region near the ice/solution interface in the vein network of the core samples. Reference Mizuno and HanafusaMizuno andHanafusa (1987) reported that a quasiliquid layer (QLL) at ice/air interfaces has a relaxation time of the order of 10–10 s. If a similar QLL that causes molecular reorientations exists at ice/liquid interfaces, which have a more confined geometry than ice/air interfaces, then the HF conductivity at a fixed temperature might be a measure of the total area of the ice/liquid interfaces.
The observed decrease in the conductivity of the 659.48 m peak sample after two temperature cycles might have been caused by a decrease of total area of the ice/liquid interfaces in the veins. This repeated cooling and warming from –20˚ to –110˚C should have caused changes in internal pressure due to thermal expansion and contraction. the changes in these physical conditions could have caused the grain boundaries to migrate and move and thus allow some veins to merge. If veinsmerged, then the liquid–ice surface area in the veins would probably decrease. the observed decrease might also be indicative of non-equilibrium conditions; that is, perhaps insufficient time has been allowed for the acid to attain compositional equilibrium with the surrounding ice. Further experiments with repeated cooling and warming cycles together with estimates of the internal pressures would help to clarify the nature of this phenomenon.
Concluding Remarks
The present study demonstrated linear correlations in the Dome F ice core between the AC loss factor and the molarity of sulfuric acid, and between the AC loss factor and the HF conductivity. Despite the large differences in sampling volumes among the parallel-plate capacitor method, the AC-ECM method and the chemical-content measurements, these three measurements were strongly correlated. In contrast, the ECM current correlated weakly to the other parameters; in particular, when the sulfate concentration was high, the error exceeded 50%.
We clarified that the liquid phase plays important roles for the high-frequency electrical conduction in Dome F ice over the entire temperature range of polar ice sheets. the inferred change of activation energy for the relaxation time at Tc = –81±1˚C suggests that the eutectic point of the solute/water/ice system, where the solute is mostly sulfate, is at Tc. This temperature is 8˚C lower than the eutectic temperature for the sulfate/water/ice system. the shift likely occurred due to effects from the other impurity ions. Above this eutectic point, two relaxation processes of similar magnitude determined the conductivity, although the larger component is probably due to the reorientation of water molecules at liquid/solid interfaces located at triple junctions (veins). This liquid phase is important in various physical processes related to ice-core records. for instance, the liquid phase is probably the dominant d.c. conduction channel as inferred earlier by Reference Wolff and ParenWolff and Paren (1984) and Reference Wolff, Mulvaney and OatesWolff and others (1988). Also, chemical components in the liquid vein network should have different diffusion rates than molecules in the lattice. These are discussed in Reference FujitaFujita and others (2002). Also, this liquid, which has high concentrations of sulfate, could flow or migrate at relatively high temperatures or when stress gradients occur in the ice sheet, as has been often discussed in connection with the hydrology of temperate glaciers. the nature of liquid veins in the ice sheet needs further investigation to better understand various physical processes which seem to be highly interdependent.
Acknowledgements
This paper is a contribution to the Dome F project conducted by the Japanese Antarctic Research Expedition. the authors thank two anonymous reviewers for their valuable comments and suggestions.


