


During the last decades, socio-economic changes contributed to modifications in dietary habits worldwide, particularly marked by increase in processed food intake and replacement of traditional meals with high-energy foods, rich in fat and added sugars(Reference Monteiro, Rodrigues and Sichieri1). In Brazil, data from the Brazilian National Dietary Survey revealed an elevated prevalence of saturated fat and sugar intake higher than the recommended limit (82 and 61 %, respectively)(2). Foods rich in solid fat and added sugar contributed with more than half of daily energy intake in the population(2), in addition to physical inactivity, contributing to increased risk of chronic non-communicable diseases, e.g. diabetes, cancer and CVD(3).
Public policies designed to promote healthy lifestyles through adequate eating habits are crucial in the context of increasing global burden of non-communicable diseases. There is significant evidence on the role of regular consumption of plant-based foods and beverages (e.g. fruits, vegetables, nuts, coffee and tea) to reduce risk of non-communicable diseases(Reference Miller, Mente and Dehghan4–Reference Aune, Giovannucci and Boffetta7), potentially due to the presence of bioactive compounds. Bioactive compounds comprise a heterogeneous and widespread group of metabolites present in small amounts in diverse foods, including carotenoids and polyphenols which exhibit anti-inflammatory and antioxidative properties that modulate gene expression and several metabolic pathways associated with risk and progression of diseases(Reference Silva, Pinheiro-Castro and Novaes8–Reference Liu10).
Considering the importance of bioactive compounds intake for health maintenance, understanding its consumption in the population is important, especially according to socio-economic strata, which allows identification of potential intervention targets. There is lack of evidence regarding the bioactive compounds intake according to income level; most studies focus on general features of unhealthy dietary patterns among subjects in low-income strata(Reference French, Tangney and Crane11). Thus, the objective of the study was to assess bioactive compounds intake and its main food contributors across income ranges in the Brazilian population.
Methods
Study population
The data of the present study were retrieved from the Brazilian National Dietary Survey, conducted along with the 2008–2009 Household Budget Survey (HBS). HBS is a nationwide representative cross-sectional study carried out by the Brazilian Institute of Geography and Statistics and designed to assess Brazilian family’s consumption structures. Briefly, the 2008–2009 HBS used two-stage cluster sampling involving census sectors stratified according to different geographical areas and socio-economic classes. In the first stage, the sectors were randomly selected from each stratum with probability proportional to the number of households present, and in the second stage, the households were selected by simple random sampling, resulting in 55 970 households for HBS. A subsample of approximately 25 % households was randomly selected for data collection on individual food intake. Thus, NDS sample included 13 596 households, corresponding to 34 003 individuals aged ≥ 10 years old(2). Information was collected through the 12-month research period, including all socio-economic/geographic strata to ensure representativeness in the four quarters of the year. The research protocol was approved by the Ethics Committee of the Institute of Social Medicine of the State University of Rio de Janeiro (CAAE 0011.0.259.000-11).
Variables
Dietary intake assessment
Dietary intake was evaluated during the 12 months of research to encompass seasonal variations in food intakes. Individual food intake data were obtained using two 24-h dietary records applied in non-consecutive days. Participants were instructed to record foods and beverages consumed within 24-h period, including amount (houseware standards or weight/volume measurements), food preparation technique (e.g. baking, broiling, frying and roasting), period of the day and place of consumption (at home or out). When the participant was unable to record food intake, it was done by another household resident. An instruction manual including photographs of foods and beverages was used to facilitate estimation of portion sizes. Trained professionals reviewed dietary records with the participant to prevent potential absence of items consumed.
Recipes were converted into ingredients to estimate nutritional value and composition of food intake, using the software ‘ILSI: Analysis of the average food consumption per capita of the Brazilian population’(Reference Pais and Valerio12), which contains information regarding amounts of foods included in 100 g of recipes mentioned in 2008–2009 HBS dietary records.
Estimation of bioactive compounds intake
Data on polyphenol content in foods were obtained from Phenol-Explorer (www.phenol-explorer.eu/), comprehensive database which contain food composition data for known polyphenols in foods, e.g. phenolic acids, flavonoids, stilbenes and lignans. Individual polyphenols were determined by reverse-phase HPLC, except for proanthocyanidins, which correspond to normal-phase HPLC(Reference Neveu, Perez-Jimenez and Vos13).
Data from Brazilian Food Composition Database (TBCA, available in www.tbca.net.br/) were used to complement Phenol-Explorer database in the case of few regional foods. TBCA was developed by the University of Sao Paulo, containing data on flavonoid content in regional and other foods commonly consumed in Brazil, analysed by HPLC(Reference Coelho, Bistriche and Grande14). Additionally, effects of food processing on polyphenol content were estimated using retention factors included in Phenol-Explorer database(Reference Rothwell, Perez-Jimenez and Neveu15).
Carotenoid concentrations in foods (α-carotene, β-carotene, β-cryptoxanthin, lycopene, lutein, neoxanthin, violaxanthin and zeaxanthin) were obtained from published databases containing data on carotenoid contents in foods harvested in Brazil, analysed by HPLC, including TBCA(Reference Coelho, Bistriche and Grande14) and Ibero-American Food Carotenoids Database(Reference Dias, Olmedilla-Alonso and Hornero-Méndez16). Data on carotenoid contents in foods harvested in other countries were used in the case of few food items without carotenoid food composition available for food collected and analysed in Brazil(Reference Granado, Olmedilla and Blanco17–Reference O’Neill, Carroll and Corridan19). Data on carotenoid concentrations corresponded to raw or cooked foods, depending on how it was consumed.
Dietary bioactive compounds intake was estimated using two dietary records. Polyphenol and carotenoid intake from each food was calculated by multiplying contents of each bioactive compound by daily amount of each food consumed and dividing by 100. Total polyphenol and carotenoid intake was calculated by summing up compound intakes from all food sources reported in dietary records. Particularly in relation to polyphenols present in foods as glycosides and esters forms, the polyphenol intake was calculated as aglycone equivalents by removing the contribution to molecular weight of the non-phenolic part of the molecule for each individual polyphenol.
The main food contributors to the intake of polyphenols were determined by percentage of contribution. In this analysis, we aggrouped prepared foods that had the same main food (‘rice with egg’ and ‘carretero’s rice’ were considered as rice; instant coffee and powder coffee were considered as coffee). In respect to ‘others polyphenols’, since the intake was very low and wheat flour was the main source, we aggrouped ‘cracker’ and ‘bread’ as ‘wheat flour products’.
Socio-economic and demographic characteristics
Interviews were conducted by trained professionals from Brazilian Institute of Geography and Statistics, using a structured questionnaire on socio-economic and demographic characteristics, including age, race/ethnicity, educational attainment and income. Additional household characteristics included geographic region and area (urban or rural).
Information on income included monetary and non-monetary sources of household revenues (including donations and participation in income transfer programmes), converted into monthly household income per capita dividing by household residents.
Statistical analysis
Analysis focused on the 33·861 participants who were aged ≥ 10 years. We chose to exclude data on individuals whose energy intake was implausible (lower than 500 energy content or higher than 4000 energy content), in order to focus on realistic data on intake of bioactive compounds in Brazil. However, the exclusion of these participants did not change the estimates of bioactive compounds intake. Data were presented in median for continuous variables, and frequencies or percentages for categorical variables. Bioactive compounds intake data obtained from the two 24-h dietary records were statistically adjusted for the usual intake distribution and removal of intrapersonal variation using the statistical technique Multiple Source Method. The monthly per capita income was divided in quartiles, as follows: quartile 1 ≤ US$92.68; US$92.69 ≤ quartile 2 ≤ US$174.61; US$174.62 ≤ quartile 3 ≤ US$328.13; quartile 4≥US$328.14. Bioactive compounds intake distribution was analysed using Kolmogorov–Smirnov test and did not present normal distribution. Thus, Kruskal–Wallis test with Dunn post hoc (significance values adjusted by Bonferroni correction) was used to test differences according to income quartiles. Main food contributors to polyphenol and carotenoid intake were determined according to percentage of contribution. Estimates were performed using sample weights to allow population representativeness, with significance level of 5 % (P ≤ 0·05), using Stata software version 14.
Results
Information on 34 003 participants was available for analysis, comprising 15 700 men and 18 303 women (46·2 and 53·8 %, respectively). Socio-economic and demographic characteristics according to sex are presented in Table 1. We also presented sociodemographic characteristics of studied population stratified by monthly per capita income in online Supplementary Table S1.
Table 1. Socio-economic and demographic characteristics of the population. Brazil, 2008–2009
(Numbers and percentages)
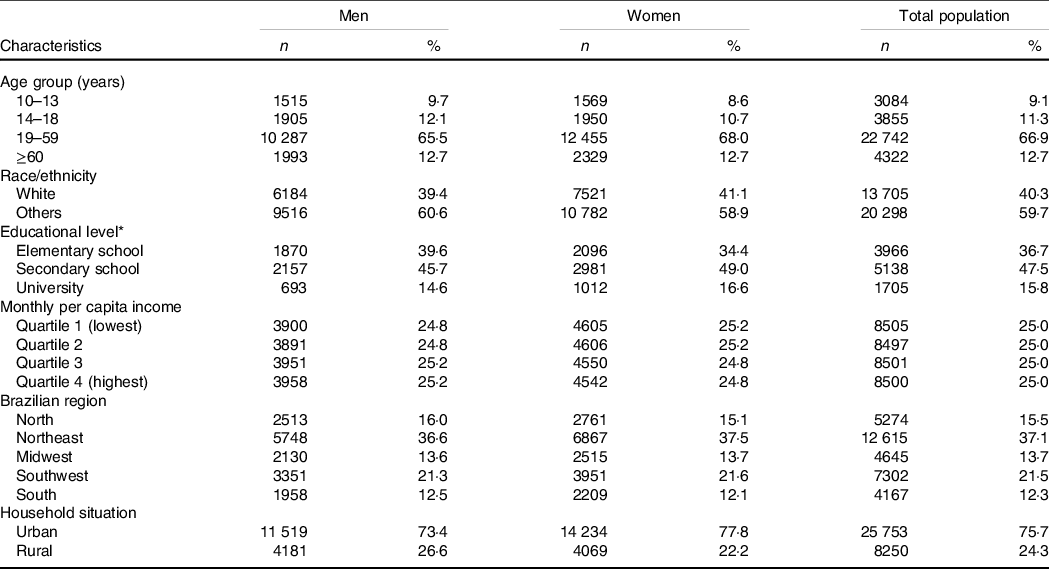
* Only adults and elderly.
Total, classes and subclasses of polyphenol intake across monthly per capita income quartiles are presented in Table 2. Total polyphenols and flavonoids intake increased with income level, with flavonoids intake three-fold higher in the highest quartile compared with the lowest quartile (P = 0·0001). The highest income group consumed higher amounts of all flavonoid classes than the lowest income group (P = 0·0001), especially flavanones (98·3 v. 22·6 mg/d, highest v. lowest quartile of income, P = 0·0001).
Table 2. Polyphenols intake (mg/d) according to monthly per capita income, Brazil, 2008–2009
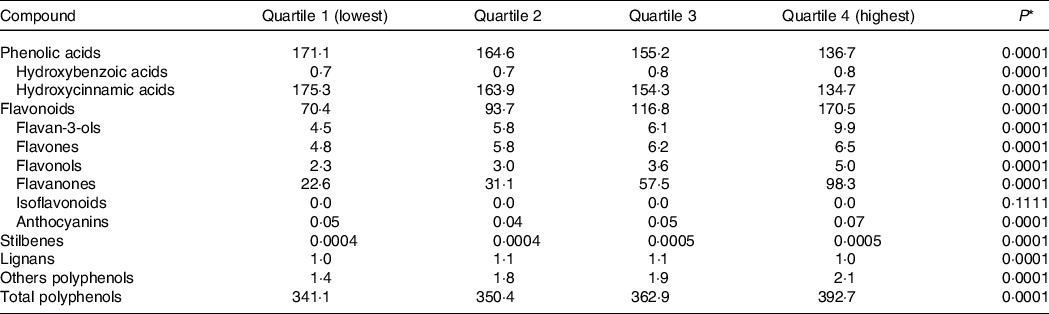
* Comparisons across quartiles were performed by using Kruskal–Wallis test.
Income levels: Quartile 1 ≤ US$92·68; US$92·69 ≤ Quartile 2 ≤ US$174·61; US$174·62 ≤ Quartile 3 ≤ US$328·13; Quartile 4 ≥ US$328·14. Values in US dollar were obtained using conversion from Brazilian reais using exchange rate from the Brazilian Central Bank in 15 January 2009 (HBS 2008–2009 reference date, R$2·3803 per US$1).
Conversely, subjects with lower income showed a higher phenolic acids intake, as well as hydroxycinnamic acids, than did those in the highest quartile of income (P = 0·0001). The intake of other classes was very low, but stilbenes and others polyphenols consumption were higher in the upper quartile of income, compared with the lowest quartile (P = 0·0001). These results were similar after adjustment for energy intake (online Supplementary Table S2).
The total and classes of carotenoids intake are presented in Table 3. The intake of total carotenoids, α-carotene, β-carotene, lycopene, lutein, neoxanthin and violaxanthin was higher among subjects in the highest income quartile, compared with the lowest quartile (P = 0·0001). The opposite was found for β-cryptoxanthin and zeaxanthin intake, whose median consumption was higher in the lowest income group than the highest income group (P = 0·0001). These results were also similar after adjustment for energy intake (online Supplementary Table S3).
Table 3. Carotenoids intake (mcg/d) according to monthly per capita income, Brazil, 2008–2009
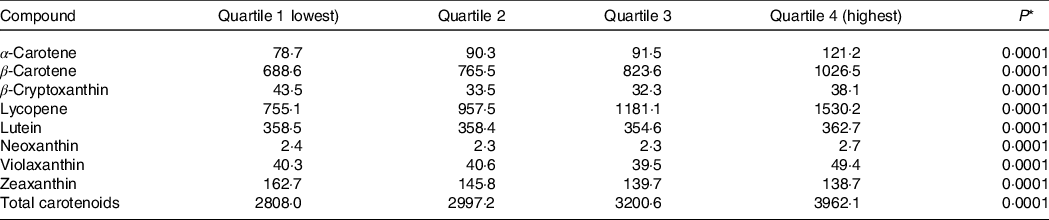
* Comparisons across quartiles were performed by using Kruskal–Wallis test.
Income levels: Quartile 1 ≤ US$92·68; US$92·69 ≤ Quartile 2 ≤ US$174·61; US$174·62 ≤ Quartile 3 ≤ US$328·13; Quartile 4 ≥ US$328·14. Values in US dollar were obtained using conversion from Brazilian reais using exchange rate from the Brazilian Central Bank in January 15, 2009 (HBS 2008–2009 reference date, R$2·3803 per USA$1).
Three food items with higher contribution to total, classes and subclasses of polyphenol intake are shown in Table 4. Coffee was the food item that most contributed to total polyphenols, phenolic acids and hydroxycinnamic acids intake in all income levels, with higher intakes in the lowest income group compared with the highest income group.
Table 4. Main food contributors to total, classes and subclasses of polyphenol intake according to quartiles of monthly per capita income, Brazil, 2008–2009
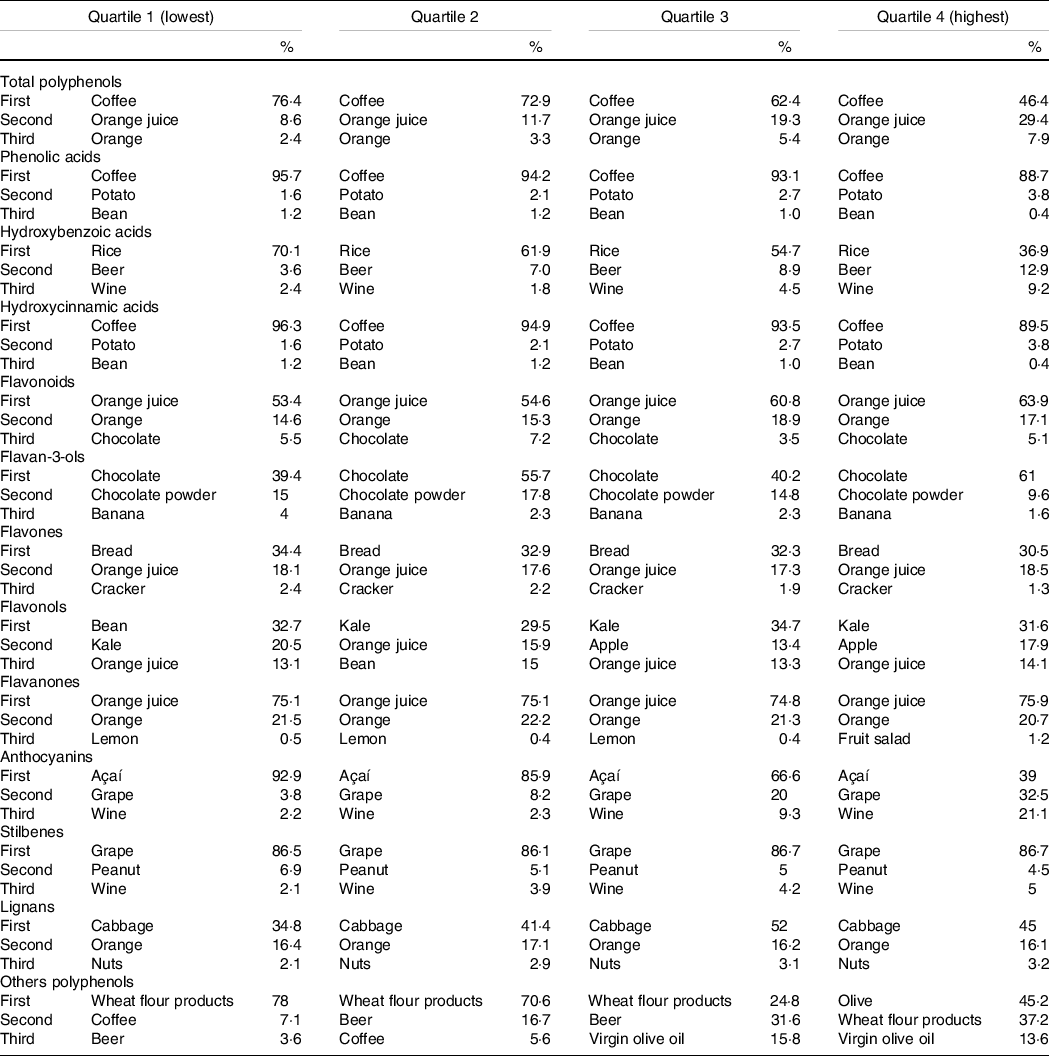
Coffee had also contributed to other polyphenols intake in two lowest quartiles of income. Orange juice and orange were second and third dietary sources for polyphenol intake, and first and second contributors to flavonoid intake, respectively, with higher intakes in the upper quartile of income, compared with the lowest quartile.
Main sources of flavan-3-ols in the population were chocolate, chocolate powder and banana. Bean was the main source of flavonols intake in the lowest quartile of income, while kale was primary food item contributing to subclass intake in other income quartiles.
Alcoholic beverages like beer and wine contributed to hydroxybenzoic acids, anthocyanins, stilbenes and others polyphenols intake but were consumed in higher amounts by subjects with higher income than in lowest quartile of income. Cabbage, orange and nuts were major food suppliers to lignans intake in all income groups.
Main food contributors to carotenoid intake within each income group are shown in Table 5. Pumpkin was the food source with higher contribution to total carotenoid intake in lowest and medium-income quartiles. In upper quartile, total carotenoid was supplied mainly by tomato and kale. Fruits like mango and red guava had important contribution to total carotenoid intake in lowest income quartile. Pumpkin was the primary food item contributing to α-carotene and β-carotene intake in all income groups. Carrot had an important contribution to α-carotene intake, especially in highest quartile of income.
Table 5. Main food contributors to total and classes of carotenoid intake according to quartiles of monthly per capita income. Brazil, 2008–2009
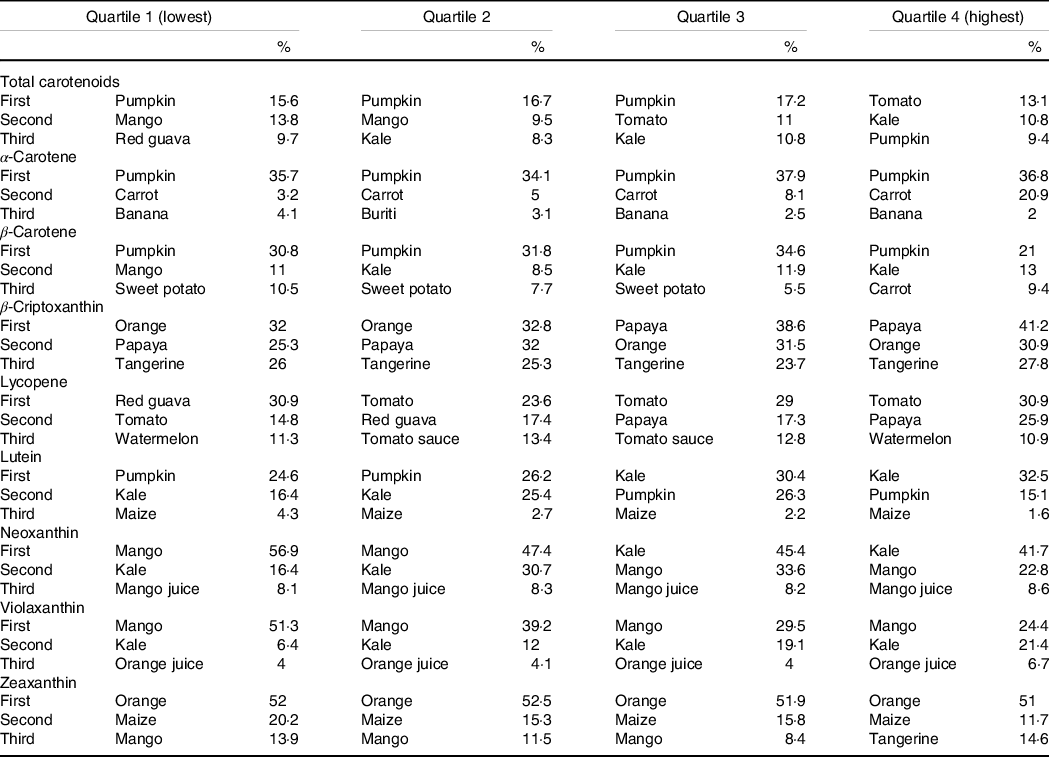
Tropical fruits were main food sources to β-cryptoxanthin intake in all income levels. Papaya consumption presented increasing contribution from income quartiles 1 to 4. Tangerine was third food source to β-cryptoxanthin consumption in all income groups. Lycopene, most consumed carotenoid source, was supplied mainly from red guava in the first income quartile. In medium- and upper-income quartiles, tomato was primary food contributing to class intake. As well as tomato, papaya contribution to lycopene intake increased according to income.
Major dietary sources to lutein intake were pumpkin and kale in lowest income quartiles. Kale contribution to lutein intake increased according to income, being primary food source to class intake in upper-income quartile. Sources of violaxanthin were mango, kale and orange juice. Orange, maize and mango were main suppliers to zeaxanthin intake.
Discussion
The study explored polyphenol and carotenoid intake according to income groups in a nationally representative sample of the Brazilian population. Results showed higher intake of total polyphenols, flavonoids and others polyphenols by individuals with higher income in comparison with lowest income. The findings are similar to evidence previously reported in Mexico(Reference Zamora-Ros, Biessy and Rothwell20), Korea(Reference Jun, Shin and Joung21), USA(Reference Vieux, Maillot and Rehm22) and Mallorca Island(Reference Karam, Bibiloni and Tur23). Carotenoid intake distribution across income quartiles showed higher total carotenoids and classes consumption (with exception to β-cryptoxanthin and zeaxanthin) in highest quartile, corroborating evidence previously reported in Vietnam(Reference Khan, Mai and Minh24).
It is well known that socio-economic status is an important determinant of diet quality. Whilst high-income groups usually consume higher-quality diets, low-income individuals tend to consume energy-dense diets and low fruits and vegetables consumption(Reference French, Tangney and Crane11,Reference Darmon and Drewnowski25) . A potential explanation relies on lower price per energy of foods with high energy content in comparison with foods with high micronutrient density, e.g. fruits and vegetables(Reference Darmon and Drewnowski26), which may indicate lower consumption of bioactive compounds in low-income groups, since fruits and vegetables are main source of polyphenols and carotenoids in diet.
The disparities in bioactive compounds intake across income groups in Brazil were further illustrated by analysing food sources with higher contribution to polyphenol and carotenoid intake. The contribution of some fruits and fruit juices (e.g., orange juice and orange) on polyphenol intake increases with higher income, similarly to apple, grape and kale contributions to flavonoid intake. Other foods with high bioactive compounds density (e.g., chocolate and wine) also presented increasing contribution in diet according to income level, supporting evidence from previous studies in USA(Reference Drewnowski and Rehm27), Mexico(Reference Colchero, Guerrero-López and Molina28) and Netherlands(Reference Dijkstra, Neter and Brouwer29).
On the other hand, regional and traditional foods like açai, rice and bean showed higher contribution to anthocyanin, hydroxybenzoic acids and flavonol intakes, respectively, among lower-income individuals. A previous study analysing the prices of food groups consumed in Brazil showed that, despite fresh foods (such as fruit and vegetables, sources of bioactive food compounds) tend to cost more than ultraprocessed foods, dry grains (such as rice and beans, sources of phenolic acids and flavonoids) are a more economical alternative related to healthy eating practices(Reference Claro, Maia and Costa30). Thus, the higher intake of rice and beans among lower-income participants is a positive finding and should be stimulated.
Wheat-flour products (e.g., bread and cracker) were relevant to flavone intake in all income ranges, but contribution decreased on higher-income levels. The lower prices of refined-grain foods (such as refined-grain cracker and refined-wheat bread) in comparison with in natura and whole-grain foods are an important facilitator to their intake in low-income groups(Reference Chea and Mobley31–Reference Nicklas, Jahns and Bogle33).
Regarding carotenoid food sources, although contributors to total carotenoids and classes intake varied across income ranges, the same pattern previously mentioned was observed. The contribution of fruits, fruit juices and vegetables (e.g., papaya, tangerine, orange juice, tomato, carrot and kale) to carotenoid intake also increases in higher-income groups. The only exceptions were certain tropical and regional fruits (red guava, mango, buriti and caja). The contribution of sweet potato and maize, foods that are traditionally consumed in some Brazilian regions, to carotenoid intake decreased with increases in income. This can be elucidated by the nutritional transition process that Brazil is facing in the last 30 years, characterised by a decrease in natura and minimally processed foods intake and an increase in ultraprocessed food consumption. Previous studies have reported that the income is an important determinant of these differences in food intake. Low-income groups still preserve some traditional and healthy eating habits, such beans, cereals, roots and tubers intake, which can be illustrated by the greater contribution of sweet potato and maize to carotenoid intake(Reference Levy, Claro and Mondini34).
A previous analysis showed that the contribution of solid fat and added sugars to daily energy intake increases with income in Brazilian population. This is the opposite to our findings, which illustrates a higher intake of some polyphenols and carotenoids classes in high-income groups(Reference Monteiro, Rodrigues and Sichieri1). However, it is important to mention that, despite the per capita fruit and vegetable intake by Brazilian population is very low (69·1 g/d for men and 92·6 g/d for women), the consumption increases with increasing income(2), which justifies the higher intake of bioactive food compounds in high-income groups.
In summary, results obtained in the study reinforce the need to in-depth analysis of inequalities in food consumption, showing that lower-income individuals may experience diets with low bioactive compounds density. However, it is important to highlight the possibility of achieving healthier diets without additional costs in low-income Brazilian households through incremental changes in dietary patterns encompassing increase of fruits, beans, whole cereals and vegetables intake, considering evidence from previous study(Reference Verly, Sichieri and Darmon35). These changes would contribute to increase in consumption of diverse nutrients and would also possibly contribute to the rise of bioactive compounds intake in low-income strata, which potentially would reduce the risk of negative health outcomes.
The results of the study have some limitations, especially concerning data sets employed for analysis. First, information on food consumption used in the analysis were obtained in 2008–2009, approximately 10 years ago. However, at the time that this analysis was done, it was the only data set with dietary records available for assessment of food consumption at national level in Brazil. Second, there was lack of information on food composition data of certain local fruits and vegetables, which could underestimate polyphenol and carotenoid intake. Although they represented <5 % of total fruit and vegetable intake, the systematic publication of the polyphenol and carotenoid food composition data, as well as comprehensive compilation of these information, should be encouraged in order to facilitate researches on this topic. Nevertheless, considering the absence of studies evaluating bioactive compounds intake according to income level in Brazil, the investigation may contribute to the development of public policies towards promotion of healthier diets in the population.
In conclusion, the present study showed that level of income may be an important determinant to polyphenols and carotenoids intake in Brazil. The results may encourage the investigation of associations between bioactive compound intake and health outcomes in diverse income groups, particularly among low-income individuals, aiming to reduce the risk of chronic diseases.
Acknowledgements
The authors would like to thank International Life Sciences Institute Brasil (Task Force Agrochemicals) for technical support in the initial phase of study. The authors thank Food Research Center – CEPID-FAPESP (Research Innovation and Dissemination Centers, São Paulo Research Foundation) and the National Counsel of Technological and Scientific Development (CNPq).
This work was not supported by any funding agency.
F. M. S. and F. M. L. designed, planned and assisted the research and reviewed the manuscript; R. A. C. conducted research, performed data analysis and wrote the paper; N. M. A. H. provided critical review of the manuscript. All authors read and approved the final version of the manuscript.
There are no conflicts of interest.
Supplementary material
For supplementary material/s referred to in this article, please visit https://doi.org/10.1017/S0007114521001987


