

The common mental disorders, depression and anxiety, are major public health problems across the globe( Reference Jacka, Mykletun and Berk 1 ). Depression affects 350 million people worldwide and women are, on average, 1·7 times more likely to have depression than men( Reference Chocano-Bedoya, O’Reilly and Lucas 2 ). It is estimated that depression is responsible for 50–70 % of suicides. The WHO predicts that depression will become the second most prevalent disorder (after ischaemic heart disease) by the year 2020( Reference Prohan, Amani and Nematpour 3 ). Anxiety has received special attention during the last couple of decades, owing to its high prevalence and its association with chronic disorders, mainly CHD( Reference Yannakoulia, Panagiotakos and Pitsavos 4 ). These disorders are considered the main global causes of disability-adjusted life years and economic costs( Reference McMartin, Jacka and Colman 5 , Reference Bhattacharyya, Marston and Walters 6 ).
Recent data have highlighted the contribution of modifiable lifestyle behaviours, such as physical inactivity and smoking, to the development of common mental disorders( Reference Quirk, Williams and O’Neil 7 ). In addition, the relationship between nutrition and depressive disorders has become of increasing interest in recent years( Reference Quirk, Williams and O’Neil 7 ). Whereas the role of diet in the prevention of other non-communicable diseases, such as CVD, has been widely investigated in the past 50 years, the relationship between diet and mental disorders is so far a novel and interesting field( Reference Sanchez-Villegas and Martinez-Gonzalez 8 ). Most previous investigations have focused on the association of depression with specific nutrients, foods and dietary patterns( Reference Lai, Hiles and Bisquera 9 ). Several studies have suggested that diet quality, for which fruit and vegetable intake is a simple indicator( Reference McMartin, Jacka and Colman 5 ), was related to depression in both adults( Reference Akbaraly, Sabia and Shipley 10 , Reference Kuczmarski, Cremer Sees and Hotchkiss 11 ) and adolescents( Reference McMartin, Kuhle and Colman 12 , Reference Khalid, Williams and Reynolds 13 ).
Findings from earlier observational studies that investigated the association between fruit and vegetable consumption and risk of depression or anxiety were inconsistent. Some investigations have shown a significant association between fruit and vegetable intake and depression( Reference Akbaraly, Sabia and Shipley 10 , Reference Konttinen, Mannisto and Sarlio-Lahteenkorva 14 ), but other studies found no significant associations( Reference Kim, Choi and Lee 15 – Reference Chi, Wang and Tsai 17 ). Although some studies reached significant associations between consumption of fruit and depression, such associations were not significant for vegetable intake( Reference Sanchez-Villegas, Delgado-Rodriguez and Alonso 18 , Reference Mihrshahi, Dobson and Mishra 19 ). Some others have reported no significant association between fruit intake and depression( Reference McMartin, Jacka and Colman 5 , Reference Hintikka, Tolmunen and Honkalampi 16 , Reference Tsai, Chang and Chi 20 , Reference Woo, Lynn and Lau 21 ), but found significant relations with consumption of vegetables( Reference Tsai, Chang and Chi 20 , Reference Woo, Lynn and Lau 21 ). In addition, there has been a sex difference in the associations. Some investigations have reported a protective association in women( Reference Gangwisch, Hale and Garcia 22 ) or in both sexes( Reference Konttinen, Mannisto and Sarlio-Lahteenkorva 14 ), and others have reported no association between fruit intake and depression in men or womenReference Allgöwer, Wardle and Steptoe 23 ). In addition, most studies have reported associations between fruit and vegetable intake and depression, but the linkage with anxiety is less studied( Reference McMartin, Jacka and Colman 5 ). A most recent meta-analysis showed that fruit and vegetable intake might be inversely associated with the risk of depression( Reference Liu, Yan and Li 24 ); however, the findings might be misleading owing to the lack of inclusion of several published studies in the field( Reference Akbaraly, Sabia and Shipley 10 , Reference Konttinen, Mannisto and Sarlio-Lahteenkorva 14 , Reference Niu, Guo and Kakizaki 25 – Reference Woo, Ho and Yu 30 ); also, because of the use of non-appropriate statistical methods, such as combining adjusted and non-adjusted relative risks (RR), incomplete RR extracting and not performing the trim and fill method to identify the effect of unpublished results, their findings might be biased( Reference Verger, Lions and Ventelou 26 ). We aimed to conduct a comprehensive systematic review and meta-analysis to summarise available data on the association between fruit and vegetable intake, depression and/or anxiety.
Methods
Search strategy
A computerised search strategy was implemented until Oct 2017 using Pubmed, ISI (Web of Science), SCOPUS, Embase and Google Scholar. The following key words, including those from the medical subject headings (MeSH) database, were used in this search: (‘fruit’ OR ‘vegetable’ OR ‘diet’ OR ‘dietary’ OR ‘nutrition’) AND (‘mental disorder’ OR ‘depression’ OR ‘anxiety’ OR ‘depressive disorder’ OR ‘ mood disorder’). No time and language restrictions were applied. In addition, we reviewed the reference lists of the relevant publications and reviews to avoid missing any published study. Unpublished studies were not included in the search strategy.
Inclusion criteria
The studies included in our systematic review and meta-analysis were independently assessed by three investigators (F. S., P. S. and H. M.) separately, and publications that fulfilled the following criteria were eligible for inclusion in the present systematic review – population: adults; intervention/exposure: fruit or vegetable intakes; comparison: amount of consumption; outcome: depression or anxiety; study design: cross-sectional, case–control or cohort studies (case–control studies were not included in the meta-analysis).
Exclusion criteria
A total of 9557 articles were found in our initial search. We excluded letters, comments and animal studies from the analysis. Studies were excluded if they (1) had reported only the amount of fruit and/or vegetable intake across groups with and without mental disorders and did not provide any estimates for the association or did not provide any measures enabling us to calculate the effect size for the association( Reference Dressler and Smith 31 – Reference Poorrezaeian, Siassi and Qorbani 33 ); (2) had examined major dietary patterns (including patterns highly loaded with fruit and vegetables) rather than fruit and/or vegetable intake separately (n 40); and (3) had examined the relation between fruit and vegetable intake and depression and/or anxiety in pregnant women( Reference Chang, Brown and Nitzke 34 , Reference Chatzi, Melaki and Sarri 35 ) and children or adolescents( Reference McMartin, Kuhle and Colman 12 , Reference Kim, Choi and Lee 15 , Reference Robinson, Kendall and Jacoby 36 – Reference Renzaho, Kumanyika and Tucker 39 ). We also excluded duplicate studies. When we found more than one published report based on the same study population( Reference Tsai, Chang and Chi 20 ), only the most comprehensive publication( Reference Chi, Wang and Tsai 17 ) was included in this meta-analysis. In addition, for one study that reported the association in several waves of a survey in Canada, we used data from the first wave only because data from some states were repeatedly used in other waves of the survey( Reference McMartin, Jacka and Colman 5 ). For another study( Reference Michalak, Zhang and Jacobi 40 ) that reported the estimates for both predominant and completely vegetarians v. non-vegetarians, we used data from completely vegetarians (and not those from predominant vegetarians). After these exclusions, twenty-seven papers remained for systematic review in the present study (Fig. 1).
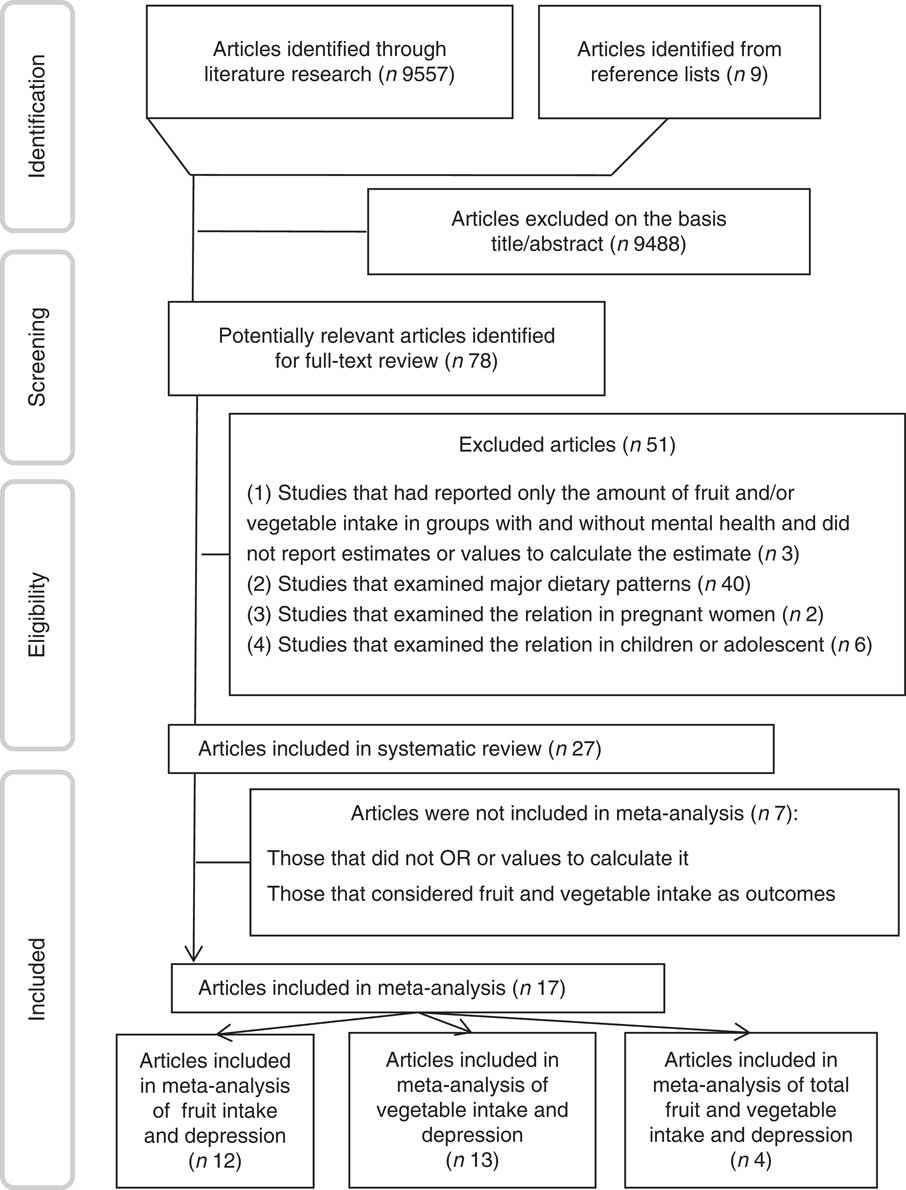
Fig. 1 The flow diagram of study selection.
Data extraction
From each eligible study, we extracted the following information: first author, year of publication, study design, name of study, country, age range or mean age, sex, sample size, number of cases, exposure, exposure assessment tool, outcome, outcome assessment tool, relevant effect sizes (OR, hazard ratios (HR), RR, regression coefficients or Pearson’s correlation coefficients) and 95 % CI and covariates that were adjusted for.
Quality assessment of studies
The quality of included studies was examined by using the Newcastle–Ottawa Scale (NOS)( Reference Wells, Peterson and Welch 41 ). For cohort and case–control studies that were included in the analysis, we used their own specific methods. For cross-sectional studies that were included in the analysis, we used the method for case–control studies, by considering subjects without depression or anxiety as the controls. The NOS assigns a maximum of nine points to each study: four for selection, two for comparability and three for assessment of outcomes (for cohort study) or exposures (for case–control study). The quality score ranged from 2 to 7 in this study, with the median of 5. In the present analysis, when a study got more than median stars (≥ 5), it was considered to be of relatively high quality; otherwise, it was deemed to have low quality. Any discrepancies were resolved by discussion.
Statistical analysis
Reported RR, HR or OR (and their 95 % CI) were used to calculate log RR and its standard errors. For five studies( Reference Allgöwer, Wardle and Steptoe 23 , Reference Verger, Lions and Ventelou 26 , Reference Bishwajit, O’Leary and Ghosh 28 , Reference Liu, Xie and Chou 42 , Reference Shahar, Hassan and Sundar 43 ) that reported RR for the lowest v. the highest intake of fruit or vegetables, we inverted RR and its lower and upper limits to compute the RR for the highest v. the lowest intakes. For two studies( Reference Hintikka, Tolmunen and Honkalampi 16 , Reference Niu, Guo and Kakizaki 25 ) that reported several RR for different kinds of fruit and vegetables, first we consolidated them in a preliminary meta-analysis using fixed-effects model and reached to a pooled RR for that study. Then, using a random-effects model that takes between-study variation into account, the overall effect size from all included studies was calculated. Heterogeneity was assessed using Cochran’s Q test and I 2. In case of significant heterogeneity, we used subgroup analysis to explore possible sources of heterogeneity. Heterogeneity was examined through the random-effects model. Sensitivity analysis was performed to examine the extent to which inferences might depend on a particular study. Publication bias was assessed by visual inspection of Begg’s funnel plots. Formal statistical assessment of funnel plot asymmetry was performed by Egger’s regression asymmetry test. We also performed random-effects meta-regression analysis to assess the overall linear relationship between fruit or vegetable intake and risk of depression. In this analysis, RR (95 % CI) for depression in different categories of fruit or vegetable intake, compared with the reference group, were extracted. Next, they were converted to LnRR and were used in this meta-regression. We used a previously described method by Greenland and Orsini for the dose–response analysis( Reference Orsini, Bellocco and Greenland 44 ). The natural logs of RR and CI across categories of fruit or vegetable intake were used to compute study-specific slopes (linear trends) and 95 % CI. We assigned the median or mean amount of fruit or vegetable intake in each category to the corresponding RR for each study. For studies that reported the intakes as ranges, we estimated the mid-point in each category by calculating the mean of the lower and upper bound. When the highest category was open-ended, the length of the open-ended interval was assumed to be the same as that of the adjacent interval. When the lowest category was open-ended, the lower boundary was set to zero. We used 75 g as a vegetable serving and 150 g as a fruit serving. Restricted cubic spline (3) knots at fixed percentiles of 10, 50 and 90 % of the distribution were considered to examine potential non-linear dose–response associations between fruit or vegetable intake and risk of depression. Statistical analyses were conducted using STATA version 11.2 (StataCorp). P values <0·05 were considered statistically significant.
Results
Findings from systematic review
The characteristics of twenty-seven studies included in this systematic review are presented in Tables 1 and 2. These studies were published between 2001 and 2017. Among included studies, sixteen had a cross-sectional design( Reference McMartin, Jacka and Colman 5 , Reference Konttinen, Mannisto and Sarlio-Lahteenkorva 14 , Reference Hintikka, Tolmunen and Honkalampi 16 , Reference Woo, Lynn and Lau 21 , Reference Allgöwer, Wardle and Steptoe 23 , Reference Niu, Guo and Kakizaki 25 – Reference Bishwajit, O’Leary and Ghosh 28 , Reference Shahar, Hassan and Sundar 43 , Reference Whitaker, Sharpe and Wilcox 45 – Reference Mikolajczyk, El Ansari and Maxwell 50 ), nine studies had a cohort design( Reference Akbaraly, Sabia and Shipley 10 , Reference Chi, Wang and Tsai 17 – Reference Mihrshahi, Dobson and Mishra 19 , Reference Gangwisch, Hale and Garcia 22 , Reference Rienks, Dobson and Mishra 29 , Reference Woo, Ho and Yu 30 , Reference Liu, Xie and Chou 42 , Reference Kingsbury, Dupuis and Jacka 51 ) and the remaining two studies were case–control studies( Reference Michalak, Zhang and Jacobi 40 , Reference Payne, Steck and George 52 ). In all, ten publications were reported from European countries( Reference Akbaraly, Sabia and Shipley 10 , Reference Konttinen, Mannisto and Sarlio-Lahteenkorva 14 , Reference Hintikka, Tolmunen and Honkalampi 16 , Reference Sanchez-Villegas, Delgado-Rodriguez and Alonso 18 , Reference Allgöwer, Wardle and Steptoe 23 , Reference Verger, Lions and Ventelou 26 , Reference Michalak, Zhang and Jacobi 40 , Reference El Ansari, Adetunji and Oskrochi 46 , Reference Mikolajczyk, El Ansari and Maxwell 50 , Reference Kingsbury, Dupuis and Jacka 51 ), five studies were reported from American countries( Reference McMartin, Jacka and Colman 5 , Reference Gangwisch, Hale and Garcia 22 , Reference Whitaker, Sharpe and Wilcox 45 , Reference Castellanos, Connell and Lee 49 , Reference Payne, Steck and George 52 ) and eight studies were reported from Asia( Reference Chi, Wang and Tsai 17 , Reference Woo, Lynn and Lau 21 , Reference Niu, Guo and Kakizaki 25 , Reference Aihara, Minai and Aoyama 27 , Reference Bishwajit, O’Leary and Ghosh 28 , Reference Woo, Ho and Yu 30 , Reference Liu, Xie and Chou 42 , Reference Shahar, Hassan and Sundar 43 ), and the remaining four studies were reported from Australia( Reference Mihrshahi, Dobson and Mishra 19 , Reference Rienks, Dobson and Mishra 29 , Reference Crichton, Bryan and Hodgson 47 , Reference Forsyth, Williams and Deane 48 ). All published studies were conducted in adult populations. Four studies were conducted on women( Reference Mihrshahi, Dobson and Mishra 19 , Reference Gangwisch, Hale and Garcia 22 , Reference Whitaker, Sharpe and Wilcox 45 ), one on men only( Reference Castellanos, Connell and Lee 49 ) and twenty-two studies on both genders. Sample sizes ranged from seventy-one people in cross-sectional studies to 125 428 in cohort studies. In total, 289 018 participants were studied. The number of cases varied from 51 to 9739. Most included studies had used FFQ to assess dietary intakes, except for ten studies that had applied 24-h recalls( Reference Shahar, Hassan and Sundar 43 , Reference Whitaker, Sharpe and Wilcox 45 ), dietary history( Reference Niu, Guo and Kakizaki 25 , Reference Forsyth, Williams and Deane 48 ) and food questionnaire( Reference Woo, Lynn and Lau 21 , Reference Allgöwer, Wardle and Steptoe 23 , Reference Aihara, Minai and Aoyama 27 , Reference Bishwajit, O’Leary and Ghosh 28 , Reference Castellanos, Connell and Lee 49 , Reference Kingsbury, Dupuis and Jacka 51 ). A total of sixteen studies had considered fruit intake( Reference McMartin, Jacka and Colman 5 , Reference Akbaraly, Sabia and Shipley 10 , Reference Hintikka, Tolmunen and Honkalampi 16 – Reference Mihrshahi, Dobson and Mishra 19 , Reference Woo, Lynn and Lau 21 – Reference Allgöwer, Wardle and Steptoe 23 , Reference Bishwajit, O’Leary and Ghosh 28 , Reference Rienks, Dobson and Mishra 29 , Reference Liu, Xie and Chou 42 , Reference El Ansari, Adetunji and Oskrochi 46 , Reference Forsyth, Williams and Deane 48 , Reference Mikolajczyk, El Ansari and Maxwell 50 , Reference Payne, Steck and George 52 ), nineteen studies had assessed consumption of vegetables( Reference McMartin, Jacka and Colman 5 , Reference Akbaraly, Sabia and Shipley 10 , Reference Hintikka, Tolmunen and Honkalampi 16 – Reference Mihrshahi, Dobson and Mishra 19 , Reference Woo, Lynn and Lau 21 , Reference Gangwisch, Hale and Garcia 22 , Reference Niu, Guo and Kakizaki 25 , Reference Bishwajit, O’Leary and Ghosh 28 – Reference Woo, Ho and Yu 30 , Reference Michalak, Zhang and Jacobi 40 , Reference Shahar, Hassan and Sundar 43 , Reference El Ansari, Adetunji and Oskrochi 46 – Reference Forsyth, Williams and Deane 48 , Reference Mikolajczyk, El Ansari and Maxwell 50 , Reference Payne, Steck and George 52 ) and in seven other studies total consumption of fruit and vegetables was examined( Reference McMartin, Jacka and Colman 5 , Reference Konttinen, Mannisto and Sarlio-Lahteenkorva 14 , Reference Verger, Lions and Ventelou 26 , Reference Aihara, Minai and Aoyama 27 , Reference Whitaker, Sharpe and Wilcox 45 , Reference Castellanos, Connell and Lee 49 , Reference Kingsbury, Dupuis and Jacka 51 ). One study had considered plant foods including vegetables, legumes, fruits and nuts as the exposure variableReference Crichton, Bryan and Hodgson 47 ). For assessment of mental disorders, nine studies used Center for Epidemiological Studies-Depression Scale (CES-D)( Reference Akbaraly, Sabia and Shipley 10 , Reference Konttinen, Mannisto and Sarlio-Lahteenkorva 14 , Reference Chi, Wang and Tsai 17 , Reference Mihrshahi, Dobson and Mishra 19 , Reference Verger, Lions and Ventelou 26 , Reference Rienks, Dobson and Mishra 29 , Reference Liu, Xie and Chou 42 , Reference Whitaker, Sharpe and Wilcox 45 , Reference Crichton, Bryan and Hodgson 47 , Reference Castellanos, Connell and Lee 49 ), five studies used Geriatric Depression Scale( Reference Woo, Lynn and Lau 21 , Reference Niu, Guo and Kakizaki 25 , Reference Aihara, Minai and Aoyama 27 , Reference Woo, Ho and Yu 30 , Reference Shahar, Hassan and Sundar 43 ), four others had applied Beck’s Depression Inventory (BDI)( Reference Hintikka, Tolmunen and Honkalampi 16 , Reference Allgöwer, Wardle and Steptoe 23 , Reference El Ansari, Adetunji and Oskrochi 46 , Reference Mikolajczyk, El Ansari and Maxwell 50 , Reference Abdi, Salehi and Ghodsi 53 ) and the remaining eight studies had used other questionnaires( Reference McMartin, Jacka and Colman 5 , Reference Sanchez-Villegas, Delgado-Rodriguez and Alonso 18 , Reference Bishwajit, O’Leary and Ghosh 28 , Reference Michalak, Zhang and Jacobi 40 , Reference Forsyth, Williams and Deane 48 , Reference Kingsbury, Dupuis and Jacka 51 , Reference Payne, Steck and George 52 ).
Table 1 Characteristics of studies that reported the relationship between fruit and vegetable intake and depression (Odds ratios, relative risks (RR), hazard ratios (HR) and 95 % confidence intervals; mean values and β-coefficients with their standard errors)
F, female; M, male; GDS, Depression was assessed using the Geriatric Depression Scale; NR, not reported; CES-D, Center for Epidemiological Studies-Depression Scale SF-36; BDI, Beck’s Depression Inventory; K-BDI: Korean version of the BDI (Beck’s Depression Inventory); CIDI-SF, Composite International Diagnostic Interview-Short form; M-CIDI, Munich Composite International Diagnostic Interview; M-BDI: Modification of the Beck’s Depression Inventory; MHI-5, The five-item Mental Health Inventory; YAQ, Youth/Adolescent Food Frequency Questionnaire; ICD-9/10, International Classification of Diseases; MAFF, Ministry of Agriculture, Forestry and Fishery; DASS, Depression, Anxiety and Stress Scale; AHEI, Alternative Healthy Eating Index; STAI-Y, The Spielberger State-Trait Anxiety Inventory, Form Y.
† 1, smoking; 2, alcohol use; 3, areca nut chewing; 4, living arrangement; 5, diabetes mellitus; 6, cognitive status; 7, nutrient density; 8, race-ethnicity; 9, education; 10, income; 11, BMI; 12, hypertension; 13, hormone replacement therapy; 14, stroke; 15, myocardial infarction; 16, Alzheimer’s disease; 17, CVD; 18, cancer; 19, physical activity; 20, stressful life events; 21, social support; 22, energy-adjusted intakes of SFA, MUFA, PUFA and trans-fatty acids; 23, energy intake; 24, menstrual regularity; 25, sex; 26, university; 27, AHEI; 28, Perceived Stress Score; 29, marital status; 30, fish; 31, co-morbidities; 32, age; 33, employment; 34, retirement; 35, HDL-cholesterol; 36, central obesity; 37, socio-economic status ( Reference Wells, Peterson and Welch 41 ); 38, chronic illness; 39, parental marital status; 40, geographic area; 41, impaired instrumental activities of daily living (IADL); 42, self-reported body pain; 43, living alone; 44, fruit/vegetable intake; 45, total fat; 46, dietary supplement use; 47, restrained eating; 48, emotional eating; 49, no. of children; 50, no. of work hours; 51, health consciousness/proxies of overall healthier lifestyle; 52, profession; 53, complementary health cover; 54, number of chronic illnesses; 55, perceived weight; 56, angina; 57, daily coffee drinking; 58, having vocational training; 59, poor subjective health; 60, frequency of eating lake fish, sea fish, fresh vegetables, boiled vegetables and fruit.
Table 2 Characteristics of studies that reported the relationship between fruit and vegetable intake and anxiety (Relative risks (RR), β-coefficients and 95 % confidence intervals)
M, male; F, female; M-CIDI, Munich Composite International Diagnostic Interview; DASS, Depression, Anxiety and Stress Scale; STAI-Y, The Spielberger State-Trait Anxiety Inventory, Form Y; NR, not reported.
† 1, smoking; 2, education; 3, income; 4, BMI; 5, physical activity; 6, energy intake; 7, menstrual regularity; 8, sex; 9, marital status; 10, age; 11, chronic illness; 12, geographic area.
With regard to outcome, only four studies had considered anxiety( Reference McMartin, Jacka and Colman 5 , Reference Michalak, Zhang and Jacobi 40 , Reference Crichton, Bryan and Hodgson 47 , Reference Forsyth, Williams and Deane 48 ). One study had reported OR( Reference Michalak, Zhang and Jacobi 40 ), one had reported correlation coefficients( Reference Forsyth, Williams and Deane 48 ) and two studies had reported β-coefficients( Reference McMartin, Jacka and Colman 5 , Reference Crichton, Bryan and Hodgson 47 ). Owing to the heterogenous form of reporting of the findings, we were unable to perform meta-analysis about anxiety. All studies had considered depression. Four studies reported beta coefficients( Reference El Ansari, Adetunji and Oskrochi 46 , Reference Crichton, Bryan and Hodgson 47 , Reference Castellanos, Connell and Lee 49 – Reference Payne, Steck and George 52 ), one had reported standardised β ( Reference Whitaker, Sharpe and Wilcox 45 ), one reported correlation coefficient( Reference Forsyth, Williams and Deane 48 ) and others had reported RR, HR or OR. OR for the association of fruit intake and depression ranged between 0·61 and 1·10 in different studies. The corresponding figures for vegetable intake varied from 0·63 to 2·75. A total of fourteen studies were of high quality( Reference McMartin, Jacka and Colman 5 , Reference Akbaraly, Sabia and Shipley 10 , Reference Konttinen, Mannisto and Sarlio-Lahteenkorva 14 , Reference Chi, Wang and Tsai 17 – Reference Mihrshahi, Dobson and Mishra 19 , Reference Niu, Guo and Kakizaki 25 , Reference Aihara, Minai and Aoyama 27 – Reference Woo, Ho and Yu 30 , Reference Crichton, Bryan and Hodgson 47 , Reference Mikolajczyk, El Ansari and Maxwell 50 , Reference Kingsbury, Dupuis and Jacka 51 ). Most studies had adjusted for age( Reference McMartin, Jacka and Colman 5 , Reference Akbaraly, Sabia and Shipley 10 , Reference Konttinen, Mannisto and Sarlio-Lahteenkorva 14 , Reference Hintikka, Tolmunen and Honkalampi 16 , Reference Sanchez-Villegas, Delgado-Rodriguez and Alonso 18 , Reference Woo, Lynn and Lau 21 , Reference Niu, Guo and Kakizaki 25 – Reference Bishwajit, O’Leary and Ghosh 28 , Reference Woo, Ho and Yu 30 , Reference Michalak, Zhang and Jacobi 40 , Reference Shahar, Hassan and Sundar 43 , Reference Whitaker, Sharpe and Wilcox 45 – Reference Crichton, Bryan and Hodgson 47 , Reference Payne, Steck and George 52 ), sex( Reference McMartin, Jacka and Colman 5 , Reference Hintikka, Tolmunen and Honkalampi 16 , Reference Sanchez-Villegas, Delgado-Rodriguez and Alonso 18 , Reference Woo, Lynn and Lau 21 , Reference Niu, Guo and Kakizaki 25 , Reference Verger, Lions and Ventelou 26 , Reference Bishwajit, O’Leary and Ghosh 28 , Reference Liu, Xie and Chou 42 , Reference Shahar, Hassan and Sundar 43 , Reference El Ansari, Adetunji and Oskrochi 46 , Reference Crichton, Bryan and Hodgson 47 , Reference Mikolajczyk, El Ansari and Maxwell 50 , Reference Payne, Steck and George 52 ), education( Reference McMartin, Jacka and Colman 5 , Reference Konttinen, Mannisto and Sarlio-Lahteenkorva 14 , Reference Hintikka, Tolmunen and Honkalampi 16 , Reference Woo, Lynn and Lau 21 , Reference Gangwisch, Hale and Garcia 22 , Reference Niu, Guo and Kakizaki 25 , Reference Bishwajit, O’Leary and Ghosh 28 , Reference Rienks, Dobson and Mishra 29 , Reference Michalak, Zhang and Jacobi 40 , Reference Liu, Xie and Chou 42 , Reference Whitaker, Sharpe and Wilcox 45 , Reference Crichton, Bryan and Hodgson 47 , Reference Castellanos, Connell and Lee 49 , Reference Payne, Steck and George 52 ), physical activity( Reference McMartin, Jacka and Colman 5 , Reference Akbaraly, Sabia and Shipley 10 , Reference Konttinen, Mannisto and Sarlio-Lahteenkorva 14 , Reference Hintikka, Tolmunen and Honkalampi 16 , Reference Sanchez-Villegas, Delgado-Rodriguez and Alonso 18 , Reference Gangwisch, Hale and Garcia 22 , Reference Niu, Guo and Kakizaki 25 , Reference Verger, Lions and Ventelou 26 , Reference Rienks, Dobson and Mishra 29 , Reference Crichton, Bryan and Hodgson 47 ), energy intake( Reference Akbaraly, Sabia and Shipley 10 , Reference Konttinen, Mannisto and Sarlio-Lahteenkorva 14 , Reference Sanchez-Villegas, Delgado-Rodriguez and Alonso 18 , Reference Niu, Guo and Kakizaki 25 , Reference Verger, Lions and Ventelou 26 , Reference Rienks, Dobson and Mishra 29 , Reference Whitaker, Sharpe and Wilcox 45 , Reference Crichton, Bryan and Hodgson 47 ), BMI( Reference Konttinen, Mannisto and Sarlio-Lahteenkorva 14 , Reference Sanchez-Villegas, Delgado-Rodriguez and Alonso 18 , Reference Gangwisch, Hale and Garcia 22 , Reference Niu, Guo and Kakizaki 25 , Reference Verger, Lions and Ventelou 26 , Reference Rienks, Dobson and Mishra 29 , Reference Crichton, Bryan and Hodgson 47 , Reference Payne, Steck and George 52 ) and smoking( Reference McMartin, Jacka and Colman 5 , Reference Akbaraly, Sabia and Shipley 10 , Reference Hintikka, Tolmunen and Honkalampi 16 – Reference Sanchez-Villegas, Delgado-Rodriguez and Alonso 18 , Reference Gangwisch, Hale and Garcia 22 , Reference Niu, Guo and Kakizaki 25 , Reference Bishwajit, O’Leary and Ghosh 28 , Reference Rienks, Dobson and Mishra 29 , Reference Liu, Xie and Chou 42 , Reference Crichton, Bryan and Hodgson 47 ). Some had also controlled for income( Reference McMartin, Jacka and Colman 5 , Reference Akbaraly, Sabia and Shipley 10 , Reference Woo, Lynn and Lau 21 , Reference Gangwisch, Hale and Garcia 22 , Reference Verger, Lions and Ventelou 26 , Reference Rienks, Dobson and Mishra 29 , Reference Castellanos, Connell and Lee 49 ), marital status( Reference Akbaraly, Sabia and Shipley 10 , Reference Hintikka, Tolmunen and Honkalampi 16 , Reference Sanchez-Villegas, Delgado-Rodriguez and Alonso 18 , Reference Niu, Guo and Kakizaki 25 , Reference Bishwajit, O’Leary and Ghosh 28 , Reference Rienks, Dobson and Mishra 29 , Reference Michalak, Zhang and Jacobi 40 , Reference Whitaker, Sharpe and Wilcox 45 ) and chronic diseases( Reference McMartin, Jacka and Colman 5 , Reference Akbaraly, Sabia and Shipley 10 , Reference Chi, Wang and Tsai 17 , Reference Woo, Lynn and Lau 21 , Reference Gangwisch, Hale and Garcia 22 , Reference Niu, Guo and Kakizaki 25 , Reference Aihara, Minai and Aoyama 27 ).
Cross-sectional design( Reference McMartin, Jacka and Colman 5 , Reference Konttinen, Mannisto and Sarlio-Lahteenkorva 14 , Reference Hintikka, Tolmunen and Honkalampi 16 , Reference Woo, Lynn and Lau 21 , Reference Allgöwer, Wardle and Steptoe 23 , Reference Niu, Guo and Kakizaki 25 , Reference Aihara, Minai and Aoyama 27 , Reference Liu, Xie and Chou 42 , Reference Whitaker, Sharpe and Wilcox 45 – Reference Crichton, Bryan and Hodgson 47 , Reference Mikolajczyk, El Ansari and Maxwell 50 , Reference Payne, Steck and George 52 ), invalid exposure or outcome assessment tools( Reference McMartin, Jacka and Colman 5 , Reference Akbaraly, Sabia and Shipley 10 , Reference Chi, Wang and Tsai 17 , Reference Mihrshahi, Dobson and Mishra 19 , Reference Woo, Lynn and Lau 21 , Reference Niu, Guo and Kakizaki 25 , Reference Liu, Xie and Chou 42 , Reference Shahar, Hassan and Sundar 43 , Reference Castellanos, Connell and Lee 49 – Reference Kingsbury, Dupuis and Jacka 51 ), lack of controlling for potential confounders( Reference Hintikka, Tolmunen and Honkalampi 16 , Reference Sanchez-Villegas, Delgado-Rodriguez and Alonso 18 , Reference Gangwisch, Hale and Garcia 22 , Reference Niu, Guo and Kakizaki 25 , Reference Woo, Ho and Yu 30 , Reference Whitaker, Sharpe and Wilcox 45 , Reference Kingsbury, Dupuis and Jacka 51 ), using self-reported questionnaire( Reference Konttinen, Mannisto and Sarlio-Lahteenkorva 14 , Reference Chi, Wang and Tsai 17 , Reference Sanchez-Villegas, Delgado-Rodriguez and Alonso 18 , Reference Bishwajit, O’Leary and Ghosh 28 , Reference Woo, Ho and Yu 30 , Reference Mikolajczyk, El Ansari and Maxwell 50 , Reference Payne, Steck and George 52 ), low respondent rate( Reference Mihrshahi, Dobson and Mishra 19 , Reference Woo, Ho and Yu 30 , Reference Kingsbury, Dupuis and Jacka 51 ) and misclassification of participants based on assessing dietary intake by FFQ( Reference Sanchez-Villegas, Delgado-Rodriguez and Alonso 18 , Reference Gangwisch, Hale and Garcia 22 ) were the most common limitations of earlier studies. However, large sample size( Reference McMartin, Jacka and Colman 5 , Reference Konttinen, Mannisto and Sarlio-Lahteenkorva 14 , Reference Mihrshahi, Dobson and Mishra 19 , Reference Woo, Lynn and Lau 21 , Reference Rienks, Dobson and Mishra 29 , Reference Liu, Xie and Chou 42 , Reference Kingsbury, Dupuis and Jacka 51 ), adjustment for most potential confounders( Reference McMartin, Jacka and Colman 5 , Reference Konttinen, Mannisto and Sarlio-Lahteenkorva 14 , Reference Rienks, Dobson and Mishra 29 ), valid exposure or outcome assessment tools( Reference Mihrshahi, Dobson and Mishra 19 , Reference Woo, Lynn and Lau 21 , Reference Rienks, Dobson and Mishra 29 , Reference Liu, Xie and Chou 42 , Reference Whitaker, Sharpe and Wilcox 45 , Reference Kingsbury, Dupuis and Jacka 51 ) and the first study in a special population( Reference Bishwajit, O’Leary and Ghosh 28 , Reference Whitaker, Sharpe and Wilcox 45 ) were mostly reported as strengths of these publications.
Findings from the meta-analysis of fruit intake and risk of depression
Combining six effect sizes from six cohort studies( Reference Akbaraly, Sabia and Shipley 10 , Reference Chi, Wang and Tsai 17 – Reference Mihrshahi, Dobson and Mishra 19 , Reference Gangwisch, Hale and Garcia 22 , Reference Rienks, Dobson and Mishra 29 ), we found that the highest v. the lowest intake of fruit was associated with a 17 % significant reduction in the risk of depression (Fig. 2) (overall RR=0·83; 95 % CI 0·71, 0·98). However, heterogeneity was significant (I 2=84·5 %, P<0·001). To investigate the source of heterogeneity, subgroup analyses were performed on the basis of location, sex, outcome assessment tools and study quality (Table 3). Sex (for female: overall RR=0·92; 95 % CI 0·78, 0·98, I 2=87·3 %, P<0·001, and for both: overall RR=0·72; 95 % CI 0·61, 0·84, I 2=7 %, P=0·34) and location (for Asian countries: overall RR=0·87; 95 % CI 0·78, 0·96, I 2squared=0 %, P=0·62, and for non-Asian countries: overall RR=0·81; 95 % CI 0·62, 1·05, I 2=89·1 %, P<0·001) were the sources of heterogeneity. Combining nine effect sizes from six cross-sectional studies( Reference McMartin, Jacka and Colman 5 , Reference Hintikka, Tolmunen and Honkalampi 16 , Reference Woo, Lynn and Lau 21 , Reference Allgöwer, Wardle and Steptoe 23 , Reference Liu, Yan and Li 24 , Reference Bishwajit, O’Leary and Ghosh 28 ) indicated that the highest v. the lowest intake of fruit was associated with a 24 % reduction in the risk of depression (overall RR=0·76; 95 % CI 0·63, 0·92, I 2=82·7 %, P<0·001) (Fig. 3). To investigate the source of heterogeneity, subgroup analysis was done on the basis of location, sex, dietary assessment tools, outcome assessment tools, energy adjustment and study quality (Table 3). Location (for Asian countries: overall RR=0·62; 95 % CI 0·41, 0·95, I 2=88·6 %, P<0·001, and for non-Asian countries: overall RR=0·93; 95 % CI 0·86, 1·01, I 2=0 %, P=0·62) and outcome assessment tools (for BDI: overall RR=0·89; 95 % CI 0·78, 1·01, I 2=0 %, P=0·72), for self-reported questionnaire: overall RR=0·58; 95 % CI 0·24, 1·38, , I 2=93·2 %, P<0·001, and for other outcome assessment tools: overall RR=0·76; 95 % CI 0·54, 1·07, I 2=87·5 %, P<0·001) were the sources of heterogeneity.
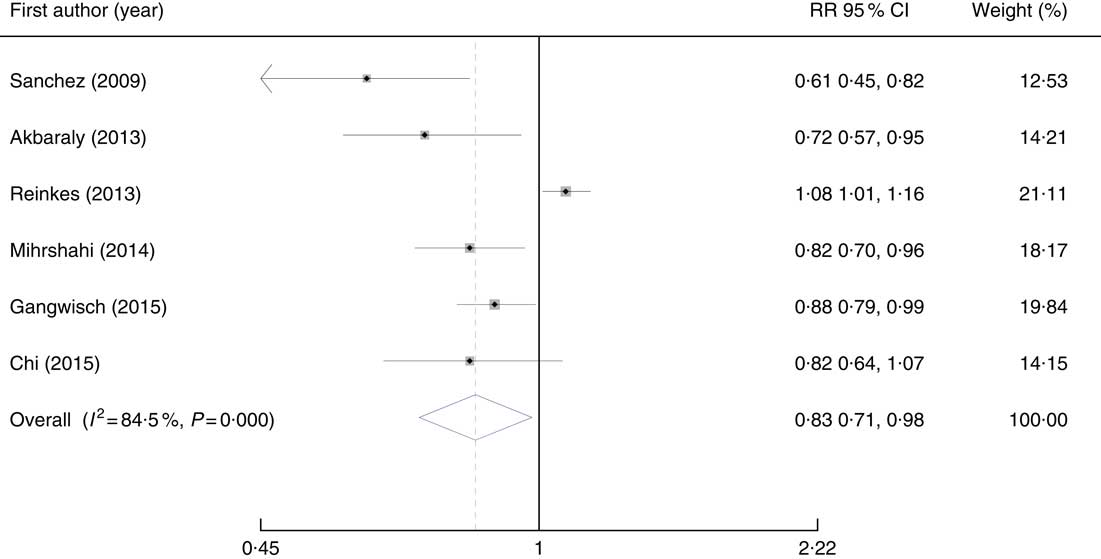
Fig. 2 Forest plots of the association between fruit consumption and risk of depression in cohort studies. RR, relative risk.
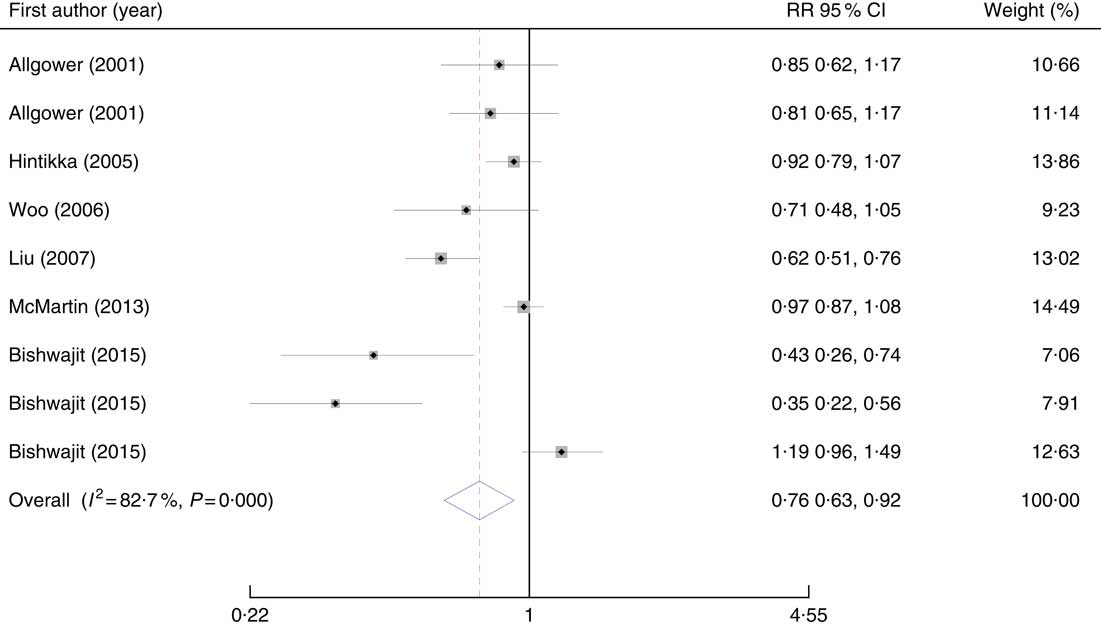
Fig. 3 Forest plots of the association between fruit consumption and depression in cross-sectional studies. RR, relative risk.
Table 3 Results of subgroup analysis for fruit intake and risk of depression based on study design (Odds ratios and 95 % confidence intervals)
CES-D, Center for Epidemiological Studies-Depression Scale SF-36; BDI, Beck’s Depression Inventory.
For non-linear dose–response meta-analysis on fruit consumption, there was only one cohort study that had provided relevant information. Therefore, we excluded this cohort study from the dose–response analysis owing to insufficient number of cohort studies. Finally, the non-linear dose–response analysis on fruit consumption was confined to two cross-sectional studies( Reference Woo, Lynn and Lau 21 , Reference Bishwajit, O’Leary and Ghosh 28 ), which had provided four effect sizes. In this non-linear dose–response analysis, we found that increased intake of fruit was not associated with reduced odds of depression (P non-linearity=0·12) (Fig. 4).
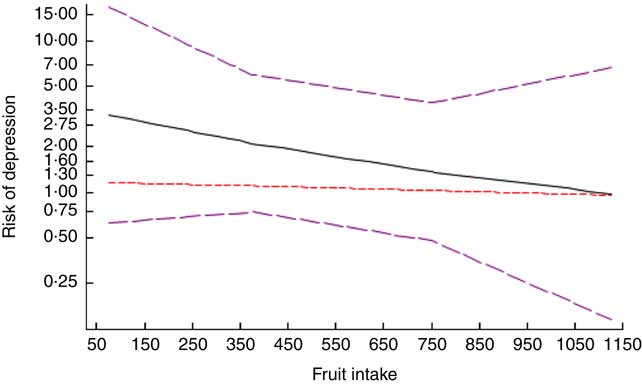
Fig. 4 Dose–response association between fruit consumption and risk of depression in cross-sectional studies. ![]() , Linear model;
, Linear model; ![]() , spline model.
, spline model.
On the basis of meta-regression on three effect sizes from three cohort studies( Reference Chi, Wang and Tsai 17 , Reference Mihrshahi, Dobson and Mishra 19 , Reference Gangwisch, Hale and Garcia 22 ), we found an inverse linear association between fruit intake and risk of depression, such that every 100-g increase in intake of fruit was associated with a 3 % reduction in the risk of depression (RR=0·97; 95 % CI 0·95, 0·99). With regard to cross-sectional studies( Reference Hintikka, Tolmunen and Honkalampi 16 , Reference Woo, Lynn and Lau 21 , Reference Bishwajit, O’Leary and Ghosh 28 ), fruit intake was not linearly associated with the risk of depression (RR=1·00; 95 % CI 0·99, 1·01). Sensitivity analysis showed that the overall effect did not vary substantially with the exclusion of any study. The Begg’s test (P=0·46) and Egger’s test (P=0·07) had shown no publication bias.
Findings from the meta-analysis of vegetable intake and risk of depression
Summary effect from seven effect sizes provided by seven cohort studies( Reference Akbaraly, Sabia and Shipley 10 , Reference Chi, Wang and Tsai 17 – Reference Mihrshahi, Dobson and Mishra 19 , Reference Gangwisch, Hale and Garcia 22 , Reference Rienks, Dobson and Mishra 29 , Reference Woo, Ho and Yu 30 ) showed that high intake of vegetables was associated with a 14 % significant reduction in the risk of depression (overall RR=0·86; 95 % CI 0·75, 0·98, I 2=66·1 %, P=0·004) (Fig. 5). To find the source of heterogeneity, subgroup analysis was conducted on the basis of location, sex, outcome assessment tools and study quality. Sex (for female: overall RR=0·93; 95 % CI 0·86, 1·00, I 2=27·4, P=0·25, and for both: overall RR=0·81; 95 % CI 0·64, 1·02, I 2=53·8 %, P=0·09), location (Asian countries: overall RR=0·88; 95 % CI 0·79, 0·98, I 2=0 %, P=0·38, and for non-Asian countries: overall RR=0·84; 95 % CI 0·68, 1·04, I 2=81·9 %, P=0·001) and outcome assessment tools (for CES-D: overall RR=0·81; 95 % CI 0·65, 1·02, I 2=82·5 %, P=0·001, and for other outcome assessment tools: overall RR=0·89; 95 % CI 0·80, 0·99, I 2=0 %, P=0·45) were the sources of heterogeneity (Table 4). Combining eight effect sizes from six cross-sectional studies( Reference McMartin, Jacka and Colman 5 , Reference Hintikka, Tolmunen and Honkalampi 16 , Reference Woo, Lynn and Lau 21 , Reference Niu, Guo and Kakizaki 25 , Reference Bishwajit, O’Leary and Ghosh 28 , Reference Shahar, Hassan and Sundar 43 ) indicated that higher intake of vegetables was associated with a 25 % reduced risk of depression compared with lower intake of vegetables (overall RR=0·75; 95 % CI 0·62, 0·91, I 2=56·8 %, P=0·023) (Fig. 6). Subgroup analysis on the basis of location, dietary assessment tools, outcome assessment tools, energy adjustment and quality score were performed to investigate the source of heterogeneity (Table 4). None of these variables explained heterogeneity.
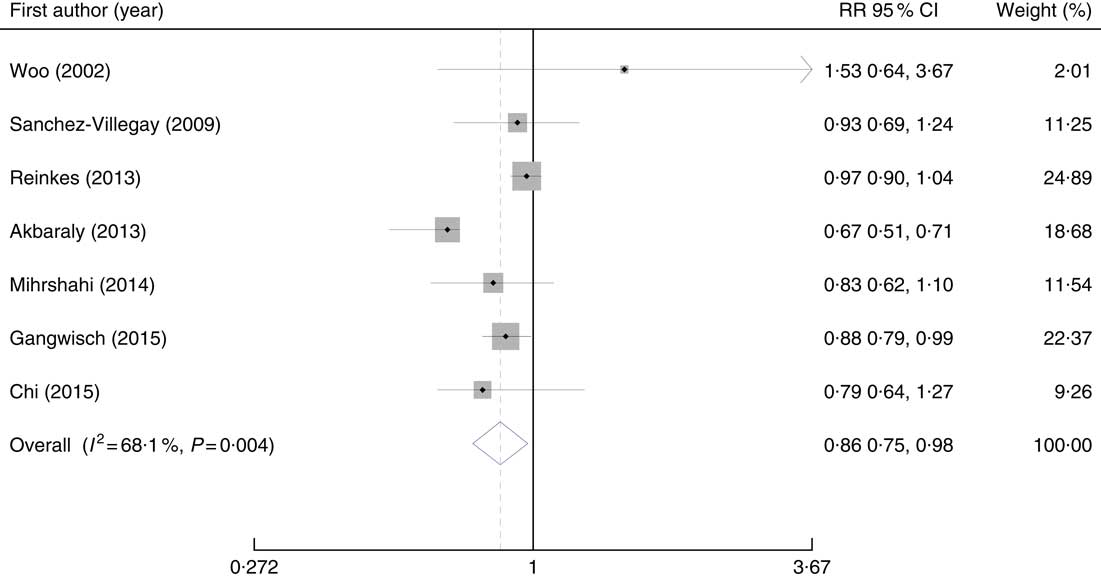
Fig. 5 Forest plots of the association between consumption of vegetables and risk of depression in cohort studies. RR, relative risk.
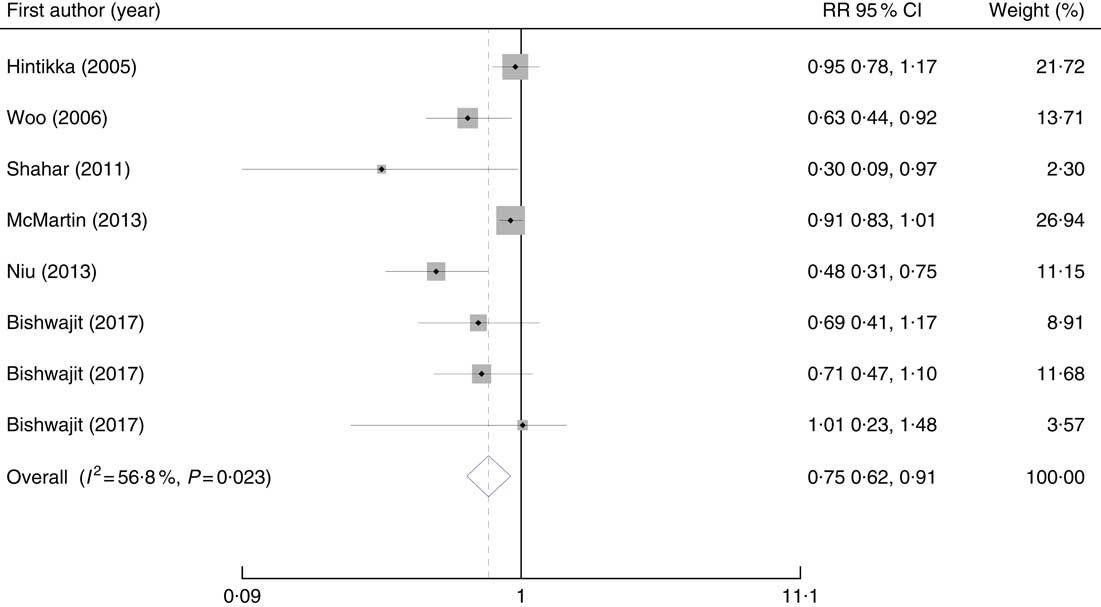
Fig. 6 Forest plots of the association between consumption of vegetables and depression in cross-sectional studies. RR, relative risk.
Table 4 Results of subgroup analysis for vegetable intake and risk of depression based on study design (Odds ratios and 95 % confidence intervals)
CES-D, Center for Epidemiological Studies-Depression Scale SF-36; Geriatric Depression Scale.
A non-linear dose–response meta-analysis of cohort studies on vegetable consumption( Reference Mihrshahi, Dobson and Mishra 19 , Reference Gangwisch, Hale and Garcia 22 , Reference Woo, Ho and Yu 30 ) revealed that increased intake of vegetables (at the level of 100–400 g/d) was associated with a reduced risk of depression; however, vegetable consumption in excess of 400 g/d was associated with an increased risk of depression (Fig. 7(a)). However, these findings were not statistically significant (P non-linearty=0·97). The non-linear dose–response meta-analysis of cross-sectional studies( Reference Woo, Lynn and Lau 21 , Reference Niu, Guo and Kakizaki 25 , Reference Bishwajit, O’Leary and Ghosh 28 ) indicated that increased intake of vegetables was associated with a reduced risk of depression (P non-linearty<0·001) (Fig. 7(b)).
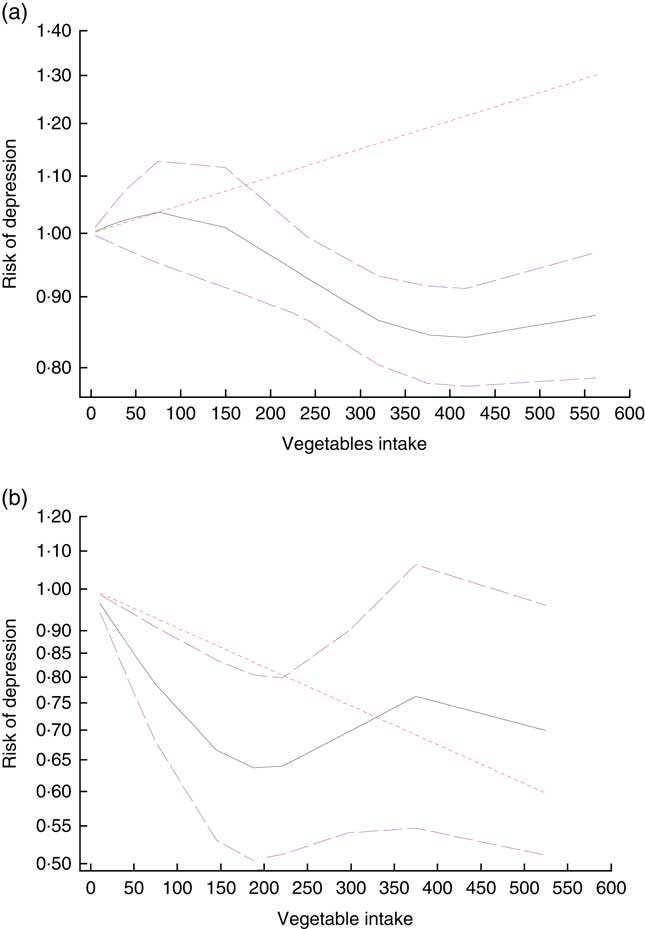
Fig. 7 Dose–response association between consumption of vegetables and risk of depression in cohort (a) and cross-sectional (b) studies. ![]() , Linear model;
, Linear model; ![]() , spline model.
, spline model.
We performed linear meta-regression analysis because of a non-significant non-linear association between vegetable consumption and risk of depression. Four effect sizes from four cohort studies( Reference Chi, Wang and Tsai 17 , Reference Mihrshahi, Dobson and Mishra 19 , Reference Gangwisch, Hale and Garcia 22 , Reference Woo, Ho and Yu 30 ) were included in linear meta-regression. We found that every 100-g increase in consumption of vegetables was associated with a 3 % reduced risk of depression (RR=0·97, 95 % CI 0·95, 0·98). With regard to cross-sectional studies, combining six effect sizes from four studies( Reference Hintikka, Tolmunen and Honkalampi 16 , Reference Woo, Lynn and Lau 21 , Reference Niu, Guo and Kakizaki 25 , Reference Bishwajit, O’Leary and Ghosh 28 ), we found that every 100-g increased intake of vegetables was associated with a 5 % reduced odds of depression (RR=0·95; 95 % CI 0·91, 0·98). Sensitivity analysis showed that none of the studies had a significant effect on the overall effect size. No evidence of publication bias was seen (Egger’s test: P=0·20, Begg’s test: P=0·56).
Findings from the meta-analysis on total fruit and vegetable intake and risk of depression
Overall effect from six effect sizes, obtained from four cross-sectional studies( Reference McMartin, Jacka and Colman 5 , Reference Konttinen, Mannisto and Sarlio-Lahteenkorva 14 , Reference Verger, Lions and Ventelou 26 , Reference Aihara, Minai and Aoyama 27 ), revealed that high intake of fruit and vegetables was associated with a 20 % reduced risk of depression (Fig. 8) (overall RR=0·80; 95 % CI 0·65, 0·98). However, significant heterogeneity was observed between studies (I 2=71·1 %, P=0·004). We performed subgroup analysis on the basis of sex, location, dietary assessment tools, outcome assessment tools and quality score to investigate the source of heterogeneity (Table 5). Location (for Asian countries: overall RR=1·53; 95 % CI 0·96, 2·41, I 2=0 %, P=0·99, and for non-Asian countries: overall RR=0·72; 95 % CI 0·60, 0·87, I 2=69·1 %, P=0·02) and dietary assessment tools (for FFQ: overall RR=0·72; 95 % CI 0·60, 0·87, I 2=69·1 %, P=0·02, and for questionnaire: overall RR=1·53; 95 % CI 0·96, 2·41, I 2=0 %, P=0·99) were the sources of heterogeneity. Sensitivity analysis revealed that none of the studies had significantly influenced the overall effect. No evidence of publication bias was found (Egger’s test: P=0·82, Begg’s test: P=0·57).
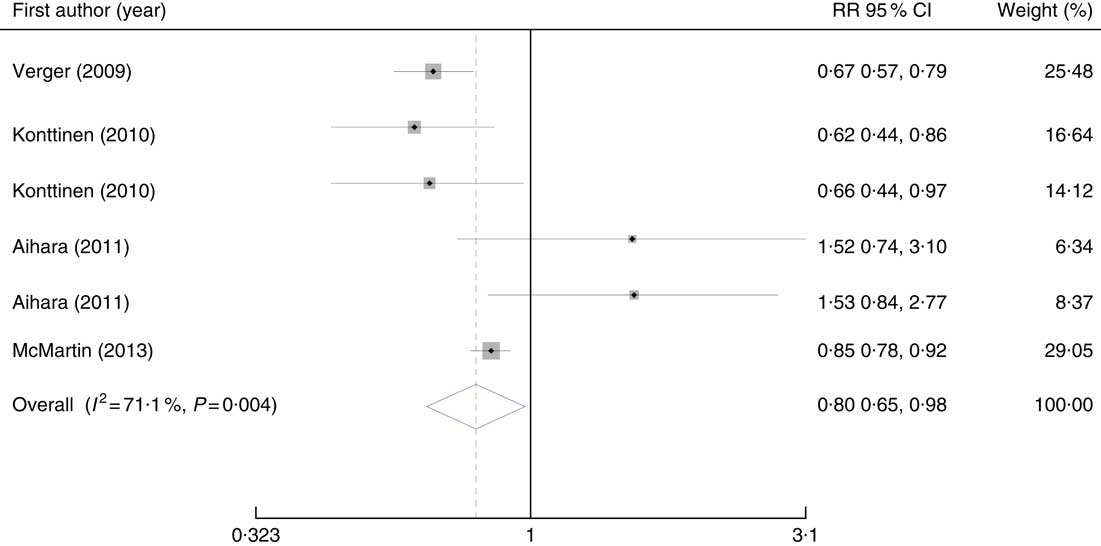
Fig. 8 Forest plots of the association between total intake of fruits and vegetables and risk of depression. RR, relative risk.
Table 5 Results of subgroup analysis for total intake of fruit and vegetables and risk of depression (Odds ratios and 95 % confidence intervals)
MAFF, Ministry of Agriculture, Forestry and Fishery; CES-D, Center for Epidemiological Studies-Depression Scale; GDS, Geriatric Depression Scale; CIDI, Composite International Diagnostic Interview.
Discussion
In this meta-analysis on eighteen studies, we found that high consumption of fruit, vegetables and total fruit and vegetables was significantly associated with reduced risk of depression. However, the magnitude of this association was dependent on the type of studies. We also found that every 100-g increase in the consumption of fruit or vegetables was associated with a 5 % reduction in the risk of depression.
Depression is a serious and common mental disorder, which imposes a substantial burden to both individuals and societies. It is expected to be the first cause of disease and disability by the year 2030( Reference Payne, Steck and George 52 ). Several investigations have suggested that enhanced oxidative stress or defective antioxidant defenses may be related to psychiatric disorders( Reference Niu, Guo and Kakizaki 25 ). Recent investigations have suggested a link between dietary intakes and mental health. Increased intake of fruit and vegetables might be an important global dietary strategy to promote brain function and reduce non-communicable disease( Reference Crichton, Bryan and Hodgson 47 ).
We found an inverse association between fruit, vegetables and total fruit and vegetable intake and the risk of depression. These findings were in line with a previous meta-analysis on ten articles( Reference Liu, Yan and Li 24 ). However, the findings of the previous meta-analysis might be distorted( Reference Saneei, Saghafian and Esmaillzadeh 55 ), owing to the lack of considering several published studies in the field( Reference Akbaraly, Sabia and Shipley 10 , Reference Konttinen, Mannisto and Sarlio-Lahteenkorva 14 , Reference Niu, Guo and Kakizaki 25 , Reference Verger, Lions and Ventelou 26 ) and using inappropriate statistical methods( Reference Saneei, Saghafian and Esmaillzadeh 55 ). In the present meta-analysis, all these points were taken into account. Findings from meta-analyses on the association of dietary patterns and depression have indicated that healthy dietary patterns, greatly loaded with fruit and vegetables, were associated with decreased odds of depression( Reference Lai, Hiles and Bisquera 9 ). This was also confirmed by another systematic review on observational studies( Reference Rahe, Unrath and Berger 56 ). One of the important issues in this regard was that whether it is total fruit and vegetable intake that protects against psychological disorders, or fruit or vegetable consumption per se ( Reference Hu, Huang and Wang 57 ). In the present study, we found that both fruit and vegetable intake, as well as their combination, could protect against the risk of depression in cohort or cross-sectional studies. Only one case–control study( Reference Michalak, Zhang and Jacobi 40 ) had reported OR of the association between vegetable intake and risk of depression, which we did not include in the present analysis owing to several biases in case–control studies. However, combining this study( Reference Michalak, Zhang and Jacobi 40 ) with cross-sectional studies did not result in significant changes in our findings (overall RR=0·80; 95 % CI 0·64, 0·99, I 2=68·4 %, P=0·001). Quality of studies could be one of the reasons for the various results observed in previous studies. High-quality studies( Reference McMartin, Jacka and Colman 5 , Reference Chi, Wang and Tsai 17 – Reference Mihrshahi, Dobson and Mishra 19 , Reference Niu, Guo and Kakizaki 25 , Reference Bishwajit, O’Leary and Ghosh 28 – Reference Woo, Ho and Yu 30 , Reference Akbaraly, Sabia and Shipley 54 ) have reported greater reduction in the risk of depression compared with low-quality studies.
Fruit and vegetables are rich sources of fibre, vitamins and minerals, antioxidants, flavonoids and phytochemicals. This nutrient content has protective effects against depression. In biological systems, some dietary nutrients such as β-carotenes, vitamin E and vitamin C have been reported as effective antioxidants. Oxidative stress, defined as a disturbance in the balance between the production of reactive oxygen species (free radicals) and antioxidant defenses( Reference Betteridge 58 – Reference Burton and Jauniaux 60 ), is thought to contribute to the incidence of depression. Nutrient deficiency might be another plausible pathway for the linkage between fruit and vegetable intake with depression. A deficiency in either folate, which is involved in neurotransmitter synthesis, or vitamin B12 could elevate homocysteine levels and increase the risk of depression( Reference Kim, Stewart and Kim 61 ). Moreover, pyridoxal phosphate, an active form of vitamin B6, is involved in the synthesis of neurotransmitters, such as serotonin, and elevating mood( Reference Williams, Cotter and Sabina 62 ).
This study has some strengths and limitations. Obtaining the overall effect using meta-analysis, applying subgroup analysis to find the source of heterogeneity and using the estimates with a maximum adjustment were among the strengths of the study. The first limitation of our study was seasonal changes in depressive symptoms; these variations might affect the results of the included investigations( Reference Chi, Wang and Tsai 17 ). Another limitation was using different dietary assessment tools in different studies to measure fruit and vegetable intake. This might potentially influence the associations. Dietary recall has higher precision in assessing dietary intakes but measures actual intake and cannot reflect the long-term usual intakes of the population. FFQ, on the other hand, measures long-term usual intakes, but it is subject to many errors introduced as a result of restrictions to a fixed list of foods, memory and perception of portion sizes, which can lead to misclassification of study participants( Reference Lai, Hiles and Bisquera 9 ). Furthermore, different diagnostic criteria were used for defining depression in different studies. Although most applied questionnaires were valid tools, using different ways of scoring and cut-off points to define depression might affect the results( Reference Lai, Hiles and Bisquera 9 ). The inconsistent adjustment for potential confounders among the included studies might also contribute to between-study heterogeneity. We extracted the RR with a maximum adjustment for potential confounders; however, the extent to which these estimates were adjusted and the residual confounding by other unmeasured factors should be considered. Finally, few studies were available investigating fruit and vegetable intake and anxiety relations. More investigations in this regard are needed to draw a conclusion.
This meta-analysis of observational studies provides further evidence that fruit and vegetables intake was protectively associated with depression. The findings support the current recommendation of increasing fruit and vegetable intake to improve mental health.
Acknowledgements
This study was financially supported by a joint collaboration of Endocrinology and Metabolism Molecular-Cellular Sciences Institute, Tehran University of Medical Sciences, and School of Nutritional Sciences and Dietetics, Tehran University of Medical Sciences, Tehran, Iran. Dr A. E. was supported by a grant from Iran National Science Foundation.
F. S., H. M., P. S., A. M., B. L. and A. E. contributed to conception, design, statistical analyses, data interpretation and manuscript drafting. All authors approved the final manuscript for submission.
The authors declare that there are no conflicts of interest.


